
- SAP Community
- Products and Technology
- Technology
- Technology Blogs by SAP
- Best Practices for SAP Analytics Cloud CSV and Exc...
Technology Blogs by SAP
Learn how to extend and personalize SAP applications. Follow the SAP technology blog for insights into SAP BTP, ABAP, SAP Analytics Cloud, SAP HANA, and more.
Turn on suggestions
Auto-suggest helps you quickly narrow down your search results by suggesting possible matches as you type.
Showing results for
radim_bacinschi
Explorer
Options
- Subscribe to RSS Feed
- Mark as New
- Mark as Read
- Bookmark
- Subscribe
- Printer Friendly Page
- Report Inappropriate Content
11-18-2021
5:59 AM
In this blog I will share best practices for performance improvement for CSV and Excel export from SAP Analytics Cloud.
SAP Analytics Cloud supports export to CSV or Excel. CSV can be exported with "All" or "Point of View" options.
** maybe lower when using Universe LDC (Live Data Connection) connection.
a) Click on exclamation mark, on top left side of the table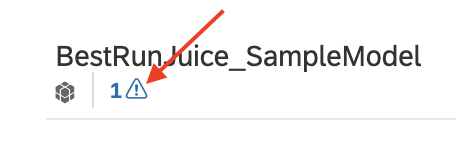
b) Click on Edit Drill Limitations

c) Either select “Custom”, uncheck “Preserve recommended cell limit” and specify “Rows” and “Columns”, click OK.

d) Or select “Unlimited”, click OK.
Either:
The Indicator widget is to use COUNT formula, to include the same dimensions as table and to apply the same filters as the table.
Disclaimer:
This document is provided without a warranty of any kind, either express or implied, including but not limited to, the implied warranties of merchantability, fitness for a particular purpose, or non-infringement. This document is for informational purposes and may not be incorporated into a contract. SAP assumes no responsibility for errors or omissions in this document.
This presentation is not subject to your license agreement or any other service or subscription agreement with SAP. SAP has no obligation to pursue any course of business outlined in this document or any related presentation, or to develop or release any functionality mentioned therein. This document, or any related presentation and SAP's strategy and possible future developments, products and or platforms directions and functionality are all subject to change and may be changed by SAP at any time for any reason without notice. The information in this document is not a commitment, promise or legal obligation to deliver any material, code or functionality.
All forward-looking statements are subject to various risks and uncertainties that could cause actual results to differ materially from expectations. Readers are cautioned not to place undue reliance on these forward-looking statements and they should not be relied upon in making purchasing decisions.
Export types
SAP Analytics Cloud supports export to CSV or Excel. CSV can be exported with "All" or "Point of View" options.
| CSV / All | CSV / Point of View | Excel | ||
| Functionality | Exports all the data, not just the currently visible data. For example, if your chart has a hierarchy, all the nodes of the hierarchy will be exported, even if you have not drilled down on the data in your chart. | Exports what you see in the table grid (all the visible rows and columns), including comment columns, calculations, and hierarchy levels in separate columns. If table has multiple pages then it also exports downloaded data from those pages, limited by drill limitation. | ||
| Component | server-side export | browser-side export | ||
| No more than | 3,000,000 cells** 60 columns | no documented limit* | 500,000 cells | |
| Notes | Measure and dimension names from the data source (not from story) are exported. If you have renamed a measure or dimension, you won't see new names in the exported data. The measure and dimension names from the data source are exported. | * User’s computer / browser memory limits number of cells which can be downloaded into the browser for export | ||
| For a complete dataset export, user first to download all data into the browser by increasing table’s drill limitation | ||||
| For optimal performance 30,000 cells is a recommended limit, downloading more cells is supported but can be slower | ||||
| Default drill limitation is 500 rows x 60 columns. If it is not increased then only first 500 rows (up to 60 columns) are exported | ||||
| Help | help | help | help | |
** maybe lower when using Universe LDC (Live Data Connection) connection.
Restrictions for all export types
- Formatting (such as cell color, font styles, etc.) will not be exported.
- Hyperlinks are removed.
- Hierarchies are flattened.
- For tables, only the table data region is exported. Custom cells outside the data region (for example, on a grid page) are not exported.
- Custom cells and calculations created from story formula bar won’t be exported.
- The export option is disabled if any of the following are valid:
- there is no data in the chart or
- the model used in this story is in Edit mode.
General Best Practices
- Before exporting data, make sure that the number formats are the same for the model and your local machine. For example, if the data you want to export uses a comma as a decimal separator and a period as a thousands separator (123.456,78), you will need to verify that your machine's number format is the same. On a PC, in the Control Panel, go to Clock, Language, and Region > Region > Additional Settings and verify the separator formats.
- If you want to include custom cells (that are outside the table data region) in your export, you need to select all the cells, copy them, and then paste them into Excel.
- Use Include Number Formatting when you want the formatting to exactly match what is in the chart or table. For example, if the table shows $12.04 Million, that is how the value will be exported, even if that is a rounded value.
- Don't use Include Number Formatting if the actual data values are different from those displayed in the chart or table (for example, the actual data has more decimal places).
- Before opening the exported CSV file in Excel, verify that your Excel list separator settings are set correctly.
Performance Best Practices
- If exporting large volume of data in CSV or Excel for the purpose of data analysis in Excel then consider performing as much analysis as possible in SAP Analytics Cloud, so the need for a large volume export is either reduced or eliminated.
- If existing stories don’t provide data which you need and you preform additional analysis in Excel to get that data then consider redesigning stories such that new stories provide the data you need. This way additional analysis in Excel is no longer necessary and with it export to Excel may be no longer needed.
- When exporting, consider exporting only data which you need, don’t export unnecessary data. This can be achieved by selecting story filter values for data you are interested in. Exporting unnecessary data may increase the export time.
- Connecting your laptop to power outlet / power supply and setting power plan to high performance may improve performance.
- Make sure to use a fast network with wide bandwidth as slow network can negatively impact high volume export performance.
- Large amount of data are transferred over the network during export. Enabling gzip compression on the backend side significantly reduces the amount of data to transfer over the network. It can very significantly improve export performance. For example, in case of on-premise data sources a gzip compression can be enabled in on-premise backend server.
- You can check if gzip is enabled by inspecting (in Google Developer Tools, Network tab) response headers from your on-premise backend data sources, for example by inspecting response headers of GetResponse requests. When gzip is enabled the Response Header contains “Content-Encoding: gzip”.

- You can check if gzip is enabled by inspecting (in Google Developer Tools, Network tab) response headers from your on-premise backend data sources, for example by inspecting response headers of GetResponse requests. When gzip is enabled the Response Header contains “Content-Encoding: gzip”.
- Consider using “CSV / All” export type everywhere where it is possible as it uses the power of the backend server more than other export types, and loads browser and user’s laptop less than other export types. Be aware that there are limitations as described in help. For example:
- Export of max 3,000,000 cells is supported.
- Export of max 60 columns is supported.
- The measure and dimension names from the data source (not from story) are exported. If you have renamed a measure or dimension, you won't see new names in the exported data. The measure and dimension names from the data source are exported.
CSV / Point of View or Excel Export Performance Best Practices
- If due to CSV / All export type limitations you cannot use it and you decided to use CSV Point of View or Excel exports and if you are planning to export larger dataset then be aware that CSV Point of View and Excel exports will not be performed at the server, but rather export will be done in the browser after all story data is downloaded into the browser first. Therefore ensure that your computer has lots of free memory to load all the cells which you want to export. Using computers with insufficient memory can impact performance and can limit number of cells you can download and export.
- For optimal performance it is not recommended to save story with a very large drill limitation. Otherwise the user would be forced to wait for the entire dataset download into the browser first (which may take a while for large data sets), before the user even gets a chance to specify desired / reduced drill limitation or to set filters. Instead it is recommended to set a small default drill limitation so initial story loads faster and user quickly gets ability to set desired filters and to configure drill limitation as desired.
- CSV Point of View and Excel :
- For optimal performance 30,000 cells is a recommended limit for drill limitation, downloading more cells is supported but can be slower.
- For Excel 500,000 cells is maximum supported cell limit.
- No documented max cell limit for CSV Point of View export. It is limited by laptop memory / power.
- Default drill limitation is 500 rows x 60 columns. If it is not increased then only first 500 rows and up to 60 columns are exported.
- To improve performance of the export consider unchecking “Repetitive Member Names” option on the table:
- Click on the table
- Click on “…”
- Select “Show/Hide”
- Uncheck “Repetitive Member Names”

- Be aware that CSV Point of View and Excel exports will not be performed at the server, but rather export will be done in the browser after all story data is downloaded into the browser first. CSV Point of View and Excel large volume exports are two step process:
- Step 1: download all data into the browser by increasing table’s drill limitation
- Step 2: trigger export
Step 1: download all data into the browser by increasing table’s drill limitation
- Download data into the browser by increasing table’s drill limitation.
a) Click on exclamation mark, on top left side of the table
b) Click on Edit Drill Limitations
c) Either select “Custom”, uncheck “Preserve recommended cell limit” and specify “Rows” and “Columns”, click OK.
d) Or select “Unlimited”, click OK.
- Wait for data to load. When complete, running three blue dots will disappear.
- Check that all data was successfully loaded by checking the drill limitations icon changed
![]()

Step 2: trigger export
- Click export
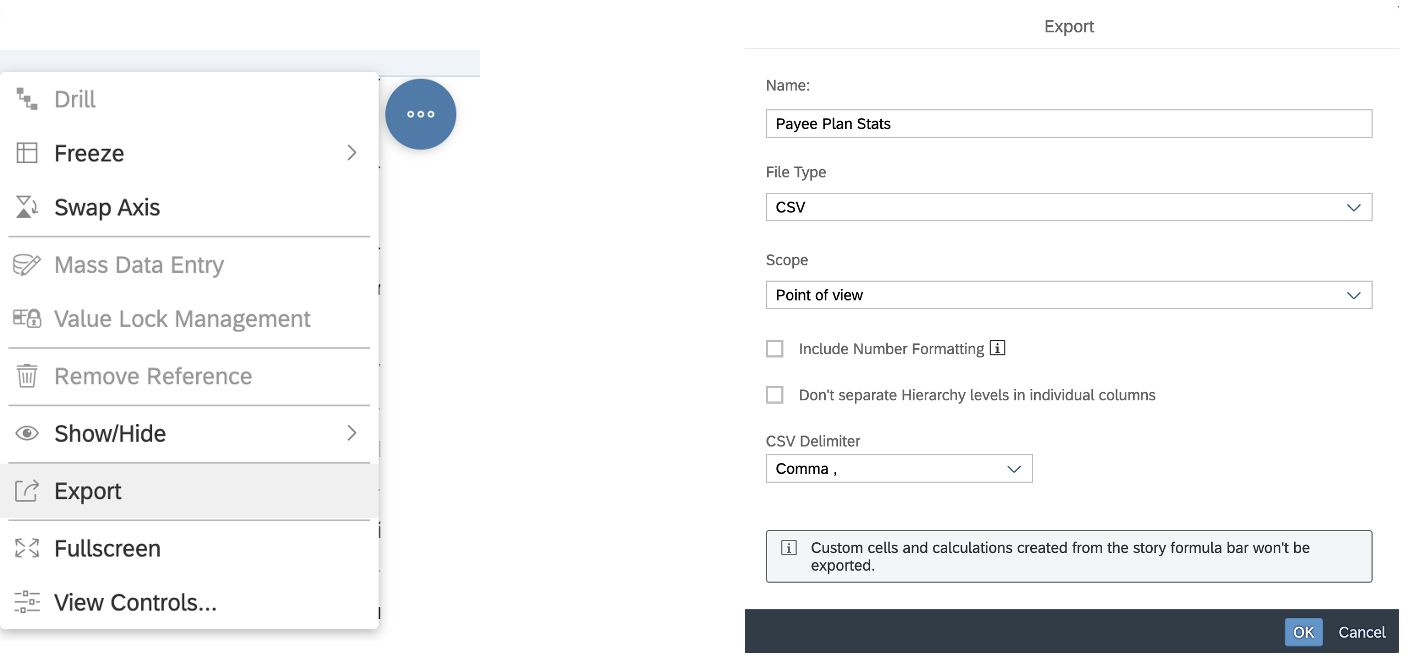
- In case of huge exports on underpowered computer the browser can be less responsive, if prompted, click “wait”.
Determining drill limitation needed for entire dataset export
Either:
- Use an Unlimited setting or Custom setting with a large value which is most likely to be sufficiently large for entire dataset, for example 25,000 rows x 25 rows, etc. Based on your knowledge of data and computers specs, over time you can decide on a large value to use which will be larger than the largest dataset in a table and which computers can handle. OR
- Improve stories by adding an Indicator widget which shows how many rows are in the table. Users can enter this number of rows in the table’s drill limitation.
The Indicator widget is to use COUNT formula, to include the same dimensions as table and to apply the same filters as the table.

Disclaimer:
This document is provided without a warranty of any kind, either express or implied, including but not limited to, the implied warranties of merchantability, fitness for a particular purpose, or non-infringement. This document is for informational purposes and may not be incorporated into a contract. SAP assumes no responsibility for errors or omissions in this document.
This presentation is not subject to your license agreement or any other service or subscription agreement with SAP. SAP has no obligation to pursue any course of business outlined in this document or any related presentation, or to develop or release any functionality mentioned therein. This document, or any related presentation and SAP's strategy and possible future developments, products and or platforms directions and functionality are all subject to change and may be changed by SAP at any time for any reason without notice. The information in this document is not a commitment, promise or legal obligation to deliver any material, code or functionality.
All forward-looking statements are subject to various risks and uncertainties that could cause actual results to differ materially from expectations. Readers are cautioned not to place undue reliance on these forward-looking statements and they should not be relied upon in making purchasing decisions.
- SAP Managed Tags:
- SAP Analytics Cloud,
- SAP Analytics Cloud for planning
Labels:
8 Comments
You must be a registered user to add a comment. If you've already registered, sign in. Otherwise, register and sign in.
Labels in this area
-
ABAP CDS Views - CDC (Change Data Capture)
2 -
AI
1 -
Analyze Workload Data
1 -
BTP
1 -
Business and IT Integration
2 -
Business application stu
1 -
Business Technology Platform
1 -
Business Trends
1,658 -
Business Trends
93 -
CAP
1 -
cf
1 -
Cloud Foundry
1 -
Confluent
1 -
Customer COE Basics and Fundamentals
1 -
Customer COE Latest and Greatest
3 -
Customer Data Browser app
1 -
Data Analysis Tool
1 -
data migration
1 -
data transfer
1 -
Datasphere
2 -
Event Information
1,400 -
Event Information
66 -
Expert
1 -
Expert Insights
177 -
Expert Insights
299 -
General
1 -
Google cloud
1 -
Google Next'24
1 -
Kafka
1 -
Life at SAP
780 -
Life at SAP
13 -
Migrate your Data App
1 -
MTA
1 -
Network Performance Analysis
1 -
NodeJS
1 -
PDF
1 -
POC
1 -
Product Updates
4,577 -
Product Updates
344 -
Replication Flow
1 -
RisewithSAP
1 -
SAP BTP
1 -
SAP BTP Cloud Foundry
1 -
SAP Cloud ALM
1 -
SAP Cloud Application Programming Model
1 -
SAP Datasphere
2 -
SAP S4HANA Cloud
1 -
SAP S4HANA Migration Cockpit
1 -
Technology Updates
6,873 -
Technology Updates
423 -
Workload Fluctuations
1
Related Content
- SAP Queries/Infoset Queries data import to SAC (SAP ECC not on HANA) in Technology Q&A
- Improving Time Management in SAP S/4HANA Cloud: A GenAI Solution in Technology Blogs by SAP
- IoT - Ultimate Data Cyber Security - with Enterprise Blockchain and SAP BTP 🚀 in Technology Blogs by Members
- SAP Analytics Cloud - Performance statistics and zero records in Technology Blogs by SAP
- Unify your process and task mining insights: How SAP UEM by Knoa integrates with SAP Signavio in Technology Blogs by SAP
Top kudoed authors
| User | Count |
|---|---|
| 40 | |
| 25 | |
| 17 | |
| 14 | |
| 8 | |
| 7 | |
| 7 | |
| 7 | |
| 6 | |
| 6 |