The
SAP ALM plug in for
Grafana lets you extend your analytics solutions for application life-cycle management by visualizing SAP Cloud ALM data.

Grafana is an open-source dashboarding solution. It provides a graph composer for visualization of data sources primarily stored in time-series.
With the SAP ALM plugin you are able to connect your
SAP Cloud ALM tenants and get data in table format or time-series format to get new insights on your different ALM processes like
Task/Project management or
Integration monitoring:

SAP Cloud ALM Query
Queries are how Grafana panels communicate with data sources to get data for the visualization.
The SAP Cloud ALM query editor defines a form that help you write queries to access your SAP Cloud ALM tenants using the
SAP Cloud ALM Analytics API.

- Format As: You can select the response format.
- Time Series: data is returned in time series format.
- Table: data is returned in table format for the most recent time frame in the requested period.
- Raw: data is returned in table format without any transformation.
- Legend: name of query. It will be used as legend or as part of legends if the query retrieves multiple dataset.
- Data Provider: Area or application of the destination system to retrieve data from.
Checkout the SAP Cloud ALM API guide to get the list of supported data providers.
- Filters: attributes used as filter criteria for retrieving data.
- Dimensions: one or many dimensions to request.
- Measures: the measures to request.
Time Series Format
Time series format is used in general for chart visualization.
In graph chart:

Or in stat chart:

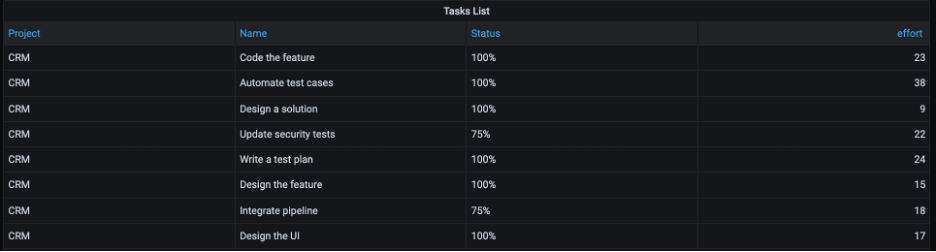
Table Format
Table format is used for table visualization of data in row/column format for the most recent time frame in the requested period.
RAW Format
Raw format is used for table visualization of data without any transformation.

Query Variables
The plugin supports dashboard variables for query to provide a more dynamic approach to dashboards.
Variables are declared in the dashboard Settings:

Variables are used in the query parameters filters.

Variable values are selected directly in the dashboard.

Thanks for reading.
