
- SAP Community
- Products and Technology
- Technology
- Technology Blogs by SAP
- Understanding and troubleshooting "Synchronous Tim...
Technology Blogs by SAP
Learn how to extend and personalize SAP applications. Follow the SAP technology blog for insights into SAP BTP, ABAP, SAP Analytics Cloud, SAP HANA, and more.
Turn on suggestions
Auto-suggest helps you quickly narrow down your search results by suggesting possible matches as you type.
Showing results for
tiago_mfuhr
Explorer
Options
- Subscribe to RSS Feed
- Mark as New
- Mark as Read
- Bookmark
- Subscribe
- Printer Friendly Page
- Report Inappropriate Content
11-04-2021
9:11 AM
Introduction
In this blog post, our aim to explain about the error "Synchronous Timeout Exceeded" in SAP Process Integration/SAP Process Orchestration and provide some troubleshooting tips which will help better understand where exactly is the problem and how to avoid/prevent it in the future.
Messaging System
To better understand this blog post, it is expected that you have some kind of knowledge on how the Messaging System works. It is advised to read the blog post Tuning the PI/PO Messaging System Queues, which provides a good overview of it.
Synchronous Timeout Exceeded
Every synchronous message which is processed by a SAP Process Integration/SAP Process Orchestration system has an internal timeout. This is to ensure that it follows the synchronous pattern and that it must be processed within this time. So once a message is created, it has this exact time to complete its processing, no matter at what exactly it is doing. If it doesn't complete its processing and return a response to the sender system, then the system will raise the error "Synchronous Timeout Exceeded".
This usually comes along with the MessageExpiredException error as well.

How the message timeout is defined?
This timeout is defined once the message is created within the SAP Process Integration/SAP Process Orchestration system. This occurs at the Sender Communication Channel. If there is a timeout parameter set in the Communication Channel, then this parameter will be the one considered for the internal message timeout (for example parameter "syncTimeout" for module "CallSapAdapter" in a SOAP Sender Communication Channel).

If no specific parameter is defined at the Communication Channel, then the default message timeout from the system will be used. For AEX systems (Java-only), It is defined by the parameter "xiadapter.outbound.timeout.default" within the Service "XPI Adapter: XI".

Why would a message timeout?
If you see the error "Synchronous timeout exceeded" in your system, then this means that message wasn't able to complete its processing within the defined timeout. This usually occurs due to the following reasons:
- The receiver system takes more time to process the request than the timeout value configured. So once the message is sent to the receiver system, it takes too long to send a response back to PI/PO, which then can't send a response back to the sender system, and therefore the message timeout is triggered and the message fail.
- This usually occurs in case there is some performance issue at the receiver system, or the receiver system has to perform a lot of activities once the request is received, which is then expected to take some long time (for example, executing a Z program which fetches and handle a lot of data)
- There is high load of messages in the system and there are not enough resources (adapter threads) available to process all the messages at once. So the new messages have to wait for the adapter threads to be free, and in some cases, this wait can be as long as the message timeout, and therefore the message timeout is triggered and the message fail.
Usually the problem 1) also leads to the problem 2), as the adapter threads are all occupied waiting for the response from the receiver system, and therefore new messages can't ever get a free adapter thread (and if they do they will also be waiting for a response from the receiver system). This is like a snowball and can happen for one scenario or all the scenarios which share the same adapter thread.
Troubleshooting
In order to show you some troubleshooting tips, I have created an integration scenario in my SAP Process Integration system where I can reproduce the "Synchronous timeout exceeded" error.
The scenario is:
- Postman -> SOAP Sender -> PI (Message Mapping) -> REST Receiver -> PI REST Adapter
- PI REST Receiver -> REST Sender -> PI (Java Mapping) -> REST Receiver -> REST dummy endpoint
Using this double scenario setup, I can put a thread.sleep in the Java Mapping of the second scenario, which will simulate a delay in the response from the receiver system.
The message timeout is set to 5 minutes. So once 5 minutes goes, the error will be raised in the message processed in the first scenario.
Necessary traces/logs
The message audit logs can tells us a little bit about the situation, however in order to get more details about the current situation of the system and better understand the problem we will need some traces. For that, we will use the XPI Inspector tool, which is available in SAP Note 1514898 - XPI Inspector for troubleshooting SAP Process Orchestration / Integration.
For an overview of the tool, feel free to check SAP Wiki Tracing PI issues with XPI Inspector tool
Once you deployed the XPI Inspector tool in your system, open it and capture a trace with the following settings:
- XPI Inspector trace Example 51 (Performance)
- Select 5 thread dumps with 30 seconds interval
- Select Messaging System
- Select SAP System State
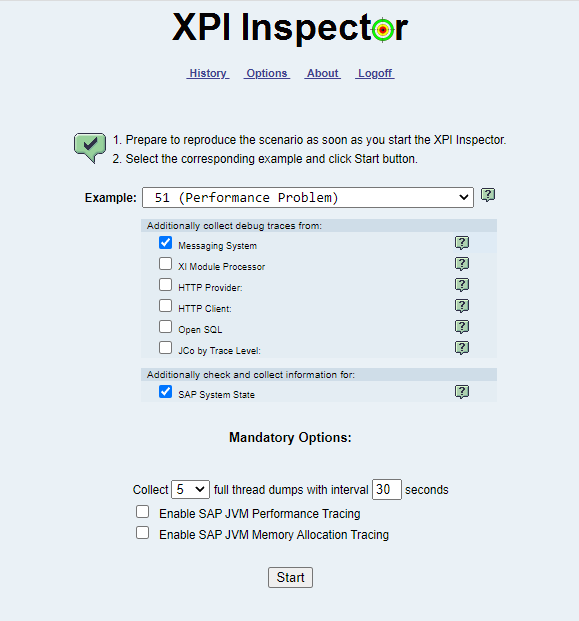
This trace needs to captured while the issue is happening, as they will capture relevant information about the system threads, adapter threads and the messaging system of the PI/PO system.
If the trace is not captured while the problem is happening, it will not assist in any way in identifying the problem.
Alternatively, if the system is too slow to run the XPI Inspector traces, you can also try to get thread dumps in a different way. More in SAP Note 1095473 - How to get a full thread dump in AS Java
Message Audit log
Checking the Message Audit Log can provide some useful information already, like if the message is timing out while waiting for an adapter thread to be available, or if while waiting for a response from the receiver system.
It all comes to identify at which step of the message processing the "Synchronous timeout expired" error was thrown:
- If you check the message audit log and you can see the error is right after the step in which the call is made to the receiver system, then it is happening while waiting for a response. Usually you will see that it happens exactly once the defined timeout is reached

- If you check the message audit log, and you can see the error is right after the step in which the message is handed over to the queue, then it is happening because the message is waiting for resource, and can't get it before the timeout.

- If you check the message audit log, and you can see the error is right after the step in which the message mapping is being executed, then this means that probably the mapping is taking too much time. This can happens mostly when you have some kind of lookup within the mapping which would connect to an external system to get some data. In such cases it could be the mapping itself or the external call within the mapping which is taking too long.

Also it is important to iterate that in some some situations, there can a mix of the 3 situations above. So it is always important to check the whole message audit logs and pay attention mostly to the timestamp in each step.
For example, in case there is a performance issue in the receiver system and a lot of new messages are arriving, it could be that one message times out and another message which was waiting in the queue for a long time receive a resource to process it. So once it receives the resource it makes the call and right after it the "Synchronous timeout exceeded" is raised. But when checking the message audit logs, you will see that it took for example 4 minutes in the queue and just 1 minute after the call to the receiver system.
So again, the timestamps play a huge role here to better understand it.
XPI Inspector trace
Within the XPI Inspector trace, there are 2 important things to check. The Messaging System Overview and the Thread Dumps itself.
Messaging System Overview:
Once you open the Result page in the XPI Inspector trace, you can open the Messaging System Health Check page:
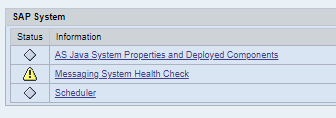
Once the page is open, you can scroll down until you reach the MS Queues table. This table will show all the information about the current adapter thread usage within each adapter queue for all server nodes running in the system.
When the issue is happening, you will see the Call threads (responsible for synchronous message processing) for your sender adapter with all (or with some*) entries in use:

In this case, as my scenario is SOAP -> REST, we can see that the SOAP Call threads are all in use ( 5 out of a maximum 5). This means that whenever a new request reaches the system it will have to wait in the DispatchDisp queue (or in the Adapter call waiting queue*). So when I triggered 4 more request to this scenario, they were allocated into the DispatchDisp queue and will be waiting for a SOAP Call thread to be released so it can continue its processing.
The messages which are within the SOAP Call threads will be in status Delivering, while the messages waiting in the DispatchDisp will be in status To Be Delivered.
* This depends on your message parallelism configuration
Thread dumps:
The next step is to check the thread dumps captured in the XPI, as they will provide information about what exactly the thread in the sender adapter Call is doing that it is taking too long to be released.
So in the XPI Inspector trace, you can click in the Show Full Thread Dumps. (If you have more than one server node, you can click in the one which is currently using all the adapter threads, which can be identified from the MS Queues, as shown above)

This will open the Thread Dump Overview, which will have some general information about thread usage within the system. For us, the most important are the ones which are under the Application Threads section, which are the ones related to the adapter threads. If there are entries in the DispatchDisp, you can see some entries in the Application Managed Threads section.

Just by a simple look at it, we can already see 5 threads from the SOAP Adapter Call which are currently being executed by the Messaging System. In every thread dump taken, they were at a runnable status, which is an indication that they are running and probably waiting for something.
There are two ways to check it further:
- You can click in the thread name itself, which will open the thread stack of that thread, and will give some overview of what it was processing:

- Or open the whole thread dump file (at the top of the page, select the dump you want to see and click in Download), once opened the thread dump, you can search for the thread name and then retrieve more details about it


So from the thread above, we can see that the REST Adapter (the adapter from the receiver communication channel) is executing a call to the configured target server, and is waiting for a response from. Whenever you see "java.net.SocketInputStream.read", "java.net.SocketInputStream.socketRead0", this means that the system is waiting a response from the server it has connected to.
In the "additional info" line, it will always contain the remote IP address (server SAP Process Integration is connecting to) and the local IP address (the IP of the SAP Process Integration system itself). This can show you which system is taking long to reply back.
Conclusion
If you read this whole blog, you should be able to have a better understanding of this error and possibly will be able to troubleshoot it on your own it if it happens in your SAP Process Integration/SAP Process Orchestration system.
As mentioned earlier, in most customer cases which I worked on SAP Support, this error happened because there were some performance issue at the receiver system. So please always check with your receiver system if there is any performance issues within their system. The troubleshoot above will also help you identify it.
Given the above, there are a few things that can be done in the SAP Process Integration/SAP Process Orchestration which can help minimize the impact of such kind of issues (as the main problem usually resides in the receiver system as discussed above).
- If you know that the receiver system will take at least a x number of minutes to process the request and send a response back, then please set the timeout value in the sender communication channel to a value higher than x
- If there are several scenarios which relies on the same adapter thread (huge number of synchronous scenarios with SOAP Sender communication channel for example), please ensure that you have configured a maximum number of threads for the SOAP Call adapter thread to a value higher than 5.
- If one scenario contains a very high load of messages in the system and this error happens frequently for this scenario and other scenarios which are not related (despite using the same adapter thread), then please consider configuring message parallelism, as it will avoid that one scenario use all the adapter threads and the other scenarios can't get an adapter thread as well.
For info on the above configurations, please check:
- SAP KBA 1593920 - Synchronous SOAP sender calls: fine tune PI under high load
- SAP KBA 1623356 - "To be delivered" messages in Adapter Engine
Another related SAP Documentation which might be informative about this topic:
- SAP Managed Tags:
- SAP Process Integration,
- SAP Process Orchestration
Labels:
11 Comments
You must be a registered user to add a comment. If you've already registered, sign in. Otherwise, register and sign in.
Labels in this area
-
ABAP CDS Views - CDC (Change Data Capture)
2 -
AI
1 -
Analyze Workload Data
1 -
BTP
1 -
Business and IT Integration
2 -
Business application stu
1 -
Business Technology Platform
1 -
Business Trends
1,661 -
Business Trends
87 -
CAP
1 -
cf
1 -
Cloud Foundry
1 -
Confluent
1 -
Customer COE Basics and Fundamentals
1 -
Customer COE Latest and Greatest
3 -
Customer Data Browser app
1 -
Data Analysis Tool
1 -
data migration
1 -
data transfer
1 -
Datasphere
2 -
Event Information
1,400 -
Event Information
64 -
Expert
1 -
Expert Insights
178 -
Expert Insights
276 -
General
1 -
Google cloud
1 -
Google Next'24
1 -
Kafka
1 -
Life at SAP
784 -
Life at SAP
11 -
Migrate your Data App
1 -
MTA
1 -
Network Performance Analysis
1 -
NodeJS
1 -
PDF
1 -
POC
1 -
Product Updates
4,577 -
Product Updates
329 -
Replication Flow
1 -
RisewithSAP
1 -
SAP BTP
1 -
SAP BTP Cloud Foundry
1 -
SAP Cloud ALM
1 -
SAP Cloud Application Programming Model
1 -
SAP Datasphere
2 -
SAP S4HANA Cloud
1 -
SAP S4HANA Migration Cockpit
1 -
Technology Updates
6,886 -
Technology Updates
407 -
Workload Fluctuations
1
Related Content
- Kyma Integration with SAP Cloud Logging. Part 2: Let's ship some traces in Technology Blogs by SAP
- explore the business continuity recovery sap solutions on AWS DRS in Technology Blogs by Members
- Connection restrictions and their relation to user groups in SAP HANA Cloud, SAP HANA Database in Technology Blogs by SAP
- Elevating Customer Engagement: Harnessing the Power of SAP Chatbots for a Personalized Experience in Technology Blogs by Members
- SAP Datasphere - Space, Data Integration, and Data Modeling Best Practices in Technology Blogs by SAP
Top kudoed authors
| User | Count |
|---|---|
| 13 | |
| 10 | |
| 10 | |
| 7 | |
| 7 | |
| 6 | |
| 5 | |
| 5 | |
| 5 | |
| 4 |