Introduction
In this blog post you find the step-by-step instructions on how to create the SAP Analytics Cloud Story for one of the task monitoring scenarios: the
Currently Running Task.
As a prerequisite, you need to implement the SQL View for Reporting as described in the previous blog. See here:
https://blogs.sap.com/2021/10/12/sap-data-warehouse-cloud-data-integration-monitoring-sample-content...
Currently Running Task
The table will show the list of running tasks - and the runtime duration up to now (Column Duration). So with every refresh of the query, the duration will increase.
Typically an administrator is interested in the average and median of the previous completed runs. This gives an indication on the expected runtime until the task will be completed.
Calculating an alert measure helps to identify unexpected long running tasks - by e.g. comparing the actual duration with the median of the past runs.
Now let us create all calculated measures first ...
Step 1: Create Calculated Measures
We need five calculated measures for our table. The screenshots support you creating these measures.
Measure 'Count Completed':
This is the same as described in the previous blog. Please check if you already created this one.
We are using the constant selection here. This setting ensures that we can count the tasks with status completed, although we have a query filter set to
Status = Running. For this particular measure the query filter for the
Status dimension is ignored.
Important: Select “Enable Constant Selection” to have the correct values being displayed
Measure 'Duration Completed':
Important: Select “Enable Constant Selection” to have the correct values being displayed
Measure 'Duration Completed Median':
Measure 'Duration Completed Average':
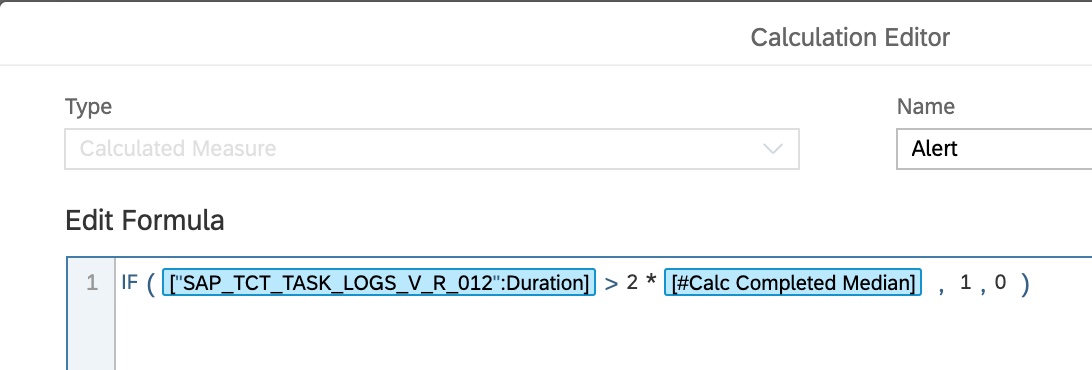
Measure 'Alert':
This calculation defines the alerting rule. For this blog I have chosen to set the value to 1 ( = Alert ) if the runtime exceeds the median by a factor of two. Feel free to adjust it to your needs. Here it is a good idea to define some color highlighting to increase the visibility of long running candidates.
Step 2: Build the Table - Dimensions
The effort of defining the measure is done - great. Now let us start building the table allowing you to report on the currently running tasks.
Distribute the dimensions as shown in the screen shot below and set the filter for
Status to
Running.
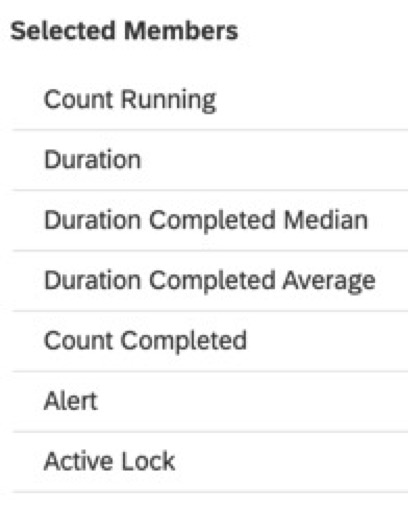
Open the dialog for selecting measures. Choose the following once from the list:
Step 3: Start Report - Usage Hints
Now it is time to give the new report a try - you should now see a list of running tasks and might wonder about the some figures ...
Unexpected Large Number of Entries
The report currently has no filter with respect to start time. In case of past execution failures it could happend that several entries remained in the status "RUNNING" although in fact nothing is active any more.
To workaround this situation you might want to add an input control for Start Date to include e.g. the past three days only. Note that this filter would also restrict the number of completed execution use to calculate the average and median.
Even then it might happen that you have two or more entries for a given schedule. To surface this situation the measure
Count Running has been added to the view. Typically this measure shows up with the value 1.
Active Lock
This shows the lock status from the task framework perspective. Note that in the whole stack several locks are created (e.g. by HANA as well). This particular one is owned by the task framework and is responsible for message like "can't start task as another tasks currently holds a lock.
I have added it here to give you a hint when investigating unexpected long running tasks. If the lock is gone ( has the value 0 ) you can assume that there is no active process available any more. Still for HANA based data integration tasks like view persistence or remote replication
Count Running
The
Count Running is used to validate that the figures you see are related to a single entry only.
Count Completed
The
Count Completed indicates how many entries are considered for the calculation of the average and median. If you see just a few the prediction might not be reliable.
Navigation to Detail View
As shown in the last blog post (
https://blogs.sap.com/2021/10/12/sap-data-warehouse-cloud-data-integration-monitoring-sample-content...) you might also want to add a hyperlink referring the detailed monitoring for additional details
Conclusion
The overview of running tasks is a great help for a health check. It supports you in checks like "Do I see long running tasks?" or "What is currently active and ongoing on my system?" and more.
I’d be happy to hear your thoughts, ideas and comments on this monitoring topic. Let me know in the comments!