SAP Profitability and Performance Management could adapt functionalities that came from BW Integrated Planning, e.g. Aggregation Levels, Planning functions, sequences and so on. You can create simple input-ready query via SAP Profitability and Performance Management and it automatically can generate all necessary objects in background – and that is great, because you don’t need to spend your time on creating those objects and you can focus on reporting or planning.
Also, it is worth to mention that all businesses use hierarchies to clarify their services/products etc. Those hierarchies are available for reporting feature to clarify and “group” characteristics – it makes more sense on reporting for employees of the company.
From SAP Profitability and Performance Management reporting feature hierarchies are also available – even in input ready query – meaning using this solution you can directly create a bottom-up planning. But have you ever wondered how you can maintain top-down planning in this product? In this blog I will guide you step-by-step how to do it.
Note:
For those of you, who don’t know the difference between bottom-up and top-down planning, here is few words of clarification:
Bottom-up planning – means you will plan on lowest hierarchy level possible. After saving data is aggregated to “upper” nodes. As given in example below: we fill data on country level, and after saving (green arrow) data is aggregated on “upper” node - continent

Fig.1 Bottom-up planning example
Top-down planning – means we would like to plan on “upper” nodes and after saving data is distributed to “lower” levels of hierarchy nodes. In the example below: We fill data on continent level. After saving, you can see that data is spread evenly into “lower” levels of hierarchy – in this case countries.

Fig.2 Top-down planning example
Unfortunately, you are not able to achieve such functionality directly in SAP Profitability and Performance Management (roll-up values from hierarchy node to underlying leaves), nevertheless here we can use one of the best feature of SAP Profitability and Performance Management – wherein the solution can use functionalities from SAP BW. In that case functionality that you can use for this purpose (not so complicated), but for sure meets your requirements.
So, let’s start! For top-down planning on hierarchy, we need hierarchy with external characteristic on hierarchy level, so we need two Info Objects: Country and Continent. I will begin by creating BW Info Objects or Environment Info Objects. As spoken earlier: I will have 2 characteristics: Continent - YBW_CH003, with master data as below:

Fig.3 Master Data of Info Object YBW_CH003
and Country - YBW_CH002:

Fig.4 Master Data of Info Object YBW_CH002
When defining the 2nd characteristic (YBW_CH002 – Country) you also need to define the usage of external characteristic for hierarchy in Modeling Tool (SAP BW RSD1 transaction or SAP HANA Studio) level:

Fig.5 Adding external characteristic to hierarchy of Info Object YBW_CH002
If we do so, we can define hierarchy which can have both: Country and Continent Info Object’s values. In next step, I will maintain the hierarchy for YBW_CH002 – country as such:

Fig.6 Hierarchy of Info Object YBW_CH002
Then, you need to define SAP BW/PaPM key figure (like sales revenue in your example).

Fig.7 Example key figure
Based on the 2 characteristic and 1 key figure, I am defining Model BW function in SAP Profitability and Performance Environment (planning enabled). Another possibility is to define SAP BW Info Provider directly in SAP BW Modeling environment.
In my example, I am creating advance DSO using this tool (Model BW function), the definition is like below:

Fig.8 Model BW function in SAP PaPM
Now, I am defining a query in SAP PaPM (mainly to generate aggregation level (SAP BW object which allows manual data input via query), but you can also use it as a base for external query (SAP BEx query) which I will define later on to meet roll-up planning functionality. SAP PaPM editable query definition looks like:

Fig.9 Query function needed to create aggregation level
After query function activation in SAP PaPM you can check aggregation level technical name in the following way:

Fig.10 Finding Aggregation level name
In this example, I will create external query by myself using SAP HANA Studio query designer tool, but I remember to make that query on top of generated Aggregation Level: YA1000028.
Row definition - YBW_CH002 country characteristic included with hierarchy enabled and access to master data – as below on 2 next screens.

Fig.11a HANA Studio BW-MT – query definition

Fig.11b HANA Studio BW-MT – query definition
Column definition – YBW_SRV1 key figure with the following properties. Be strictly aware about that disaggregation and distribution parts – those are crucial for making Top-Down planning.

Fig.12 HANA Studio BW-MT – query definition
And now you can run this query in SAP BW reporting tools (like Analysis for Office – see below) or SAP PaPM and use roll-up functionality:
First step is to run query in Analysis for Office and post some values to any countries (in my example country 01 = 100 EUR, country 02 = 300 EUR). Save your data or just only recalculate, to get totals on “Europe” level (hierarchy node).
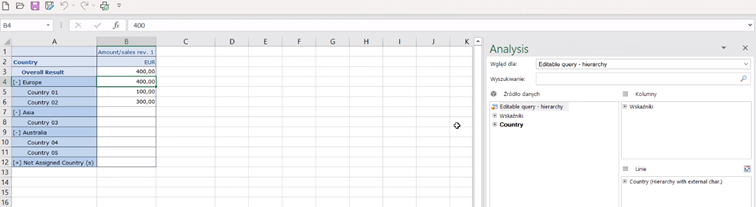
Fig.13 Analysis for Office screen – 1st step
Second step: change Europe to 20.000 and select Planning and recalculate

Fig.14 Analysis for Office screen – 2nd step
Result:

Fig.15 Analysis for Office screen – Results after recalculation
Why result 20.000 (red rectangle on Fig. 14) was distributed in that way? Let me remind you what we select in query definition for distribution of Key figure – it stated: “Same as in reference object”. So if key figures have values 300 and 100 that means that value that will be disaggregated will have ratio 3:1 – this is why we have 15.000 and 5.000.
Ok, now let us do the same query and its roll-up functionality in SAP PaPM:

Fig.16 SAP PaPM query function – external query
And functionality is still working - 1st step: change value to 1.000.000:

Fig.17 Analyze of external query in SAP PaPM – changing values on ‘Europe’
2nd step: press ENTER to recalculate:

Fig.18 Analyze of external query in SAP PaPM – after recalculation
As you can see roll-up works alongside hierarchy underlying nodes.
You can clearly see that BW top-down planning functionality can be successfully used via SAP PaPM tool. I strongly encourage you to try out other available values of “Distribution” of key figure tab in planning features of query, because in that blog I only maintained one of them. Feel free to add more Key Figures and characteristics to experiment more with planning capabilities that SAP BW and SAP Profitability and Performance Management can provide.
