
- SAP Community
- Products and Technology
- Technology
- Technology Blogs by SAP
- Focus the predictive forecasts to your planning ne...
Technology Blogs by SAP
Learn how to extend and personalize SAP applications. Follow the SAP technology blog for insights into SAP BTP, ABAP, SAP Analytics Cloud, SAP HANA, and more.
Turn on suggestions
Auto-suggest helps you quickly narrow down your search results by suggesting possible matches as you type.
Showing results for
Advisor
Options
- Subscribe to RSS Feed
- Mark as New
- Mark as Read
- Bookmark
- Subscribe
- Printer Friendly Page
- Report Inappropriate Content
10-26-2021
6:49 AM

This blog post explains how you can filter dimensions (including hierarchies) and properties in Predictive Planning in SAP Analytics Cloud, to focus the predictive scope on your planning needs.
This feature has been made available in version 2021.17. It will be part of the November 2021 release of SAP Analytics Cloud (last quarterly release this year).
With Predictive Planning you can generate predictive forecasts across several entity values. The end-user selects in the field Entity, the dimensions (or dimension properties) the most relevant depending on the business indicator to forecast.

Figure 1 Select dimensions and properties in the Entity field
Predictive Planning creates a predictive model for each entity value.
Some of them may not be relevant for the planning process or they might not contain enough historical data to produce accurate predictive forecasts.
With the ability to filter, the user can now focus on the values needed and relevant for the planning process.
In case the dimension selected in the Entity field has hierarchies defined, the user can select the hierarchy members at the best level for planning.
Filter and adjust predictive forecasts to your exact needs
In the following example, I want to generate predictive forecasts to plan my future sales.
Assuming the last actual sales are in December 2021, I want to forecast the bike sales for the next 3 months (January to March 2022).
The table below displays the corresponding data.

Figure 2 Bike Sales
This planning model contains monthly sales data since January 2015. Leveraging this data, Predictive Planning can create a predictive model to generate predictive forecasts for the next 3 months. These predictive forecasts can then be saved in a private version to become part of a story.
Sales trends differ when comparing bike types. It is important to create a predictive model per bike type.
To generate the corresponding predictive forecasts, I create a Time Series Forecasting Predictive Scenario with the following settings:
- The planning data model as input data source,
- The Sales Revenue account member to be predicted as Target,
- The Time dimension as the Date,
- And the Product dimension property Bike Type selected as Entity.
Predictive Planning generates a predictive forecast for each bike type.
From the Entity Filters section, I limit it to the bike types I need, by clicking on Add Filters.

Figure 3 Predictive Model Settings
I select the values for Bike Type from the list of available members on the left side.

Figure 4 Select dimension members
The resulting filter is visible in the section Entity Filters.

Figure 5 Filter summary
I click on Train & Forecast. It creates a predictive model and generates a predictive forecast for each selected bike type.
The Overview tab presents one row for each entity with the Expected MAPE (Mean Absolute Percentage Error). The lower the Expected MAPE is, the more accurate the predictive forecast is. For more details on predictive forecast accuracy, you can refer to this blog post.
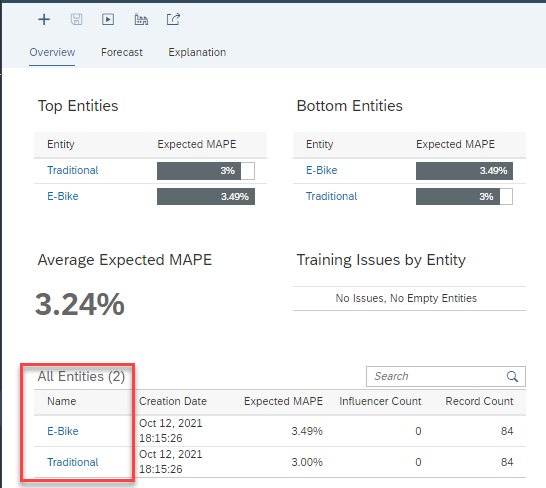
Figure 6 Predictive model training report
I save the generated predictive forecasts in a private version of the planning model.

Figure 7 Save predictive forecast
I refresh the story displaying this private version. I can see the generated predictive forecasts for January, February, and March 2022.

Figure 8 Predictive Forecasts in story
As we saw, we can generate predictive forecasts, after selecting some values to define our entities.
Predictive forecast at the good granularity
We now combine a selection of values at different levels of granularity.
I add the geography dimension and generate predictive forecasts only for the areas I’m looking at in Europe and in the United States.
As we can see in the following planning table, the Regions dimension is organized as a hierarchy.

Figure 9 Forecasting value in Planning
Italy in Europe is a new market for which there is not enough historical data to get an accurate predictive forecast. I will directly fill the value manually in the table.
United States is also a recent market with limited data history at the sub-region level but enough data history at the country level to get a good predictive forecast. I will forecast at the country level then distribute down the predicted numbers to the sub-regions.
I add the dimension Regions to the section Entity in the predictive model settings.
Without filters, Predictive Planning would generate a predictive forecast for each region (hierarchy leaves) and each bike type.
To filter on the dimension Regions, I first select the dimension Regions in the Entity Filters field.

Figure 10 Select dimension from Entity list
A window opens to select the value for Regions. As there is a hierarchy defined for Regions, it displays the members in the hierarchy.

Figure 11 Select members within a hierarchy
When saving predictive forecasts in a planning model, the saved forecasts are propagated across the hierarchy according to a planning logic.
The forecast for a node is aggregated with the forecast of the other sibling nodes to make the forecast for the parent node. And if there are child nodes, the forecast is disaggregated to make the forecast for these child nodes.
To avoid any data conflict during this data propagation, when you select a node to get a predictive forecast, you cannot select any child node. If you select a parent node, it will be automatically unselected.
If the dimension to filter has several hierarchies defined, the user can select the desired one.

Figure 12 - Select the hierarchy to display
The resulting filter is visible and editable in the section Entity Filters.

Figure 13 - Filter summary
I also filter on the property Bike Type.
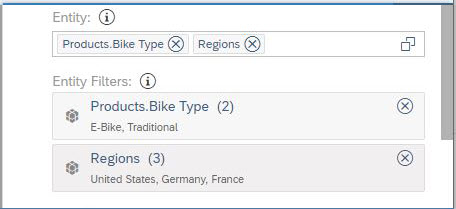
Figure 14 - Filters Combination
I click on Train & Forecast, and Predictive Planning trains a predictive entity for each combination of the selected values: 2 Bike Types values * 3 Regions members = 6 predictive entities.
I can see and check on the tab Overview of the training execution report, a row with a predictive quality indicator Expected MAPE for each of the 6 predictive entities.

Figure 15 Predictive model training report
I save the predictive forecasts back in a private version of the planning model.
When I refresh the Story, I can see that the table is now updated with the predictive forecasts.
I can see that the predictive forecasts for Germany and France have been aggregated into a forecasted value for region Europe.
The value for the United States is disaggregated to give the value for each sub-region. (The forecast aggregation and disaggregation are handled by the planning logic. You can read this blog post to learn more about this)
As expected, there is no value for the country Italy and no value for the region Asia.

Figure 16 Predictive forecast in Planning table
Conclusion
Predictive Planning goes one step further to integrate the predictive technology in planning processes to accelerate and ease planning.
I hope this reading has been helpful for you to better understand the potential of Predictive Planning to serve planning needs.
If you want to learn more about Predictive Planning in SAP Analytics Cloud:
- You can read our other blog posts.
- You can check our community page.
- You can also experience SAP Analytics Cloud.
If you want to learn more about SAP Analytics Cloud:
Labels:
You must be a registered user to add a comment. If you've already registered, sign in. Otherwise, register and sign in.
Labels in this area
-
ABAP CDS Views - CDC (Change Data Capture)
2 -
AI
1 -
Analyze Workload Data
1 -
BTP
1 -
Business and IT Integration
2 -
Business application stu
1 -
Business Technology Platform
1 -
Business Trends
1,658 -
Business Trends
91 -
CAP
1 -
cf
1 -
Cloud Foundry
1 -
Confluent
1 -
Customer COE Basics and Fundamentals
1 -
Customer COE Latest and Greatest
3 -
Customer Data Browser app
1 -
Data Analysis Tool
1 -
data migration
1 -
data transfer
1 -
Datasphere
2 -
Event Information
1,400 -
Event Information
66 -
Expert
1 -
Expert Insights
177 -
Expert Insights
293 -
General
1 -
Google cloud
1 -
Google Next'24
1 -
Kafka
1 -
Life at SAP
780 -
Life at SAP
13 -
Migrate your Data App
1 -
MTA
1 -
Network Performance Analysis
1 -
NodeJS
1 -
PDF
1 -
POC
1 -
Product Updates
4,577 -
Product Updates
340 -
Replication Flow
1 -
RisewithSAP
1 -
SAP BTP
1 -
SAP BTP Cloud Foundry
1 -
SAP Cloud ALM
1 -
SAP Cloud Application Programming Model
1 -
SAP Datasphere
2 -
SAP S4HANA Cloud
1 -
SAP S4HANA Migration Cockpit
1 -
Technology Updates
6,873 -
Technology Updates
419 -
Workload Fluctuations
1
Related Content
- Planning Professional vs Planning standard Capabilities in Technology Q&A
- Forecast Local Explanation with Automated Predictive (APL) in Technology Blogs by SAP
- What’s New in SAP Analytics Cloud Release 2024.07 in Technology Blogs by SAP
- Unleashing AI and Machine Learning in Sales: Advanced Price-Volume Forecasting with SAP Analytics Cl in Technology Blogs by SAP
- Predictive Forecast Disaggregation in Technology Blogs by SAP
Top kudoed authors
| User | Count |
|---|---|
| 35 | |
| 25 | |
| 13 | |
| 7 | |
| 7 | |
| 6 | |
| 6 | |
| 6 | |
| 5 | |
| 4 |