Dear SAP Analytics Cloud beginners,
This is a blog post for beginners in SAP Analytics Cloud. I also started learning SAP Analytics Cloud from August 2021. I'd like to share my trial and error from a beginner's point of view, and hope it helps you get started easily!
Day2: Datatype and data transform
I posted a blog "Day1:Time Series data" with how to set up a hierarchy when creating a chart. (Link to
Beginner's SAP Analytics Cloud Journey: Day1)
I was trying to create
monthly, quarterly and weekly trend chart, but I had a problem when setting up a hierarchy for time series data.
I can't find hierarchy. Where is hierarchy😨?

Dimensions without Setting Hierarchy
Dimensions with hierarchical settings are what I expected.

Dimensions with Setting Hierarchy
I found a solution that I need to
change the datatype and
transform the data.
Hierarchy setting for dimensions is unavailable when datatype is "Date and Time" format, thus you should change the datatype.
The conversion format for SAP Analytics Cloud is as follows:
- "Date and Time" Conversion Format: YYYY-MM-DD HH24:MM:SS
- "Date" Conversion Format: YYYY-MM-DD
You can easily change and transform your data by following these steps:
Step1: Go to dataset and check datatype
In this example dataset, datatype is "Date and Time" with Conversion Format, "YYYY-MM-DD HH24:MM:SS".
The next step converts the datatype from "Date and Time" to "Date".

Check datatype and Conversion Format
Step2: Duplicate column, "Date and Time"
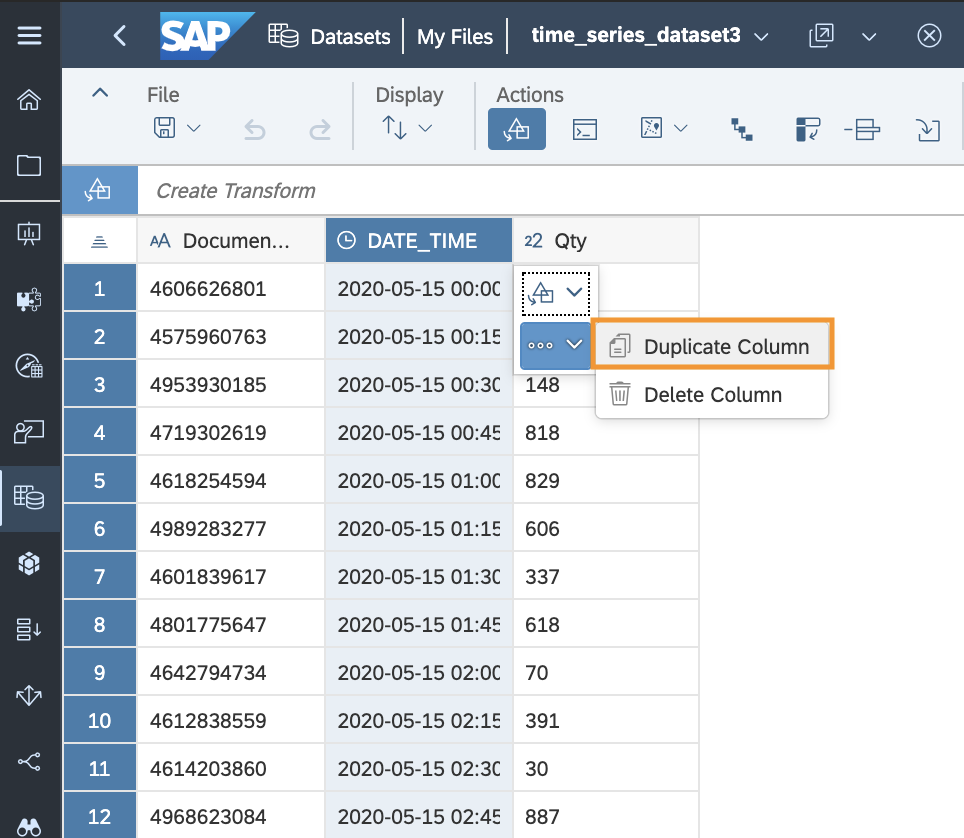
Duplicate column
Step3: Create a Transform
You can transform datatype with concatenate, split, extract, replace and change functions.

Create a Transform
But, "Split" function is unavailable when datatype is "Date and Time", thus before split the data, you should change datatype from "Date and Time" to "
String"
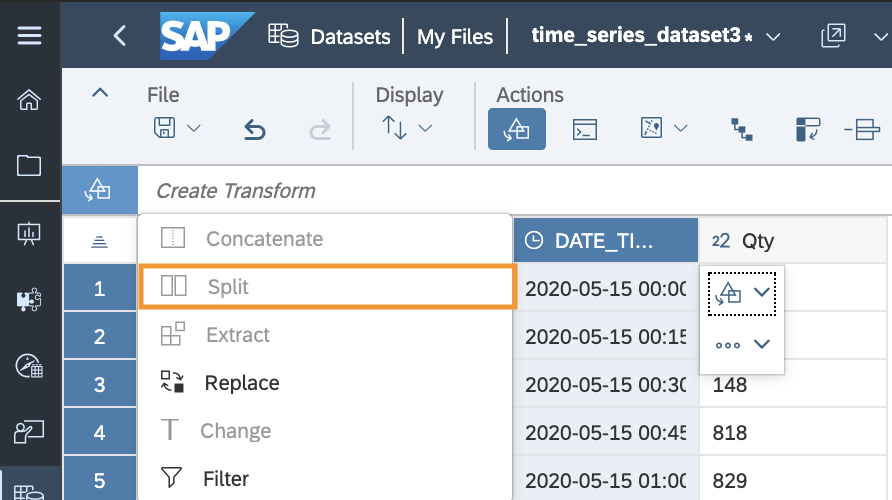
Split is unavailable with datatype, "Date and Time"
Step4: Change datatype from "Date and Time" to "String"
In the detail section, you can change the datatype from "Date and Time" to "String".

Change datatype to String
Step5: Split data on " "
After changing the data to "String", you can split the data in "blank".

Split data
Step6: change datatype from "String" to "Date"
After splitting the data, you can change the datatype from String to Date with "YYYY-MM-DD" format.

Change datatype to Date
Step7: change datatype from "String" to "Time"
After splitting the data, you can change the datatype from String to Time with "HH24:MM:SS" format.

Change datatype to Time
Step8: Change column name
You can change the column name in the "viewing details for" in the detail section.
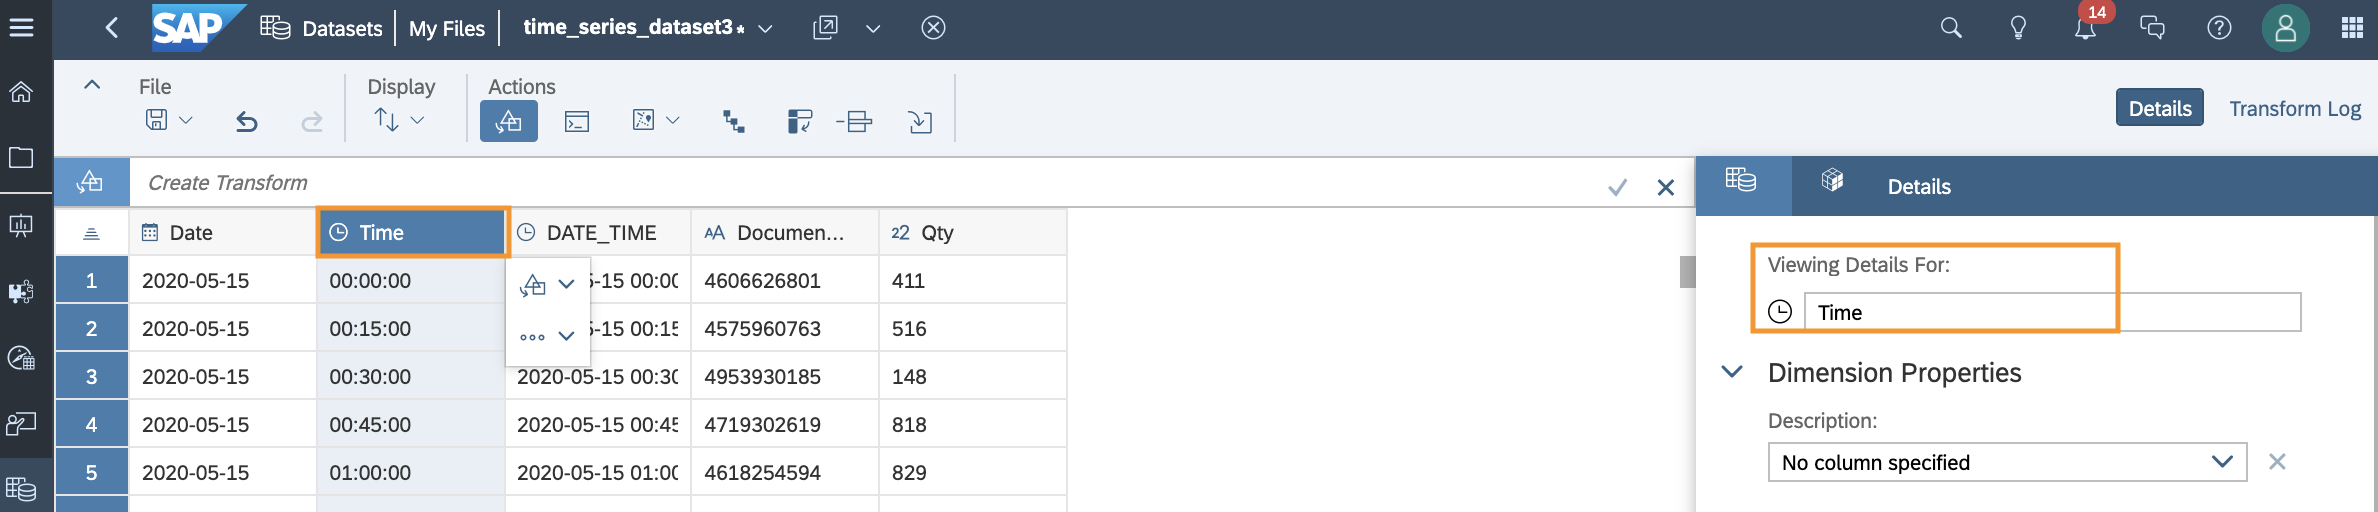
change viewing details for
Step9: Delete column
Please delete unnecessary columns using "Delete Column".

Delete column
Step10: Save the dataset
Please save the transformed dataset.

Save the transformed dataset
Step11: Go to the stories and Set Hierarchy
Please go to the stories and you can find the "Set Hierarchy".

Dimension with Set hierarchy
Step12: Select Hierarchy
You can select different types of hierarchies such as, "Year, Half-Year, Month, Day", "Year, Quarter, Month, Day", and others as follows.

Hierarchy options
Step13: Choose Level in the Hierarchy
You can set the date hierarchy by year, quarter, or month, depending on the hierarchy you choose.

Set Hierarchy: Level 2- Yearly

Set Hierarchy: Level 3- Quarterly

Set Hierarchy: Level 3- Monthly
Now you can now change datatype and transform data
👏👏👏!
In my opinion, this is pre-required steps before creating charts and analyze data in SAP Analytics Cloud. If you'd like to learn more about charting and analyzing time series data?
Please refer to my blog posting: Beginner's SAP Analytics Cloud Journey: Day1
Following on Beginner's SAP Analytics Cloud Journey: Day3 - How to create Geo Map.
Learn more about SAP Analytics Cloud
