
- SAP Community
- Products and Technology
- Enterprise Resource Planning
- ERP Blogs by Members
- List with 9 SAP S/4 HANA Fiori Apps for Analysis a...
Enterprise Resource Planning Blogs by Members
Gain new perspectives and knowledge about enterprise resource planning in blog posts from community members. Share your own comments and ERP insights today!
Turn on suggestions
Auto-suggest helps you quickly narrow down your search results by suggesting possible matches as you type.
Showing results for
former_member69
Participant
Options
- Subscribe to RSS Feed
- Mark as New
- Mark as Read
- Bookmark
- Subscribe
- Printer Friendly Page
- Report Inappropriate Content
07-12-2021
11:48 PM
Hi,
In this blog post I am going to talk about SAP Fiori Apps for Reporting/Analysis in the area of Sales.
Previously I talked about the SAP Fiori Apps for Reporting/Analysis for Sourcing and Procurement and Inventory Management, if you are interested to find more about this topic you can check the blog posts below:
Introduction
SAP Fiori Apps is a group of accumulated cards of Apps, which represents the new user experience that assures that employees’ and managers have consistent, coherent, simple, and intuitive user experience.
The SAP Fiori Library is constantly expanding for both SAP S/4HANA on-premises and SAP S/4HANA cloud. The apps run on browser and work seamlessly on smart phone, tablet, and desktop. As a business process owner is requested to permanently improve the user experience. SAP S/4 Projects will use SAP Fiori and it is so different from the SAP ECC.
Objectives
Main Part
I will bring to light the most important SAP Fiori Apps that can be used for Analysis / Reports for Sales and Distribution, I will explain in detail about their uses and scope. Let’s see below more details.
________________________________________________________________________________
The first app mentioned in this list is My Sales Overview, which provides information such as sales order data, performance figures, and quick actions using actionable cards in a dashboard format. An internal sales representative can use the app to search for, create, modify, or view sales information to improve reaction time and allows the user to act on the most important issues first.g

My Sales Overview Cards
________________________________________________________________________________
The second app that I will mention in this list is Sales Management Overview, as a sales manager role you can get a graphical overview of various sales data on analytical cards. Using this app, you can gain comprehensive insights into your current sales situation and respond quickly.
Key Features
The app provides the following cards:
The next Fiori App I will talk about is Sales Performance - Plan/Actual. With this app, you can compare planned and actual sales on different dimensions, such as sales organization, customer, and material. By doing so, you can analyze to what extent your sales targets are being achieved and thus gain insights into your current sales performance.
________________________________________________________________________________
You can select value plans to compare the planned and actual sales values, for more information about sharing sales plans with team, see Manage Sales Plans.
After a value plan is selected, the plan and actual data are compared as follows:
You can display a hybrid view that visualizes the differences on a chart while displaying the details in a table. In addition, you can compare the planned sales volume to the actual net sales volume (sales volume minus credit memos).
You can drill down to further compare the plan and actual data. The drill-downs available to you are the dimensions that you have defined for the sales plan version.
You can select relevant data (for example, specific customers) from the chart and then navigate to related apps to show quotation conversion rates, contract fulfillment rates, and check open sales.
You can select quantity plans to compare the planned and actual quantities (Sales Performance – Plan/Actual - Quantity-Based). Planned and actual quantities represent either incoming sales orders quantity or sales volume quantity, depending on what you have planned in the selected quantity plan
________________________________________________________________________________
The next Fiori App is Customers Overview. With this app, you can get an overview of the sales data of one or more customers.
You can use this app to:
The app displays the following cards:
________________________________________________________________________________
The next Fiori App is Customer Returns - Flexible Analysis. With this app, you can analyze the monthly rolling trend of your customer returns based on flexible combinations of dimensions.
Provide the following KPIs for analyzing customer returns:
________________________________________________________________________________
The app Order-to-Cash Performance - Overview enables process managers and process owners to get a quick overview of issues and the current and past performance of the order-to-cash process without having to open many different reports and transactions. All relevant information is shown on a single page in an attractive and efficient way.
Activities you can perform with the help of the app:
The overview page enables process managers and process owners to get a quick overview of issues, and the current and past performance of the order-to-cash process without having to open many different reports and transactions. All relevant information is shown on a single page, which is visualized using cards for multiple types of content. On clicking a card all relevant data is displayed. You can use the interval drop-down to view data for a different time range.
________________________________________________________________________________
Further, the app that I am going to talk about is Sales Volume - Check Open Sales, with which you can check sales volume in comparison with previous months, with the additional insight of open orders and open deliveries for the current month, in comparison with previous months. The app enables you to see briefly how the current month’s sales volume relates to the previous month and helps you to identify where you can take action in order to increase your sales volume.
You can use the app to do the following:
The app uses the following key figures:
________________________________________________________________________________
The app Sales Volume - Flexible Analysis can be used to gain an understanding of the monthly sales volume.
Key Features
The app provides the following key figures:
________________________________________________________________________________
The next Fiori App is Incoming Sales Orders - Flexible Analysis. With this app, you can use this app to gain an understanding of the monthly rolling trend of incoming sales orders.
Key Features
Example: You can select the sales document type for a drilldown so that you can compare the incoming sales orders in the available scenarios.
________________________________________________________________________________
Conclusion
In this blog post we have seen the most important SAP Fiori Apps for Reporting/Analysis that can be applied in business processes in the area of Sales.
I hope you really enjoyed this reading, and you will find this blog post helpful in your projects.
Sources
https://sap.com/fiori-apps-library
E-Book: Mobilizing SAP Fiori Standard Apps
SAP PRESS Book: Materials Management with SAP S/4HANA
https://help.sap.com/
Images: All images in this list are my own captures
You can find out more about SAP Fiori Apps (technical information, configuration, installation) at https://sap.com/fiori-apps-library , the information is public.
Thank you,
Elena Puica
SAP Consultant
In this blog post I am going to talk about SAP Fiori Apps for Reporting/Analysis in the area of Sales.
Previously I talked about the SAP Fiori Apps for Reporting/Analysis for Sourcing and Procurement and Inventory Management, if you are interested to find more about this topic you can check the blog posts below:
- List with 16 SAP S/4 HANA Fiori Apps for Analysis and Reports | Sourcing and Procurement (MM)
- List with 9 SAP S/4 HANA Fiori Apps for Analysis and Reports | INVENTORY (MM)
Introduction
SAP Fiori Apps is a group of accumulated cards of Apps, which represents the new user experience that assures that employees’ and managers have consistent, coherent, simple, and intuitive user experience.
The SAP Fiori Library is constantly expanding for both SAP S/4HANA on-premises and SAP S/4HANA cloud. The apps run on browser and work seamlessly on smart phone, tablet, and desktop. As a business process owner is requested to permanently improve the user experience. SAP S/4 Projects will use SAP Fiori and it is so different from the SAP ECC.
Objectives
- Gain an overview of SAP Reporting/Analytics Apps for Sales
- Explaining and presenting the basics of the most important SAP Reporting/Analytics Apps for Sales
- Make you familiar with the most important Apps that will help you to complete the business processes.
Main Part
I will bring to light the most important SAP Fiori Apps that can be used for Analysis / Reports for Sales and Distribution, I will explain in detail about their uses and scope. Let’s see below more details.
________________________________________________________________________________
The first app mentioned in this list is My Sales Overview, which provides information such as sales order data, performance figures, and quick actions using actionable cards in a dashboard format. An internal sales representative can use the app to search for, create, modify, or view sales information to improve reaction time and allows the user to act on the most important issues first.g
- My Sales Overview, App ID F2200
| Application Type | Analytical (SAP Fiori elements: Overview Page) |
| Form Factor | Desktop, Tablet |
- Cards included in this app provide information on sales data, including open sales quotations and sales orders, blocked credit memo requests, customer returns, and customer information.
- Cards are displayed based on the roles assigned to your user and you can select which cards to display under Manage Cards in your user settings.
- You can filter the data displayed in the cards in one of the following ways:
- Specify default sales area filters (Sales Org., Distr. Channel, and Division) under Default Values in your user settings.
- Specify filter values in the filter bar of the My Sales Overview app.
My Sales Overview Cards
| Card | Description |
| Customer Contacts |
|
| Open Sales Orders |
|
| Customer Returns |
|
| Blocked Credit Memo Requests |
|
| Open Sales Quotations |
|
| Quick Actions |
|
| Incoming Sales Orders |
|
| Sales Quotation Pipeline |
|
| Sales Order Fulfilment - Monitor Issues |
|

My Sales Overview App
________________________________________________________________________________
The second app that I will mention in this list is Sales Management Overview, as a sales manager role you can get a graphical overview of various sales data on analytical cards. Using this app, you can gain comprehensive insights into your current sales situation and respond quickly.
- Sales Management Overview, App ID F2601
| Application Type | Analytical (SAP Fiori elements: Overview Page) |
| Form Factor | Desktop, Tablet |

Key Features
- Each sales topic is represented by a card. On the cards, you can view relevant sales KPIs
- Sales data is visualized in charts and lists
- You can filter results by various criteria, such as sold-to party and sales organization
- You can specify a preferred currency for displaying the results
- You can navigate to related apps to drill down into the data
The app provides the following cards:
| Card | Description |
| Incoming Sales Orders |
|
| Customer Returns |
|
| Incomplete Sales Documents |
|
| Backorder Items |
|
| Profit Margin |
|
| Blocked Sales Orders |
|
| Overdue Sales Orders |
|

Sales Management Overview app
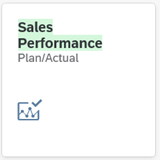
The next Fiori App I will talk about is Sales Performance - Plan/Actual. With this app, you can compare planned and actual sales on different dimensions, such as sales organization, customer, and material. By doing so, you can analyze to what extent your sales targets are being achieved and thus gain insights into your current sales performance.
________________________________________________________________________________
- Sales Performance - Plan/Actual, App ID F2941
| Application Type | Analytical (SAP Fiori elements) |
| Form Factor | Desktop, Tablet |
You can select value plans to compare the planned and actual sales values, for more information about sharing sales plans with team, see Manage Sales Plans.
After a value plan is selected, the plan and actual data are compared as follows:
- Planned and actual values represent either incoming sales orders or sales volume, depending on what you have planned in the selected sales plan version
- Planned and actual values are compared by month, quarter, or year within the planned period, depending on how you have defined this in the selected sales plan version
You can display a hybrid view that visualizes the differences on a chart while displaying the details in a table. In addition, you can compare the planned sales volume to the actual net sales volume (sales volume minus credit memos).
You can drill down to further compare the plan and actual data. The drill-downs available to you are the dimensions that you have defined for the sales plan version.
You can select relevant data (for example, specific customers) from the chart and then navigate to related apps to show quotation conversion rates, contract fulfillment rates, and check open sales.
You can select quantity plans to compare the planned and actual quantities (Sales Performance – Plan/Actual - Quantity-Based). Planned and actual quantities represent either incoming sales orders quantity or sales volume quantity, depending on what you have planned in the selected quantity plan

Sales Performance - Plan/Actual app
________________________________________________________________________________
The next Fiori App is Customers Overview. With this app, you can get an overview of the sales data of one or more customers.
- Customers Overview, App ID F4645
| Application Type | Analytical (SAP Fiori elements) |
| Form Factor | Desktop, Smartphone, Tablet |

You can use this app to:
- View various sales measures of customers represented by cards. The data is displayed in an easy-to-consume manner using charts and lists.
- Filter results by various criteria, such as sold-to party, sales organization, sales group, and so on.
- Specify a preferred currency for displaying the results. You must select the display currency and at least one sold-to party (customer) in order to see the corresponding sales data.
- Navigate to the related apps to drill down into the data.
The app displays the following cards:
| Card | Description |
| Frequency of Sales Orders |
|
| Incoming Sales Orders |
|
| Open Sales Orders |
|
| Rejected Sales Orders |
|
| Customer Returns |
|
| Delivery Performance |
|
| Sales Volume / Profit Margin |
|
| Sales Volume by Sales Area |
|
| Open Quotations |
|

Customers Overview app
________________________________________________________________________________
The next Fiori App is Customer Returns - Flexible Analysis. With this app, you can analyze the monthly rolling trend of your customer returns based on flexible combinations of dimensions.
- Customer Returns - Flexible Analysis, App ID F3889
| Application Type | Analytical, BW Query used (SAP Fiori: Design Studio) |
| Form Factor | Desktop |

Provide the following KPIs for analyzing customer returns:
- Customer Returns: Net amount of customer return items that are relevant for delivery or billing
- Return Item Quantity: Quantity of customer return items that are relevant for delivery or billing
- No. of Return Items: Number of customer return items that are relevant for delivery or billing
- Analyze the return rate of incoming sales orders
- Analyze customer returns by return reason
- Drill down further into a list of customer return items

Customer Returns - Flexible Analysis app
________________________________________________________________________________
The app Order-to-Cash Performance - Overview enables process managers and process owners to get a quick overview of issues and the current and past performance of the order-to-cash process without having to open many different reports and transactions. All relevant information is shown on a single page in an attractive and efficient way.
- Order-to-Cash Performance - Overview, App ID F2242
| Application Type | Analytical Analytical (SAP Fiori elements: Overview Page) |
| Form Factor | Desktop, Tablet |

Activities you can perform with the help of the app:
- Track delivery blocks or billing blocks
- Detect changes made to critical fields of a sales order
- Monitor lead times (for example, order to delivery or goods issue to billing)
The overview page enables process managers and process owners to get a quick overview of issues, and the current and past performance of the order-to-cash process without having to open many different reports and transactions. All relevant information is shown on a single page, which is visualized using cards for multiple types of content. On clicking a card all relevant data is displayed. You can use the interval drop-down to view data for a different time range.

Order-to-Cash Performance - Overview app
________________________________________________________________________________
Further, the app that I am going to talk about is Sales Volume - Check Open Sales, with which you can check sales volume in comparison with previous months, with the additional insight of open orders and open deliveries for the current month, in comparison with previous months. The app enables you to see briefly how the current month’s sales volume relates to the previous month and helps you to identify where you can take action in order to increase your sales volume.
- Sales Volume - Check Open Sales, App ID F2270
| Application Type | Analytical (SAP Fiori: SAP Smart Business generic drill down app) |
| Form Factor | Desktop, Tablet |

You can use the app to do the following:
- Filter according to various criteria, such as sales organization, month of billing or year of billing, sold-to party, product, sales document, and so on
- Display and analyze the key figures as a chart or a table
- Drill down to view detailed information for selected sales organizations, products, sales documents, customer group, sold-to parties, and so on.
- Navigate to the object pages (for example, for customer, various sales documents, and product) for further information
- Navigate to related apps via the mini tiles at the top of the screen
- Navigate to the Sales Order Fulfillment - Analyze and Resolve Issues app
The app uses the following key figures:
| Key Figure | Description |
| Sales Volume | The total invoiced sales achieved during a specified period. This is based on invoice items or debit memo items (debits) that have not been canceled. |
| Credit Memos | The total amount of credit memos during a specified period. This is based on credit memo items (credits) that have not been canceled. |
| Profit Margin | The difference between sales volume and costs |
| Credit Memo Profit Margin | The difference between credit memos and costs |
| Net Sales Volume | Sales volume minus credit memos |
| Net Profit Margin | Profit margin minus credit memo profit margin |
| Net Sales Cost | Costs of sales volume minus costs of credit memos The following are some examples of possible sales processes: 1. Sell-from-Stock: In this case, the cost is usually taken from a condition, which is filled from the material valuation in the product master or, in the case of billing, the goods issue. 2. Third-Party: In this case, the cost is usually taken from a condition, which is filled from the material valuation in the product master or, in the case of billing, the invoice receipt. 3. Intercompany: In this case, the cost is usually taken from a condition record of an intercompany price. |
| Open Orders | Confirmed sales orders for which a delivery document has not yet been created in the period of the planned billing date (goods issue date). In this case, the net amount of the confirmed schedule lines is shown. In the case of unconfirmed or partially unconfirmed sales orders, the net amount of the not yet confirmed requested schedule line is shown, and the billing date defines the analysis period, for example, month, in which the schedule line is displayed. Scheduling agreements with release are not considered in the calculation of open orders. |
| Open Billing Requests | Sales documents which are relevant for invoicing, but which have not yet been invoiced in the context of debit memos, for example, debit memo requests or sales orders with billing plans |
| Open Credit Memo Requests | Returns or credit memo requests for order-related invoicing which have not yet been invoiced |
| Overall Open Orders | Orders that have been confirmed for delivery, but for which a delivery document has not yet been created (Open Orders), orders which are relevant for invoicing but have not been fully invoiced (Open Billing Requests), or orders which include a billing plan, but in which a customer invoice has not yet been created in the period of the planned billing dates (Open Orders for Billing Plans) |
| Open Deliveries | Deliveries in which a delivery quantity is not fully invoiced |
| Deliveries Shipped But Not Invoiced | Deliveries in which a goods issue is posted, but not fully invoiced |

Sales Volume - Check Open Sales app
________________________________________________________________________________
The app Sales Volume - Flexible Analysis can be used to gain an understanding of the monthly sales volume.
- Sales Volume - Flexible Analysis, App ID F1250
| Application Type | Web Dynpro |
| Form Factor | Desktop |

Key Features
- You can view the key figures as a graphic or a table on a monthly basis.
- You can drill down to view detailed information for selected sales organizations, sold-to parties, bill-to parties, and so on.
- You can filter the items according to various criteria, such as year/month, sales organization, sold-to party, and bill-to party.
- You can change the displayed ID or description.
- You can save your selection as a variant.
The app provides the following key figures:
| Key Figures | Description |
| Net Value | The total net value of items in billing documents |
| Sales Volume | The total invoiced sales achieved during a specified period. This is based on invoice items or debit memo items (debits) that have not been canceled. |
| Sales Volume Qty | The total quantity of invoice items or debit memo items (debits) that have not been canceled |
| Cancellations | Canceled sales volume. Cancellation documents are not considered at all. |
| Profit Margin | The difference between sales volume and costs |
| Credit Memos | Net value of items in credit memos. This is based on credit memos that have not been canceled. |
| Credit Memo Profit Margin | The difference between credit memos and costs |
| Net Sales Volume | Sales volume minus credit memos |
| Net Profit Margin | Profit margin minus credit memo profit margin |
| Net Sales Cost | Costs of sales volume minus costs of credit memos |

Sales Volume - Flexible Analysis app
________________________________________________________________________________
The next Fiori App is Incoming Sales Orders - Flexible Analysis. With this app, you can use this app to gain an understanding of the monthly rolling trend of incoming sales orders.
- Incoming Sales Orders - Flexible Analysis, App ID F1249
| Application Type | Analytical (SAP Fiori elements) |
| Form Factor | Desktop, Phone, Tablet |

Key Features
- You can view the monthly rolling trend for sales as a graphic or a table.
- You can analyze the net values of aggregated sales order items with the display currency.
- You can drill down to view detailed information for selected sales organizations, products, product groups, sold-to parties, sales document types, and so on.
Example: You can select the sales document type for a drilldown so that you can compare the incoming sales orders in the available scenarios.
- You can filter the items according to various criteria, such as year, month, sales organization, product group, and sold-to party.
- You can change the displayed ID or description.
- You can save your selection as a variant.

Incoming Sales Orders - Flexible Analysis app
________________________________________________________________________________
Conclusion
In this blog post we have seen the most important SAP Fiori Apps for Reporting/Analysis that can be applied in business processes in the area of Sales.
I hope you really enjoyed this reading, and you will find this blog post helpful in your projects.
Sources
https://sap.com/fiori-apps-library
E-Book: Mobilizing SAP Fiori Standard Apps
SAP PRESS Book: Materials Management with SAP S/4HANA
https://help.sap.com/
Images: All images in this list are my own captures
You can find out more about SAP Fiori Apps (technical information, configuration, installation) at https://sap.com/fiori-apps-library , the information is public.
Thank you,
Elena Puica
SAP Consultant
- SAP Managed Tags:
- SAP Fiori,
- SAP Fiori for SAP S/4HANA,
- SAP S/4HANA,
- SAP Fiori Launchpad,
- SD (Sales and Distribution),
- SD Sales
4 Comments
You must be a registered user to add a comment. If you've already registered, sign in. Otherwise, register and sign in.
Labels in this area
-
"mm02"
1 -
A_PurchaseOrderItem additional fields
1 -
ABAP
1 -
ABAP Extensibility
1 -
ACCOSTRATE
1 -
ACDOCP
1 -
Adding your country in SPRO - Project Administration
1 -
Advance Return Management
1 -
AI and RPA in SAP Upgrades
1 -
Approval Workflows
1 -
Ariba
1 -
ARM
1 -
ASN
1 -
Asset Management
1 -
Associations in CDS Views
1 -
auditlog
1 -
Authorization
1 -
Availability date
1 -
Azure Center for SAP Solutions
1 -
AzureSentinel
2 -
Bank
1 -
BAPI_SALESORDER_CREATEFROMDAT2
1 -
BRF+
1 -
BRFPLUS
1 -
Bundled Cloud Services
1 -
business participation
1 -
Business Processes
1 -
CAPM
1 -
Carbon
1 -
Cental Finance
1 -
CFIN
1 -
CFIN Document Splitting
1 -
Cloud ALM
1 -
Cloud Integration
1 -
condition contract management
1 -
Connection - The default connection string cannot be used.
1 -
Custom Table Creation
1 -
Customer Screen in Production Order
1 -
Data Quality Management
1 -
Date required
1 -
Decisions
1 -
desafios4hana
1 -
Developing with SAP Integration Suite
1 -
Direct Outbound Delivery
1 -
DMOVE2S4
1 -
EAM
1 -
EDI
3 -
EDI 850
1 -
EDI 856
1 -
edocument
1 -
EHS Product Structure
1 -
Emergency Access Management
1 -
Energy
1 -
EPC
1 -
Financial Operations
1 -
Find
1 -
FINSSKF
1 -
Fiori
1 -
Flexible Workflow
1 -
Gas
1 -
Gen AI enabled SAP Upgrades
1 -
General
1 -
generate_xlsx_file
1 -
Getting Started
1 -
HomogeneousDMO
1 -
IDOC
2 -
Integration
1 -
Learning Content
2 -
LogicApps
2 -
low touchproject
1 -
Maintenance
1 -
management
1 -
Material creation
1 -
Material Management
1 -
MD04
1 -
MD61
1 -
methodology
1 -
Microsoft
2 -
MicrosoftSentinel
2 -
Migration
1 -
mm purchasing
1 -
MRP
1 -
MS Teams
2 -
MT940
1 -
Newcomer
1 -
Notifications
1 -
Oil
1 -
open connectors
1 -
Order Change Log
1 -
ORDERS
2 -
OSS Note 390635
1 -
outbound delivery
1 -
outsourcing
1 -
PCE
1 -
Permit to Work
1 -
PIR Consumption Mode
1 -
PIR's
1 -
PIRs
1 -
PIRs Consumption
1 -
PIRs Reduction
1 -
Plan Independent Requirement
1 -
Premium Plus
1 -
pricing
1 -
Primavera P6
1 -
Process Excellence
1 -
Process Management
1 -
Process Order Change Log
1 -
Process purchase requisitions
1 -
Product Information
1 -
Production Order Change Log
1 -
purchase order
1 -
Purchase requisition
1 -
Purchasing Lead Time
1 -
Redwood for SAP Job execution Setup
1 -
RISE with SAP
1 -
RisewithSAP
1 -
Rizing
1 -
S4 Cost Center Planning
1 -
S4 HANA
1 -
S4HANA
3 -
Sales and Distribution
1 -
Sales Commission
1 -
sales order
1 -
SAP
2 -
SAP Best Practices
1 -
SAP Build
1 -
SAP Build apps
1 -
SAP Cloud ALM
1 -
SAP Data Quality Management
1 -
SAP Maintenance resource scheduling
2 -
SAP Note 390635
1 -
SAP S4HANA
2 -
SAP S4HANA Cloud private edition
1 -
SAP Upgrade Automation
1 -
SAP WCM
1 -
SAP Work Clearance Management
1 -
Schedule Agreement
1 -
SDM
1 -
security
2 -
Settlement Management
1 -
soar
2 -
Sourcing and Procurement
1 -
SSIS
1 -
SU01
1 -
SUM2.0SP17
1 -
SUMDMO
1 -
Teams
2 -
User Administration
1 -
User Participation
1 -
Utilities
1 -
va01
1 -
vendor
1 -
vl01n
1 -
vl02n
1 -
WCM
1 -
X12 850
1 -
xlsx_file_abap
1 -
YTD|MTD|QTD in CDs views using Date Function
1
- « Previous
- Next »
Related Content
- SAP S4HANA Cloud Public Edition Logistics FAQ in Enterprise Resource Planning Blogs by SAP
- SAP Fiori for SAP S/4HANA - Composite Roles in launchpad content and layout tools in Enterprise Resource Planning Blogs by SAP
- The Role of SAP Business AI in the Chemical Industry. Overview in Enterprise Resource Planning Blogs by SAP
- Question about report for Sales in SAP S/4HANA Public Cloud Edition - Out of the box reports or CDS in Enterprise Resource Planning Q&A
- Futuristic Aerospace or Defense BTP Data Mesh Layer using Collibra, Next Labs ABAC/DAM, IAG and GRC in Enterprise Resource Planning Blogs by Members
Top kudoed authors
| User | Count |
|---|---|
| 5 | |
| 2 | |
| 2 | |
| 2 | |
| 2 | |
| 2 | |
| 2 | |
| 1 | |
| 1 | |
| 1 |