
- SAP Community
- Groups
- Interest Groups
- Application Development
- Blog Posts
- Code Cities: Visualizing ABAP code metrics with AB...
Application Development Blog Posts
Learn and share on deeper, cross technology development topics such as integration and connectivity, automation, cloud extensibility, developing at scale, and security.
Turn on suggestions
Auto-suggest helps you quickly narrow down your search results by suggesting possible matches as you type.
Showing results for
BenjaminWeishei
Participant
Options
- Subscribe to RSS Feed
- Mark as New
- Mark as Read
- Bookmark
- Subscribe
- Printer Friendly Page
- Report Inappropriate Content
06-25-2021
9:04 AM
This article describes how code visualization with code cities can help to identfiy maintainance hotspots in custom ABAP codebases
We all know that ABAP has undergone rapid development since its early days. Coming from a COBOL influenced, procedural approach, which allowed business people with few technical experience to enhance SAP standard coding, it has evolved to a fully grown object oriented language used by professional developer teams to build custom software products with tens or hundreds of thousands or even more LOC (Lines of Code).
Working with large codebases confronts us as developers or software architects with major challenges, especially when we’re dealing with “legacy” solutions that have grown for years or even decades and incorporate multiple development paradigms and architectural styles.
When you navigate through the code of such projects, sooner or later you come across one of those huge classes or function groups that consists of thousands of LOC and is overwhelmingly complex. Objects like this tend to be a source of bugs and cause high maintenance and testing efforts, which makes further development cumbersome and slow (and who want's that?).
When we find objects like this, we know that a refactoring them would pay off in the long term. But as time is always limited, we need a way to identify the hotspots where an invest in software quality promises the greatest value. Typically, our hotspot candidates would be very large and complex modules that are changed frequently.
Most of the information required for such a hotspot analysis can be obtained with SAP standard transaction /SDF/CD_CCA. It allows to measure different aspects of custom code like size, complexity, number of changes, SQL statements, and other parameters for methods, function modules or includes.
But working with large, detailed and unaggregated lists is cumbersome and the presentation of pure numbers to management an colleagues was not very effective. So, how about enriching the information from /SDF/CD_CCA a little and visualize it in a way that speaks for itself?
In January, I found enno.wulffs blog post on code visualization (I Have A Dream: Code Visualization | SAP Blogs) and was fascinated by the idea of code cities. There were several tools with extractors for languages like Java or C#, but I couldn’t find any for ABAP. After a while I found Code Charta by MaibornWolff, which supports an open json format for custom extractors.
I wrote an ABAP extractor that can convert data from /SDF/CD_CCA in such a way that it can be loaded into Code Charta. It’s named ABAP2CodeCharta.
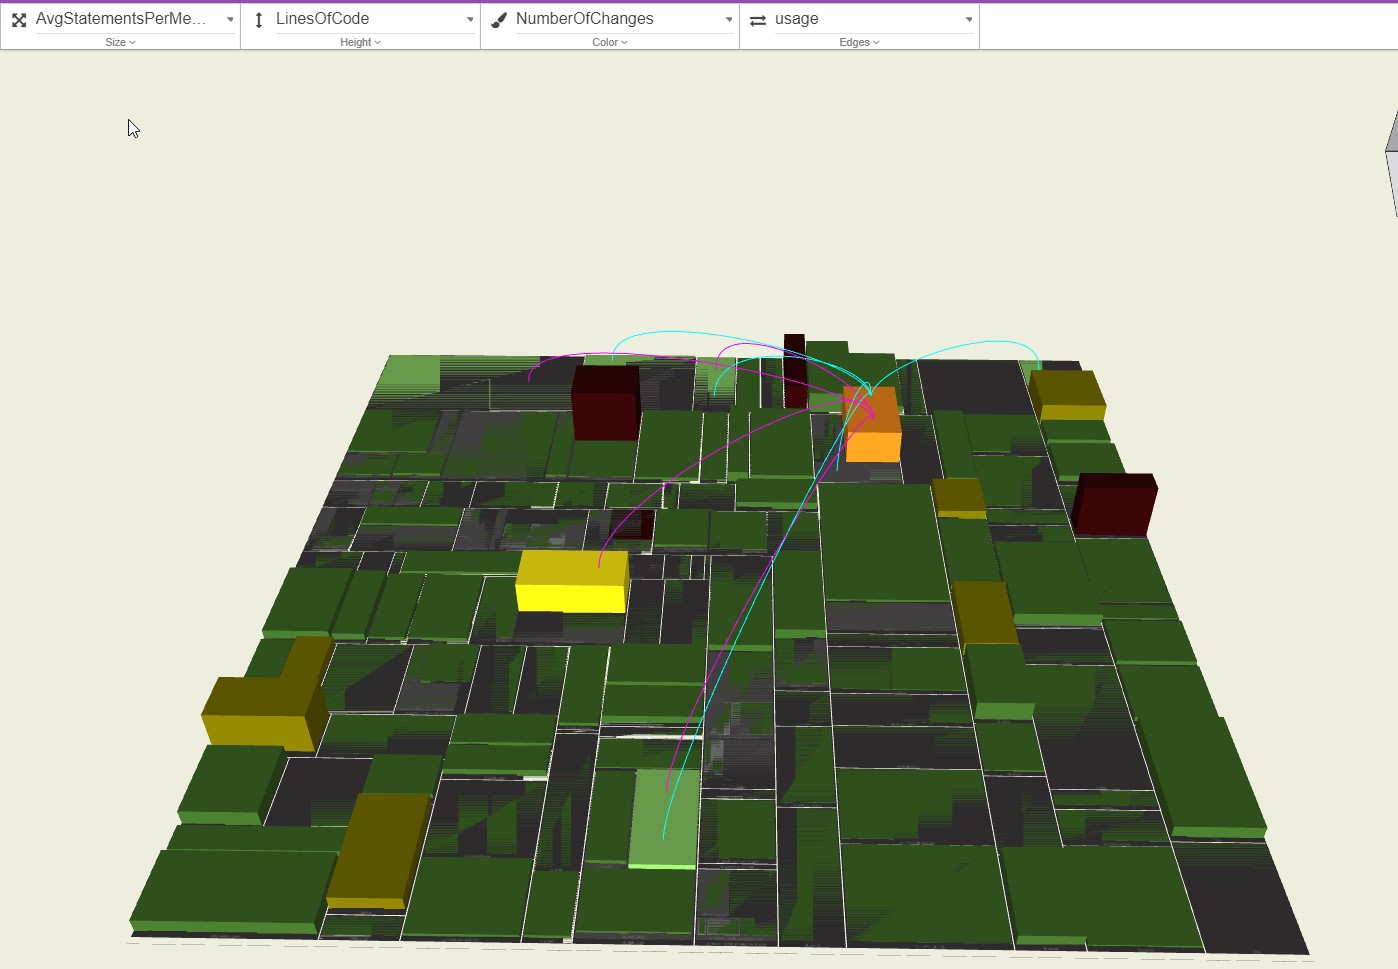
This is an ABAP Code City:
A code city from one of our ABAP projects, before we started to refactor the code. Each building stands for a class, function group or program. The height of the building stands for the size of the module and the ground areas represents the average size of its submodules (methods, function modules, includes). Yellow and red coloured buildings indicate that a module was changed many times. The largest, red building (marked in orange in the picture above) in this project is a class with nearly 4000 LOC that had been changed 193 times. Doesn’t this smell like high maintenance cost?
This is the same project after a few months:
Some of the skyscrapers, which mixed up many business and technical functionalities, have given way to nice suburbs made of tiny classes that respect the clean code principles and are designed for automated testing. These suburbs are a lot more robust and follow a standardized structure so they can easily be maintained by everyone in the team.
Focusing only on module size may seem an oversimplification but combined with the change frequency it’s a surprisingly good indicator for possible maintenance issues. Nevertheless, there are also other interesting metrics we can use to identify problematic areas. Currently the following metrics are available:
ABAP2CodeCharta uses ABAP where-used analysis, to find dependencies between modules. The results are visualized as lines between the buildings
Incoming and outgoing dependecies are displayed in different colours. Modules with many dependencies or connections between large modules are indications of tight coupling, which increases the risk for side effects when code is changed. Splitting these modules into small classes and representing dependencies through interfaces instead of referring classes directly might help to evolve towards to a more loosely coupled system that is easier to maintain and to test.
CodeCharta is open source and available on Github (MaibornWolff/codecharta: CodeCharta visualizes multiple code metrics using 3D tree maps. (github.com...) or as online demo (CodeCharta (maibornwolff.github.io)).
You can also run it in a docker container (codecharta/codecharta-visualization (docker.com)).
The ABAP extractor is available on Github (ABAP-2-CODE-CHARTA/src at main · BenjaminWeisheit/ABAP-2-CODE-CHARTA (github.com)) and can be installed via ABAPGit.
Extracting the data is a two-stage procedure:
When the extraction process is finished, you can upload the json file to Code Charta
Trying different combinations of the metrics and of the Coda Charta functionalities can give you, your colleagues and your management interesting insights and ideas why and where you should invest to improve code quality. Don't be shy. Rely fully on your play instincts and give it a try.
Please let me know if you were successfull using this tool. I would be happy to hear your ideas how the extractor can be improved.
Thank you for taking the time to read this article and best regards,
Ben
Finally, a few examples:
More than 2 million LOC. This extract ran for more than 24 hours. You can see which parts of this system are connected.

Same system but aggregated on package level
Analysis of database access statements. Sourounded by the red rectangle is a refactored part of the code where database operations were separated out into a few classes to isolate business logic from techical aspects. You can see how these „suburbs“ contrast with the high rise legacy buildings in red, which are tightly coupled to the data model.
Code charta also allows to display packages and sub packages as streets. The more fine grained you package structure, the more branching is your street map.
Find objects that dedend on one another recursively. The problem my be resolved by splitting into smaller objects and/or using dependency inversion with interfaces
Four decades of ABAP
We all know that ABAP has undergone rapid development since its early days. Coming from a COBOL influenced, procedural approach, which allowed business people with few technical experience to enhance SAP standard coding, it has evolved to a fully grown object oriented language used by professional developer teams to build custom software products with tens or hundreds of thousands or even more LOC (Lines of Code).
Finding hotspots
Working with large codebases confronts us as developers or software architects with major challenges, especially when we’re dealing with “legacy” solutions that have grown for years or even decades and incorporate multiple development paradigms and architectural styles.
When you navigate through the code of such projects, sooner or later you come across one of those huge classes or function groups that consists of thousands of LOC and is overwhelmingly complex. Objects like this tend to be a source of bugs and cause high maintenance and testing efforts, which makes further development cumbersome and slow (and who want's that?).
When we find objects like this, we know that a refactoring them would pay off in the long term. But as time is always limited, we need a way to identify the hotspots where an invest in software quality promises the greatest value. Typically, our hotspot candidates would be very large and complex modules that are changed frequently.
Most of the information required for such a hotspot analysis can be obtained with SAP standard transaction /SDF/CD_CCA. It allows to measure different aspects of custom code like size, complexity, number of changes, SQL statements, and other parameters for methods, function modules or includes.
But working with large, detailed and unaggregated lists is cumbersome and the presentation of pure numbers to management an colleagues was not very effective. So, how about enriching the information from /SDF/CD_CCA a little and visualize it in a way that speaks for itself?
ABAP Code Cities
In January, I found enno.wulffs blog post on code visualization (I Have A Dream: Code Visualization | SAP Blogs) and was fascinated by the idea of code cities. There were several tools with extractors for languages like Java or C#, but I couldn’t find any for ABAP. After a while I found Code Charta by MaibornWolff, which supports an open json format for custom extractors.
I wrote an ABAP extractor that can convert data from /SDF/CD_CCA in such a way that it can be loaded into Code Charta. It’s named ABAP2CodeCharta.
This is an ABAP Code City:
A code city from one of our ABAP projects, before we started to refactor the code. Each building stands for a class, function group or program. The height of the building stands for the size of the module and the ground areas represents the average size of its submodules (methods, function modules, includes). Yellow and red coloured buildings indicate that a module was changed many times. The largest, red building (marked in orange in the picture above) in this project is a class with nearly 4000 LOC that had been changed 193 times. Doesn’t this smell like high maintenance cost?
This is the same project after a few months:
Some of the skyscrapers, which mixed up many business and technical functionalities, have given way to nice suburbs made of tiny classes that respect the clean code principles and are designed for automated testing. These suburbs are a lot more robust and follow a standardized structure so they can easily be maintained by everyone in the team.
Available metrics
Focusing only on module size may seem an oversimplification but combined with the change frequency it’s a surprisingly good indicator for possible maintenance issues. Nevertheless, there are also other interesting metrics we can use to identify problematic areas. Currently the following metrics are available:
- LinesOfCode:
- Total lines of code (including comments and empty lines)
High values indicate that the SRP (Single Responsibility Principle) might have been violated - Statements: Total number of ABAP Statements
Might be more precise than Lines of Code, in case you have modules with many comments, multiline statements and empty lines - AvgStatementsPerMethod: Average number of statements per submodule
Analyse if your code follows the SRP on submodule level. According to the Clean ABAP guidelines values should be between 3 and 5. - Complexity: Total number of conditional statements (if/elseif/else/case/when/do/while).
High Complexity means that there are many possible paths through you code, making it hard to test. - AvgComplexityPerMethod: Average number of paths through the methods of a class (or module)
- ComplexityOfConditions: Number of Operators (OR/AND/NOT) in conditions weighted by decision depth. High values hint to deeply nested conditional statements and/or very complex conditional logic, which makes code hard to maintain
- DBAccesses: Number of SQL/DML statements
If a module has many SQL/DML statements, its design might be tightly coupled to the database model. You might want to consider moving database related logic to other classes to separate business and technical aspects - NumberOfChanges: Total number of changes in a module
Parts of the system that are changed frequently should be easy to maintain (e.g. low values for complexity and size). On the other hand, normally you don’t need to invest in refactoring of code that is hard to maintain, but never changed.
Dependencies
ABAP2CodeCharta uses ABAP where-used analysis, to find dependencies between modules. The results are visualized as lines between the buildings

Incoming and outgoing dependecies are displayed in different colours. Modules with many dependencies or connections between large modules are indications of tight coupling, which increases the risk for side effects when code is changed. Splitting these modules into small classes and representing dependencies through interfaces instead of referring classes directly might help to evolve towards to a more loosely coupled system that is easier to maintain and to test.
Creating you own Code City
Code Charta
CodeCharta is open source and available on Github (MaibornWolff/codecharta: CodeCharta visualizes multiple code metrics using 3D tree maps. (github.com...) or as online demo (CodeCharta (maibornwolff.github.io)).
You can also run it in a docker container (codecharta/codecharta-visualization (docker.com)).
ABAP Extractor
The ABAP extractor is available on Github (ABAP-2-CODE-CHARTA/src at main · BenjaminWeisheit/ABAP-2-CODE-CHARTA (github.com)) and can be installed via ABAPGit.
Extracting the data
Extracting the data is a two-stage procedure:
- Create a variant for transaction /SDF/CD_CCA
- Start transaction /SDF/CD_CCA and chose Code Metric

- Select the objects that should be analysed, make sure you check the additional analysis modes as shown below and save your selection as variant.

- Start transaction /SDF/CD_CCA and chose Code Metric
- Run the extractor report ZI_ABAP_TO_CODECHARTA with:
- /SDF/CD_CCA variant you created in the first step
- Download path for the result
- Choose the aggregation level for the data (module or package)
- Choose if you want to analyse dependencies. You can analyse all dependencies or cycles (A->B->A, which would be a strong indicator for design problems)
 I recommend running the extractor in the background. Especially when you use the dependency analysis for a larger amount of code the extraction might take a few hours.
When the extraction process is finished, you can upload the json file to Code Charta
Be curious
Trying different combinations of the metrics and of the Coda Charta functionalities can give you, your colleagues and your management interesting insights and ideas why and where you should invest to improve code quality. Don't be shy. Rely fully on your play instincts and give it a try.
Please let me know if you were successfull using this tool. I would be happy to hear your ideas how the extractor can be improved.
Thank you for taking the time to read this article and best regards,
Ben
Finally, a few examples:
More than 2 million LOC. This extract ran for more than 24 hours. You can see which parts of this system are connected.
Same system but aggregated on package level
Analysis of database access statements. Sourounded by the red rectangle is a refactored part of the code where database operations were separated out into a few classes to isolate business logic from techical aspects. You can see how these „suburbs“ contrast with the high rise legacy buildings in red, which are tightly coupled to the data model.

Code charta also allows to display packages and sub packages as streets. The more fine grained you package structure, the more branching is your street map.

Find objects that dedend on one another recursively. The problem my be resolved by splitting into smaller objects and/or using dependency inversion with interfaces

- SAP Managed Tags:
- ABAP Development
28 Comments
You must be a registered user to add a comment. If you've already registered, sign in. Otherwise, register and sign in.
Labels in this area
-
A Dynamic Memory Allocation Tool
1 -
ABAP
8 -
abap cds
1 -
ABAP CDS Views
14 -
ABAP class
1 -
ABAP Cloud
1 -
ABAP Development
4 -
ABAP in Eclipse
1 -
ABAP Keyword Documentation
2 -
ABAP OOABAP
2 -
ABAP Programming
1 -
abap technical
1 -
ABAP test cockpit
7 -
ABAP test cokpit
1 -
ADT
1 -
Advanced Event Mesh
1 -
AEM
1 -
AI
1 -
API and Integration
1 -
APIs
8 -
APIs ABAP
1 -
App Dev and Integration
1 -
Application Development
2 -
application job
1 -
archivelinks
1 -
Automation
4 -
BTP
1 -
CAP
1 -
CAPM
1 -
Career Development
3 -
CL_GUI_FRONTEND_SERVICES
1 -
CL_SALV_TABLE
1 -
Cloud Extensibility
8 -
Cloud Native
7 -
Cloud Platform Integration
1 -
CloudEvents
2 -
CMIS
1 -
Connection
1 -
container
1 -
Debugging
2 -
Developer extensibility
1 -
Developing at Scale
4 -
DMS
1 -
dynamic logpoints
1 -
Eclipse ADT ABAP Development Tools
1 -
EDA
1 -
Event Mesh
1 -
Expert
1 -
Field Symbols in ABAP
1 -
Fiori
1 -
Fiori App Extension
1 -
Forms & Templates
1 -
IBM watsonx
1 -
Integration & Connectivity
10 -
JavaScripts used by Adobe Forms
1 -
joule
1 -
NodeJS
1 -
ODATA
3 -
OOABAP
3 -
Outbound queue
1 -
Product Updates
1 -
Programming Models
13 -
Restful webservices Using POST MAN
1 -
RFC
1 -
RFFOEDI1
1 -
SAP BAS
1 -
SAP BTP
1 -
SAP Build
1 -
SAP Build apps
1 -
SAP Build CodeJam
1 -
SAP CodeTalk
1 -
SAP Odata
1 -
SAP UI5
1 -
SAP UI5 Custom Library
1 -
SAPEnhancements
1 -
SapMachine
1 -
security
3 -
text editor
1 -
Tools
16 -
User Experience
5
Top kudoed authors
| User | Count |
|---|---|
| 6 | |
| 5 | |
| 3 | |
| 3 | |
| 2 | |
| 2 | |
| 2 | |
| 2 | |
| 1 | |
| 1 |