
- SAP Community
- Products and Technology
- Technology
- Technology Blogs by SAP
- Set Up Remote Debugging to Diagnose CAP Applicatio...
Technology Blogs by SAP
Learn how to extend and personalize SAP applications. Follow the SAP technology blog for insights into SAP BTP, ABAP, SAP Analytics Cloud, SAP HANA, and more.
Turn on suggestions
Auto-suggest helps you quickly narrow down your search results by suggesting possible matches as you type.
Showing results for
Advisor
Options
- Subscribe to RSS Feed
- Mark as New
- Mark as Read
- Bookmark
- Subscribe
- Printer Friendly Page
- Report Inappropriate Content
06-11-2021
4:38 PM

Introduction
In this blog post, we will explore the process of setting up remote debugging for a deployed CAP (Cloud Application Programming) application instance running on the SAP BTP (Business Technology Platform) in a Cloud Foundry environment. Remote debugging is a valuable tool for developers when troubleshooting misbehaving applications, especially when analysis of logs or local testing fails to reproduce runtime errors.
By enabling remote debugging, developers can leverage their local development environment to inspect and interact with the application, allowing for efficient problem diagnosis.
Disclaimer: It isn't advisable to enable remote debugging for an application running on production.
The key topics covered in this article include:
- Authenticating to Cloud Foundry with the Command Line Interface (CLI)
- Connecting to a Cloud Foundry application instance using the Secure Shell (SSH) protocol
- Enabling the Node.js inspector for remote debugging on a running application instance
- Enabling port forwarding to Cloud Foundry
- Attaching a Node.js debugger to a process running on a Cloud Foundry application instance
Step 1: Install and Verify the Cloud Foundry Command Line Interface (CLI) Installation
To begin, we need to install the Cloud Foundry CLI. Follow the official guide for installation instructions, which provides detailed steps tailored to your operating system.
Once the installation is complete, we can verify it by performing the following steps:
- Open a new command prompt session or terminal.
- Run the following command:
╰─$ cf -vIf the installation is successful, the Cloud Foundry CLI version will be displayed in the standard output. For example:
cf version 7.2.0+be4a5ce2b.2020-12-10Step 2: Log In to the Cloud Foundry Instance with the CLI and SAP Single Sign-On
To log in to the Cloud Foundry account, the
cf login command is used.cf login [-a API_URL] [-o ORG] [-s SPACE] [--sso]Where:
API-URLis your API endpoint (for example, https://api.cf.eu20.hana.ondemand.com).ORGis the org name where your application is deployed. Orgs map to business units have quota plans and unique roles.SPACEis the space in the organization where your application is deployed. Spaces map to teams or products, hold applications, and have unique roles.--ssoPrompt for a one-time passcode to log in. SAP Single Sign-On is the safest and most recommended way to log in.
The org name, API endpoint, and space information can be found in the SAP BTP Cockpit under Home → Regions → Global Accounts → Subaccounts.

SAP BTP Cockpit Overview
Sample usage of the
cf login command:╰─$ cf login -a https://api.cf.eu20.hana.ondemand.com -o myorg -s myspace --sso
API endpoint: https://api.cf.eu20.hana.ondemand.com
Temporary Authentication Code ( Get one at https://login.cf.eu20.hana.ondemand.com/passcode 😞
Upon executing the command with the
--sso option, the Cloud Foundry CLI will display the API endpoint and prompt you for one-time passcode to log in.- Open a browser and navigate to the URL provided, such as https://login.cf.eu20.hana.ondemand.com/passcode
- Authenticate yourself using SAP Single Sign-On.

SAP BTP SAP Single Sign-On

SAP BTP Temporary Authentication Code
- Copy the one-time passcode generated.
- Return to the console and paste the passcode into the prompt.
- Once authenticated, the CLI will provide details about the targeted org and space.
Temporary Authentication Code ( Get one at https://login.cf.eu20.hana.ondemand.com/passcode 😞

Authenticating...

OK


Targeted org myorg.

Targeted space myspace.

API endpoint:   https://api.cf.eu20.hana.ondemand.com

API version:    3.99.0

user:           myemail@sap.com

org:            myorg

space:          myspace
Note that Cloud Foundry uses a role-based access control system to grant permissions to members, so make sure you've got the appropriate role permissions assigned. For example, by being an org auditor.
Step 3: Connect to a Cloud Foundry Application Instance Using SSH
In Cloud Foundry, you can SSH into application instances unless SSH access has been prohibited by an org/space manager. If you would like more detailed information, you can refer to the Enable and Disable SSH Access documentation.
To check if an application is accessible via SSH, you can use the following command:
╰─$ cf ssh-enabled myapp

ssh support is enabled for app 'myapp'.
If the app isn't accessible via SSH, it can be enabled with the command
cf enable-ssh.╰─$ cf enable-ssh myapp
Enabling ssh support for app myapp as youremail@sap.com...
...
OKYou must restart your app after enabling SSH access. To restart your app, run the following command:
╰─$ cf restart myappPlease note that if SSH access has been disabled at the space level by a space manager, all applications within that space will inherit the access level. In such cases, even if you, as a developer, enable SSH access at the application level, you cannot SSH into individual applications.
Assuming SSH access is allowed at the deployment, space, and application level, you can initiate an interactive SSH session with the VM hosting the application by running the following command:
╰─$ cf ssh myappOnce connected, you will be in an interactive SSH session with the VM, indicated by the prompt:
vcap@afa9bea3-b619-6476-5e97-1328:~$Step 4: Enable the Node.js Inspector for Remote Debugging on a Running Application Instance
To enable debug mode for a running Node.js process, you'll need to determine its unique process ID (PID). On Linux and Unix-like environments, you can use the
ps command to obtain this information. Here's an example:vcap@afa9bea3-b619-6476-5e97-1328:~$ ps aux
USER PID %CPU %MEM VSZ RSS TTY STAT START TIME COMMAND
vcap 151 0.0 0.1 687580 118376 ? Sl May28 0:05 node /home/vcap/deps/0/bin/npx cds run
...Once the PID of the Node.js process running the application is known, you can use the kill command to send a debugging signal to it. The Node.js runtime activates the inspector protocol when it receives a usr1 signal. The inspector protocol is more or less a debugging protocol that allows tools to instrument, inspect, debug, and profile.
vcap@afa9bea3-b619-6476-5e97-1328:~$ kill -usr1 151After sending this signal to the Node.js process, inspect the application logs. You should see that a debugger is now listening on ws://127.0.0.1:9229/48d7a94b-acb8-4d43-9932-95b781ee932d, this indicates that the Node.js process has switched to debug mode and is actively listening for debugging request on a WebSocket server located at host and port 127.0.0.1:9229.
SAP BTP Cockpit Application Logs
Step 5: Enable Port Forwarding to Cloud Foundry
When using the
cf ssh command,the-Lflag enables local port forwarding, binding an output port on your machine to an input port on the application VM. Pass in a local port and your application VM port and port number, all colon-delimited. You can prepend your local network interface or use the defaultlocalhost.
Enables local port forwarding
$ cf ssh MY-APP -L [LOCAL-NETWORK-INTERFACE:]LOCAL-PORT:REMOTE-HOST-NAME:REMOTE-HOST-PORTHere's an example of enabling local port forwarding using the
cf ssh command:cf ssh -N -L 9229:127.0.0.1:9229 myappThis command initiates an SSH tunnel session where a connection to port 9229 on your development environment is forwarded to the myapp instance on port 9229.
Now, you can attach a debugger such as Visual Studio Code, SAP Business Application Studio (BAS) or Chrome DevTools to localhost:9229. With this setup, you'll be able to debug your application instance running on SAP BTP, Cloud Foundry environment as if the Node.js application were running locally.
Step 6: Attach a Node.js Debugger to a Process Running on a Cloud Foundry Application Instance
Node.js debuggers support attaching to a running program in debug mode. In VS Code and Chrome DevTools, there's a built-in "Attach to Node Process" debugging model.
Here's how you can attach the debugger to a process running on a Cloud Foundry application instance:
Attach VS Code Debugger
Add the following debug configuration to your
launch.json file:{
"name": "Attach to a Cloud Foundry Instance on Port 9229",
"port": 9229,
"request": "attach",
"type": "node",
"localRoot": "${workspaceFolder}",
"remoteRoot": "/home/vcap/app"
}For example:

VS Code Debug Configuration
For detailed information on how to add a new debug configuration, refer to Add a new configuration.
Launch VS Code and click on the Run and Debug button in the sidebar.

Click on Start Debugging to initiate the debugging session.

Open the Debug Console.

VS Code Debugger Console, Loaded Scripts ...
At this point, if you followed the previous steps, you should be able to interact with the REPL, view loaded scripts, and set breakpoints.
Attach Chrome DevTools
Open the Chrome browser (or any Chromium-based browser) and enter chrome://inspect in the address bar. If you're using Microsoft Edge, it also supports the V8 JavaScript engine and can be used for debugging.
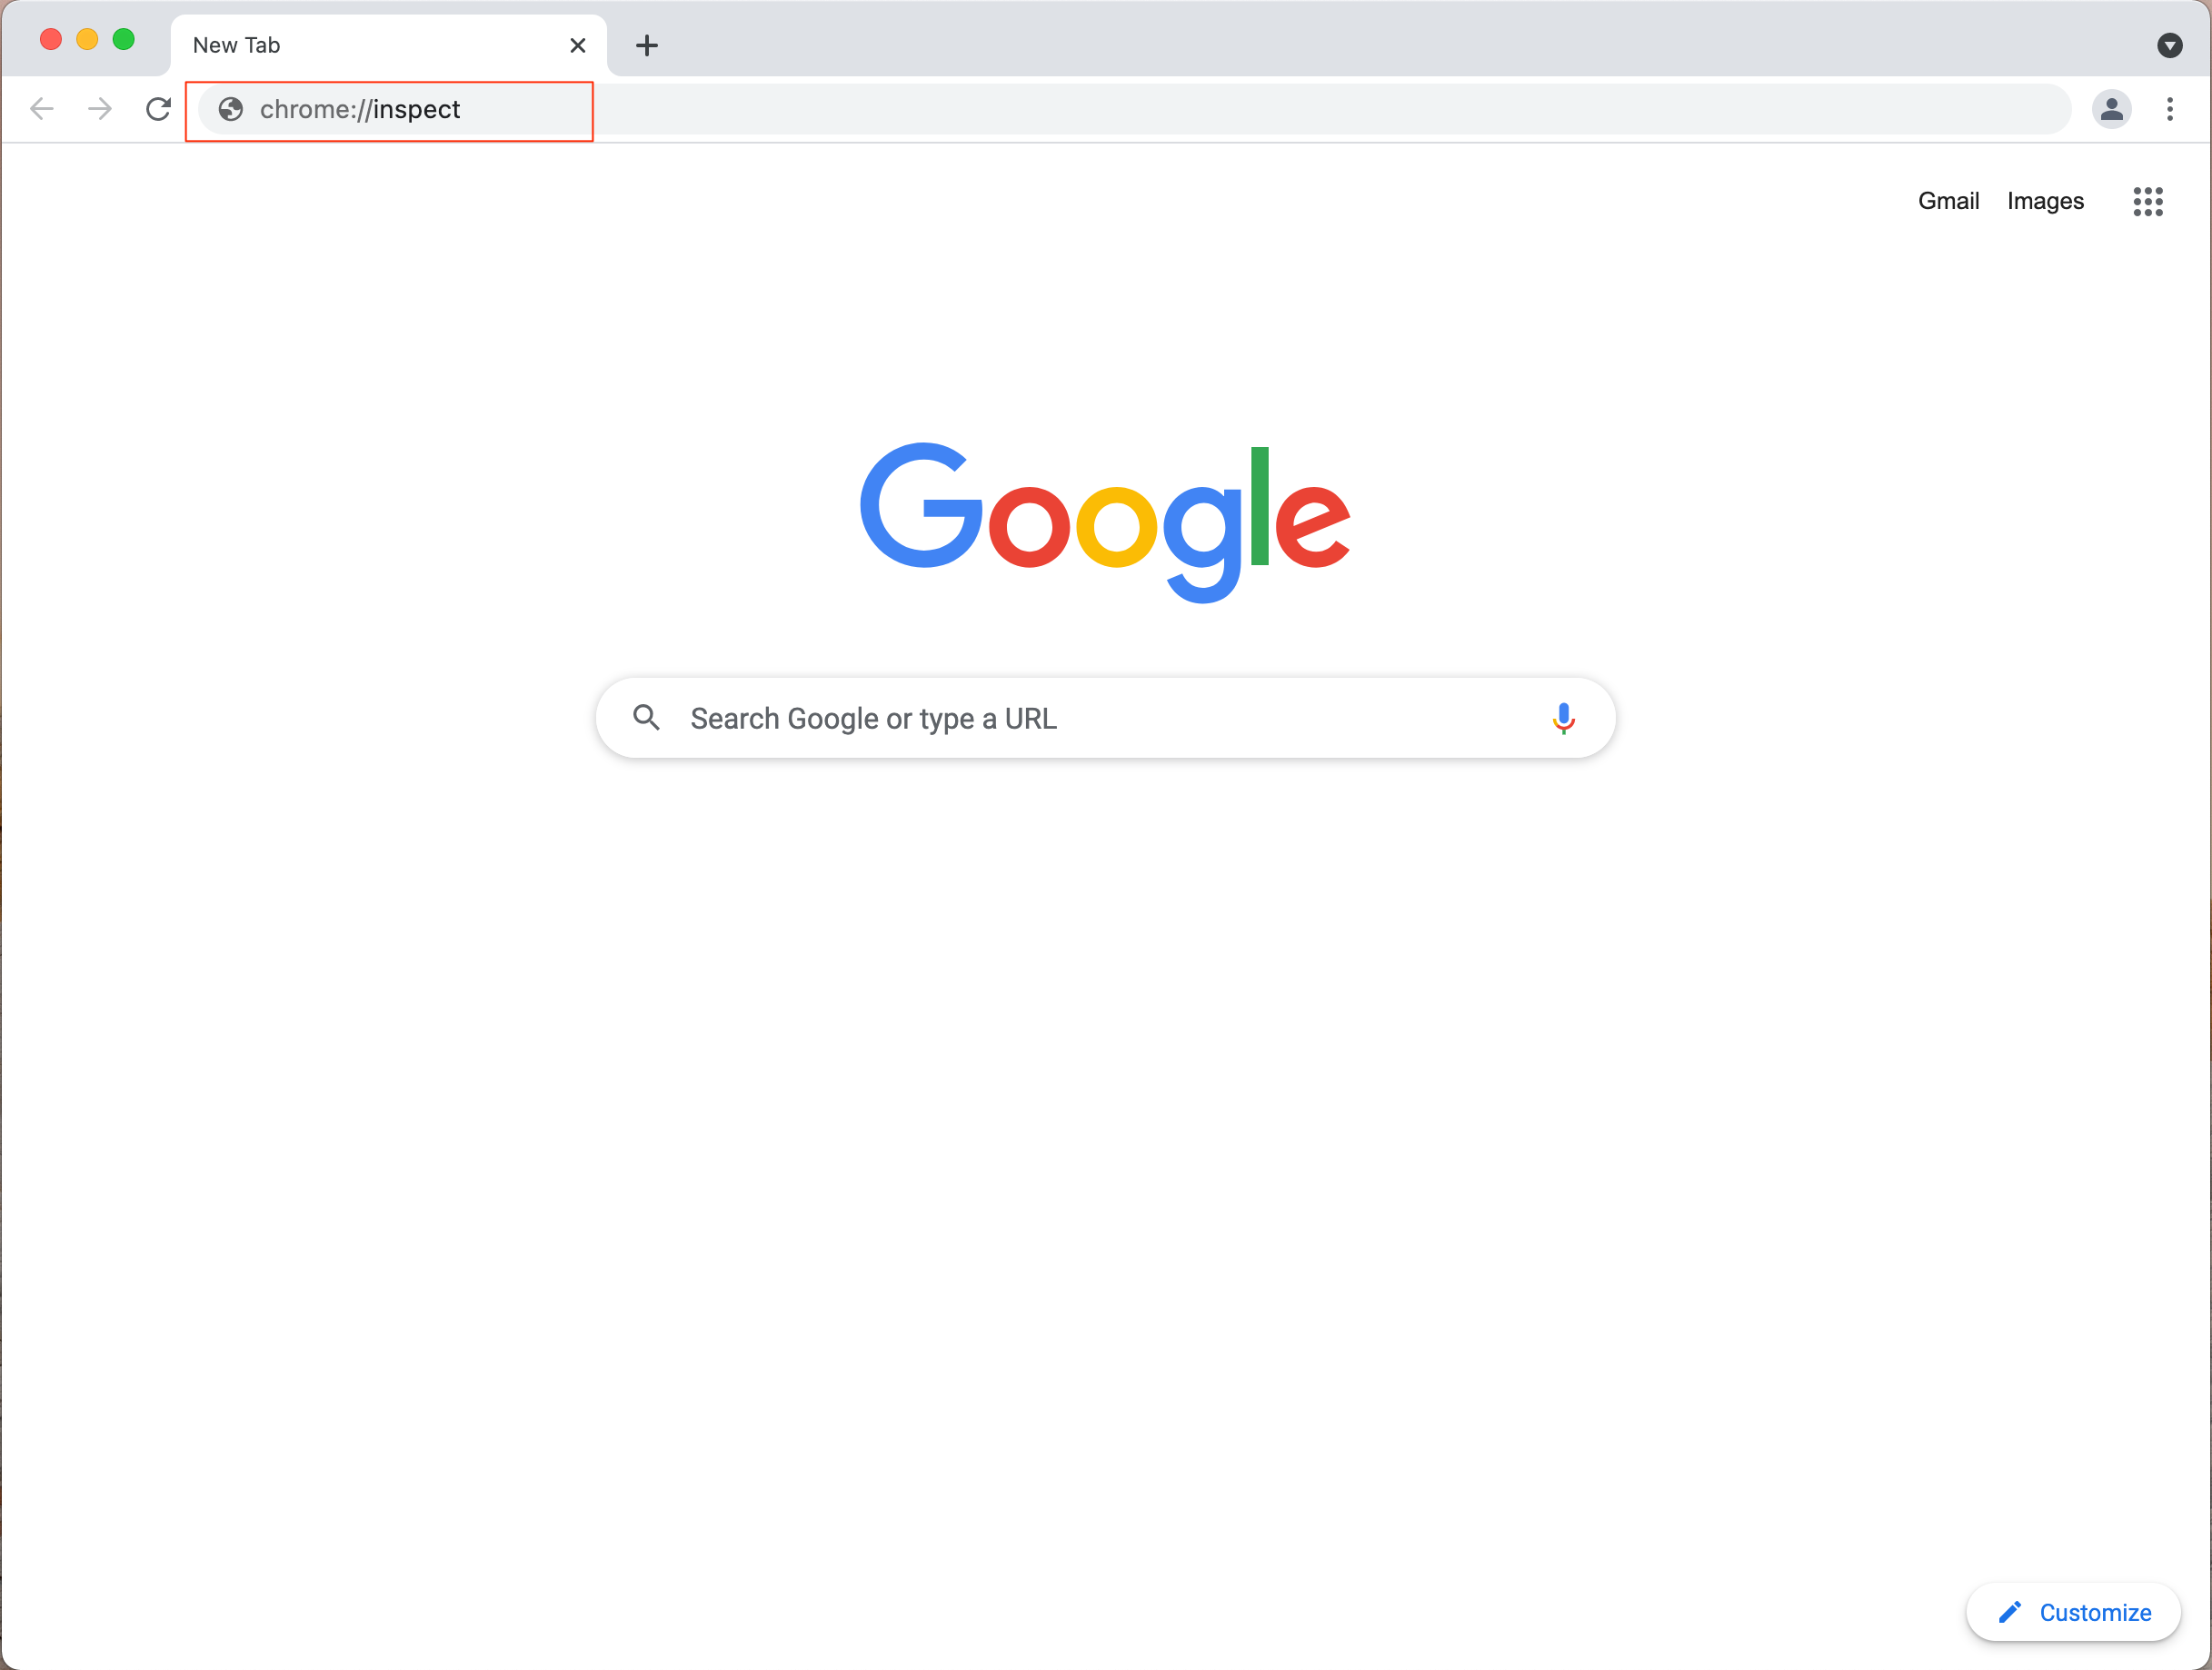
Chrome Browser Window
After navigating to the URL, you'll see the following page:

Chrome Browser Window (Inspect Devices)
On the Devices screen, click the Open dedicated DevTools for Node link. This will open a new window pops up for debugging a node session.
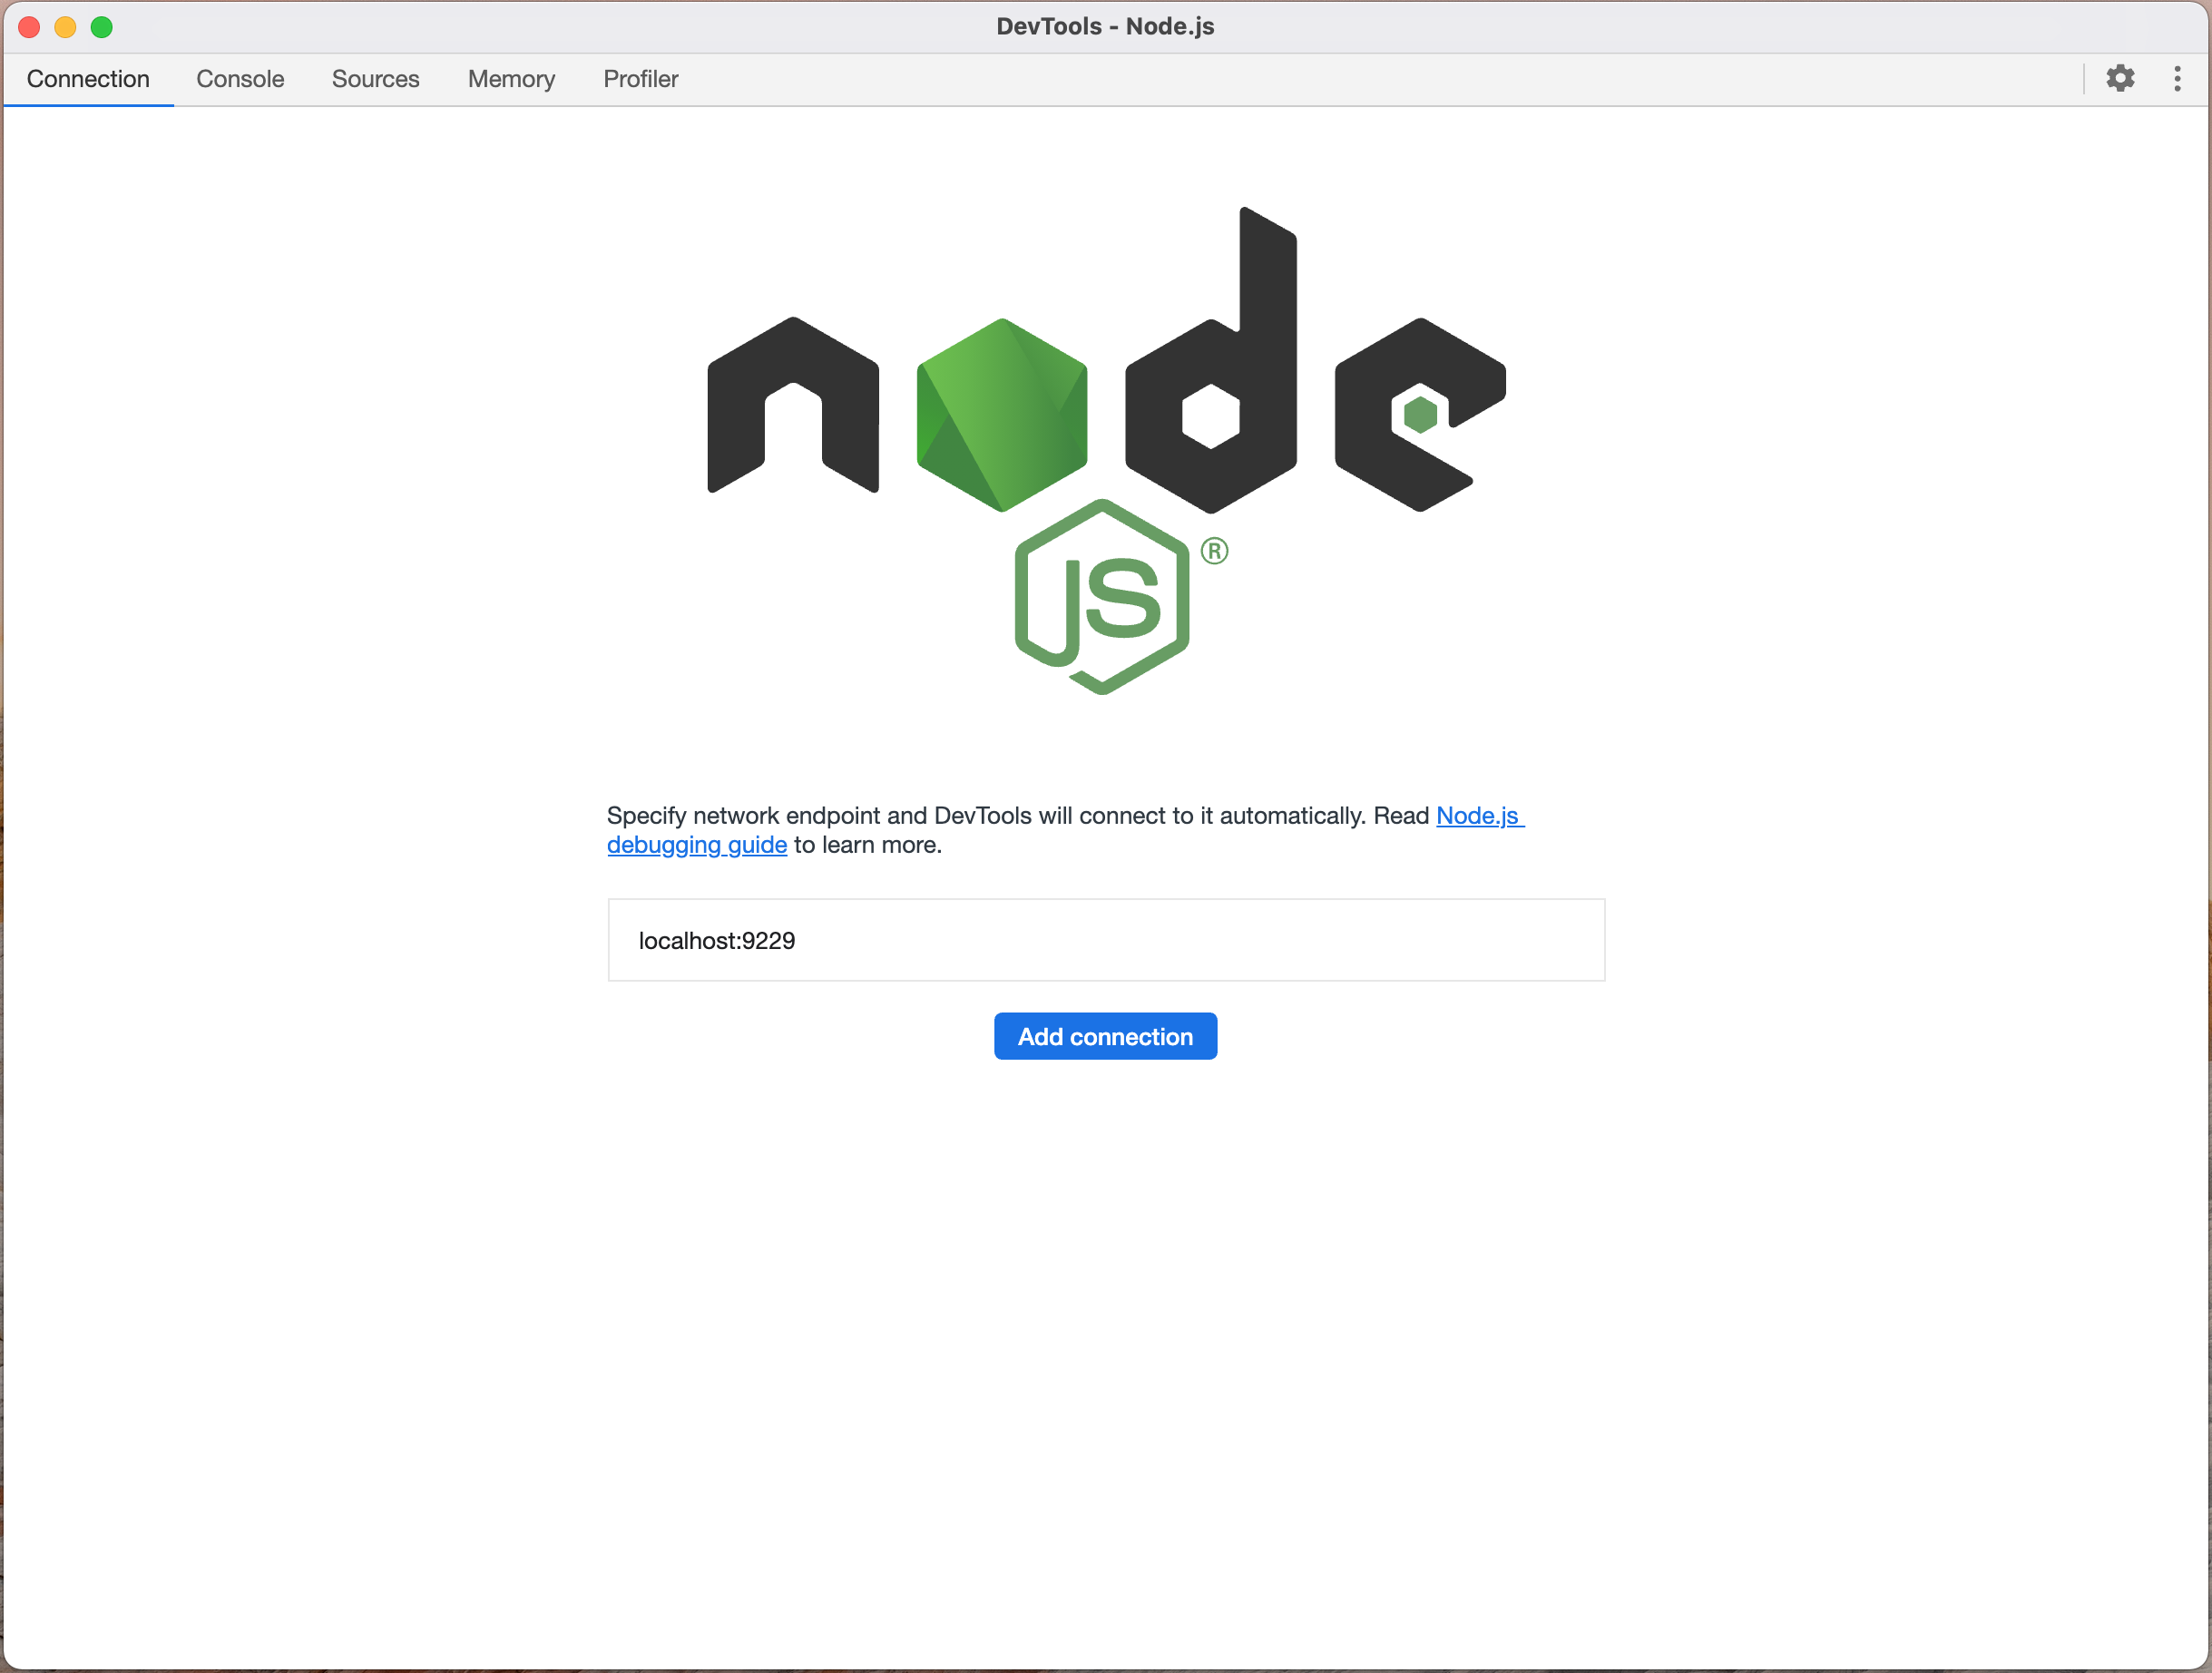
Chrome DevTools Node.js Debugger

Chrome Debugger Console Panel
If you followed the previous steps, we can now debug, interact with the REPL, source code, and set breakpoints.

Chrome Debugger Sources Panel
Conclusions
Following the steps outlined in this blog post, you can set up remote debugging for CAP Applications (Node.js Stack) at runtime on SAP BTP and Cloud Foundry Environment. This will allow you to diagnose in real time and troubleshoot any issues that may arise in your applications. This approach will help you quickly identify the source of the problem and help you resolve it. Remote debugging provides a way to pinpoint the issue's exact location and can help developers effectively fix it.
CLOUD FOUNDRY, the CLOUD FOUNDRY logo, and other CLOUD FOUNDRY marks used in this block post are trademarks of the CloudFoundry.org Foundation in the United States and other countries.
Labels:
25 Comments
You must be a registered user to add a comment. If you've already registered, sign in. Otherwise, register and sign in.
Labels in this area
-
ABAP CDS Views - CDC (Change Data Capture)
2 -
AI
1 -
Analyze Workload Data
1 -
BTP
1 -
Business and IT Integration
2 -
Business application stu
1 -
Business Technology Platform
1 -
Business Trends
1,658 -
Business Trends
93 -
CAP
1 -
cf
1 -
Cloud Foundry
1 -
Confluent
1 -
Customer COE Basics and Fundamentals
1 -
Customer COE Latest and Greatest
3 -
Customer Data Browser app
1 -
Data Analysis Tool
1 -
data migration
1 -
data transfer
1 -
Datasphere
2 -
Event Information
1,400 -
Event Information
66 -
Expert
1 -
Expert Insights
177 -
Expert Insights
299 -
General
1 -
Google cloud
1 -
Google Next'24
1 -
Kafka
1 -
Life at SAP
780 -
Life at SAP
13 -
Migrate your Data App
1 -
MTA
1 -
Network Performance Analysis
1 -
NodeJS
1 -
PDF
1 -
POC
1 -
Product Updates
4,577 -
Product Updates
344 -
Replication Flow
1 -
RisewithSAP
1 -
SAP BTP
1 -
SAP BTP Cloud Foundry
1 -
SAP Cloud ALM
1 -
SAP Cloud Application Programming Model
1 -
SAP Datasphere
2 -
SAP S4HANA Cloud
1 -
SAP S4HANA Migration Cockpit
1 -
Technology Updates
6,873 -
Technology Updates
422 -
Workload Fluctuations
1
Related Content
- Configuring SAP CI/CD pipeline for Deploying ReactJS application in Cloud Foundry in Technology Q&A
- Consuming SAP with SAP Build Apps - Mobile Apps for iOS and Android in Technology Blogs by SAP
- Demystifying the Common Super Domain for SAP Mobile Start in Technology Blogs by SAP
- What’s new in Mobile development kit client 24.4 in Technology Blogs by SAP
- How to use AI services to translate Picklists in SAP SuccessFactors - An example in Technology Blogs by SAP
Top kudoed authors
| User | Count |
|---|---|
| 40 | |
| 25 | |
| 17 | |
| 13 | |
| 8 | |
| 7 | |
| 7 | |
| 7 | |
| 6 | |
| 6 |