
- SAP Community
- Products and Technology
- Technology
- Technology Blogs by SAP
- How to Use Data Visualization to Hire and Retain y...
Technology Blogs by SAP
Learn how to extend and personalize SAP applications. Follow the SAP technology blog for insights into SAP BTP, ABAP, SAP Analytics Cloud, SAP HANA, and more.
Turn on suggestions
Auto-suggest helps you quickly narrow down your search results by suggesting possible matches as you type.
Showing results for
former_member74
Explorer
Options
- Subscribe to RSS Feed
- Mark as New
- Mark as Read
- Bookmark
- Subscribe
- Printer Friendly Page
- Report Inappropriate Content
06-07-2021
5:00 AM
Knowing the importance of investing in your workforce is one thing but the actual process of hiring, training, and retaining your employees is a whole other endeavor. Especially in today’s climate, where human resource (HR) teams are increasingly working through complex questions such as:
Employees are the driving force behind your company. So, it’s important to have an engaged and high-performing workforce. And your HR team recognizes the importance of offering those great experiences for employees - but how can they find the answers to the above questions and truly meet their workforce goals?
This is where data visualization and analytics can help.
Data visualization empowers your HR teams to discover patterns and correlations, providing HR with a means to deliver strategic recommendations and drive better experiences for its people. When done correctly, data visualization enables your people to get to the truth more quickly.
In this blog, we’ll explain what data visualization is and explore its benefits for HR. Then, we’ll meet Sandra, an HR executive at Best Run Bikes. We’ll dive into her HR use case to see how the right tool can help with hiring, training, and retaining a powerful workforce.

Data visualization is the graphic representation of data. It's an efficient way of communicating information, particularly when that information is numerous. Visuals such as charts, graphs, maps, and bars help to communicate a story about your data so that stakeholders can clearly and easily consume and understand patterns of information in an efficient manner.
HR works with an enormous amount of data—from pay information, employee data, engagement scores, feedback, surveys, to performance reviews. This large amount of HR data contains extremely valuable insights, key performance indicators (KPIs), and industry trends. While this data is essential to drive business success, it’s a tremendous task for any department to collect and make sense of all that HR data.
As humans, our brains can only process a very limited amount of information at a time. If that information is presented to us visually, we are more likely to quickly process that information. That's because our brains are programmed to understand images much faster than text: it processes information 60,000 times faster than the time it would to decode text.
Data visualization encourages your HR teams to understand, interact, and engage with their data and metrics—in a way that is easily consumable by all.
Adopting the right data visualization and analytics tool will also help you:

So, now that you know how data visualization can help your HR team, let us introduce you to Susan, an HR Executive at the fictional company, Best Run Bikes. With over 100 employees, Susan and her HR department use SAP Analytics Cloud to optimize her staffing, focusing on three main areas:
Hiring the right people requires a lot of time, money, and effort, and hiring the wrong people can be just as costly. Without data analytics to make data-driven decisions, Susan may be prone to hire based on some cognitive bias that she’s not aware of.
Susan and her team want to use data analytics and data visualization to find patterns in large volumes of HR data to make more insightful hiring decisions for her company.
Susan starts by uploading data from all the company’s employees into SAP Analytics Cloud. She looks for characteristics and commonalities among top performers such as:
Running this data against digital resumes, Susan can identify candidates with these same traits and predict the probability of success in a new recruit.
Another area where Susan relies on SAP Analytics Cloud is for salary allocation. Using historical trends, she can offer unbiased salaries to new hires that is consistent with the aggregate data of all her existing employees.
She can also juxtapose that data with employee attrition. If turnover correlates with salary, then perhaps offering higher salaries to new employers, and pay raises to existing employees will positively affect retention.
She notices that her company tends to lose top-tier employees after two years. Knowing this information helps her predict upcoming employment shortages, adjust compensation packages, and incorporate more on-job training.

Retention and engagement are ever-growing concerns for Susan and her team. To reduce the cost and disruption of attrition, Susan looks at answering the following key questions:
Using this information, Susan can take pre-emptive action to retain employees. Anticipating turnover early helps Susan and her team:

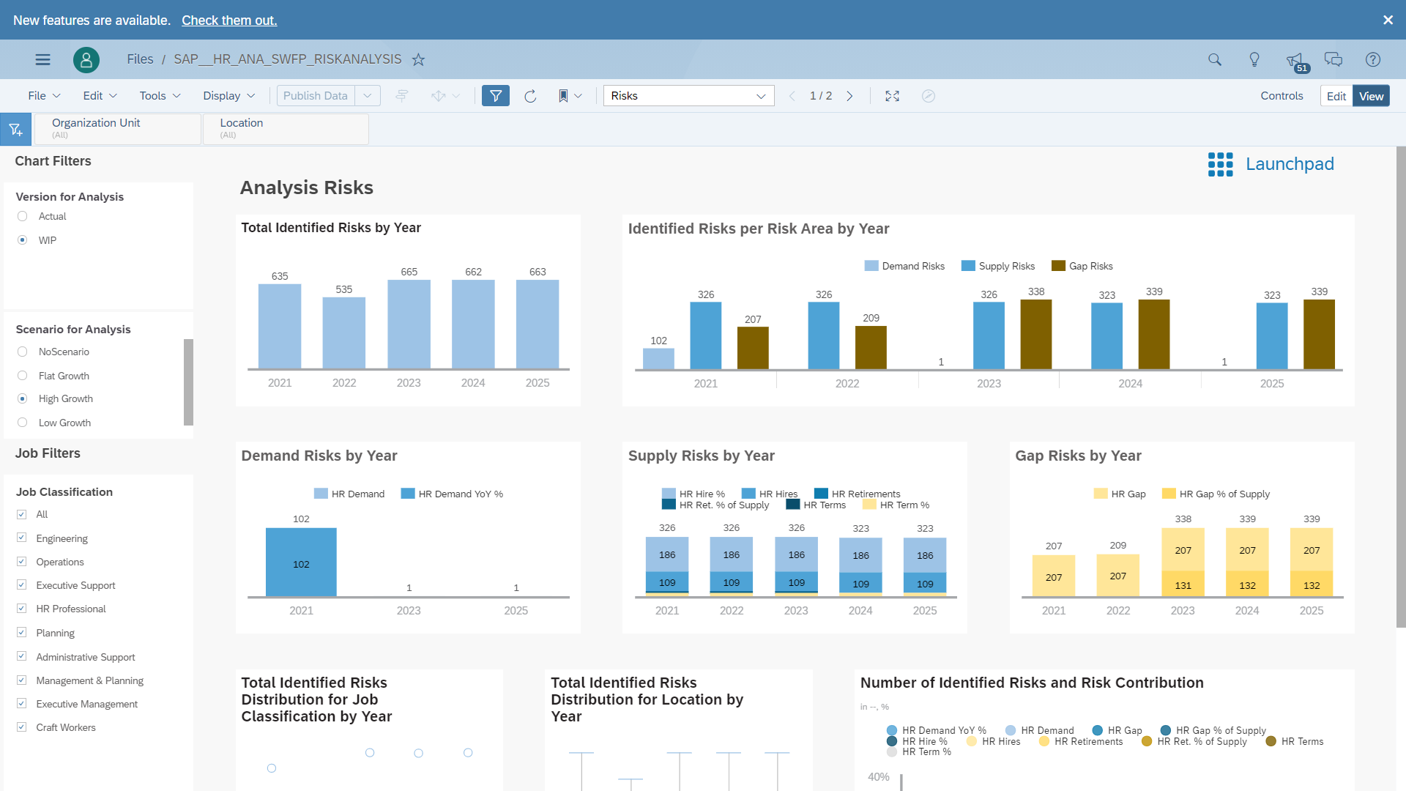
As for training, SAP Analytics Cloud helps Susan see exactly where her company’s strengths and weaknesses are, and how to properly address training and other resources.
Through her workforce planning dashboard, Susan recognizes that ongoing training will nurture employees in their career development as well as provide long-term investment in the company.
Based on data from a recent questionnaire, Susan looks at the psychological traits of her employees to determine leadership potential. The survey measures five personality traits, known as OCEAN, or the ‘Big Five:’
Based on these findings, she can make assessments into who is likely to succeed in a leadership role. Using data visualization, she can then see which training programs produce the highest results. From there, she can manage which training programs are best for each employee.
Susan uses SAP Analytics Cloud to answer her HR-related questions. The powerful enterprise analytics solution help Susan analyze patterns in her data to reveal key drivers impacting her company’s future success.
By combining HR data with revenue projections, Susan can conduct her workforce planning, such as:
Susan can further customize her stories by adding images, charts, tables, text, geo maps, and input controls. Once completed, she can share her dashboards with other users or teams, set permission levels, or compile them into an SAP digital boardroom agenda for presentation.
SAP Analytics Cloud – all analytics, all users, one product. Discover a new generation of cloud analytics.
To learn more about how analytics can work with your line of business, explore the Ultimate Guide to Enterprise Analytics.
- How do we hire the right candidates?
- How can we engage and retain employees?
- How can we offer unique development and training opportunities?
Employees are the driving force behind your company. So, it’s important to have an engaged and high-performing workforce. And your HR team recognizes the importance of offering those great experiences for employees - but how can they find the answers to the above questions and truly meet their workforce goals?
This is where data visualization and analytics can help.
Data visualization empowers your HR teams to discover patterns and correlations, providing HR with a means to deliver strategic recommendations and drive better experiences for its people. When done correctly, data visualization enables your people to get to the truth more quickly.
In this blog, we’ll explain what data visualization is and explore its benefits for HR. Then, we’ll meet Sandra, an HR executive at Best Run Bikes. We’ll dive into her HR use case to see how the right tool can help with hiring, training, and retaining a powerful workforce.
Table of Contents
- What is Data Visualization?
- What are the benefits of Data Visualization for HR?
- Use Case: How to Hire, Train, and Retain a Powerful Workforce
- How to Hire New Talent
- How to Retain Top Talent
- How to Train your Workforce
- Why Enterprise Analytics for HR
How can Data Visualization Help HR?
Data visualization is the graphic representation of data. It's an efficient way of communicating information, particularly when that information is numerous. Visuals such as charts, graphs, maps, and bars help to communicate a story about your data so that stakeholders can clearly and easily consume and understand patterns of information in an efficient manner.
HR works with an enormous amount of data—from pay information, employee data, engagement scores, feedback, surveys, to performance reviews. This large amount of HR data contains extremely valuable insights, key performance indicators (KPIs), and industry trends. While this data is essential to drive business success, it’s a tremendous task for any department to collect and make sense of all that HR data.
As humans, our brains can only process a very limited amount of information at a time. If that information is presented to us visually, we are more likely to quickly process that information. That's because our brains are programmed to understand images much faster than text: it processes information 60,000 times faster than the time it would to decode text.
Data visualization encourages your HR teams to understand, interact, and engage with their data and metrics—in a way that is easily consumable by all.
Adopting the right data visualization and analytics tool will also help you:
- Make better hiring decisions: Hiring new talent is an expensive process in terms of time, money, and effort. That’s why it’s crucial to recruit the right people with the right skillset at the right time. Data-driven recruitment is the key to hiring and retaining the best talent for your business objectives. Data analytics and data visualization can be used to discover patterns and correlations in your data, enabling HR to lead insightful hiring decisions across the company.
- Improve retention rates: Retaining the best employees continues to be one of the biggest challenges for companies. To reduce the cost and disruption of attrition, analytics and visualization tools can help you uncover the reasons behind employee retention. Using this information, you can proactively take the right action to prepare for vacancies and skills shortages and proactively address employee engagement needs.
- Develop more effective training and development programs: Training and development programs are a necessity for business performance. Using data visualizations, you can pull insights on which training programs are performing well, what types of employees suit what type of learning environments, and which employees are most likely to seek additional learning resources. Using these insights, you can better optimize the time, resources, and money spent on training.
A Use Case: How Data Visualization Helps Build a Powerful Workforce
So, now that you know how data visualization can help your HR team, let us introduce you to Susan, an HR Executive at the fictional company, Best Run Bikes. With over 100 employees, Susan and her HR department use SAP Analytics Cloud to optimize her staffing, focusing on three main areas:
- Hiring
- Retention
- Training
HIRING NEW TALENT
Hiring the right people requires a lot of time, money, and effort, and hiring the wrong people can be just as costly. Without data analytics to make data-driven decisions, Susan may be prone to hire based on some cognitive bias that she’s not aware of.
Susan and her team want to use data analytics and data visualization to find patterns in large volumes of HR data to make more insightful hiring decisions for her company.
Susan starts by uploading data from all the company’s employees into SAP Analytics Cloud. She looks for characteristics and commonalities among top performers such as:
- Education and qualifications
- Years of experience
- Skills
- Turnover rate
- Job satisfaction
Running this data against digital resumes, Susan can identify candidates with these same traits and predict the probability of success in a new recruit.
Another area where Susan relies on SAP Analytics Cloud is for salary allocation. Using historical trends, she can offer unbiased salaries to new hires that is consistent with the aggregate data of all her existing employees.
She can also juxtapose that data with employee attrition. If turnover correlates with salary, then perhaps offering higher salaries to new employers, and pay raises to existing employees will positively affect retention.
She notices that her company tends to lose top-tier employees after two years. Knowing this information helps her predict upcoming employment shortages, adjust compensation packages, and incorporate more on-job training.
Unite your HR and Finance teams for Workforce Planning using SAP Analytics Cloud
Learn how by reading the blog
RETAINING TOP TALENT
Retention and engagement are ever-growing concerns for Susan and her team. To reduce the cost and disruption of attrition, Susan looks at answering the following key questions:
- Who left, and why? (Based on exit interview data)
- Could anything be done to keep them? (Using historical retention data)
- Are employees engaged and excited to come into work? (Based on employee job satisfaction surveys and attrition rates)
- Are salaries and benefits competitive? (Based on historical and industry data)
- Are there opportunities for career growth and development? (Based on budget and employee surveys)
Using this information, Susan can take pre-emptive action to retain employees. Anticipating turnover early helps Susan and her team:
- Prepare for vacancies and skills shortages
- Proactively address employee engagement needs prior to her staff leaving
TRAINING
As for training, SAP Analytics Cloud helps Susan see exactly where her company’s strengths and weaknesses are, and how to properly address training and other resources.
Through her workforce planning dashboard, Susan recognizes that ongoing training will nurture employees in their career development as well as provide long-term investment in the company.
Based on data from a recent questionnaire, Susan looks at the psychological traits of her employees to determine leadership potential. The survey measures five personality traits, known as OCEAN, or the ‘Big Five:’
- Openness (how open they are to new experiences?)
- Conscientiousness (how much of a perfectionist they are?)
- Extroversion (how sociable they are?)
- Agreeableness (how considerate and cooperative they are?)
- Neuroticism (Do they get upset easily?)
Based on these findings, she can make assessments into who is likely to succeed in a leadership role. Using data visualization, she can then see which training programs produce the highest results. From there, she can manage which training programs are best for each employee.
Try SAP Analytics Cloud first-hand by signing up for your free trial
Learn more
WHY ENTERPRISE ANALYTICS FOR HR?
Susan uses SAP Analytics Cloud to answer her HR-related questions. The powerful enterprise analytics solution help Susan analyze patterns in her data to reveal key drivers impacting her company’s future success.
By combining HR data with revenue projections, Susan can conduct her workforce planning, such as:
- Allocating headcount to certain areas
- Analyzing salary to performance ratios
- Identifying issues before they arise with predictive analysis
Susan can further customize her stories by adding images, charts, tables, text, geo maps, and input controls. Once completed, she can share her dashboards with other users or teams, set permission levels, or compile them into an SAP digital boardroom agenda for presentation.
SAP Analytics Cloud – all analytics, all users, one product. Discover a new generation of cloud analytics.
To learn more about how analytics can work with your line of business, explore the Ultimate Guide to Enterprise Analytics.
Labels:
You must be a registered user to add a comment. If you've already registered, sign in. Otherwise, register and sign in.
Labels in this area
-
ABAP CDS Views - CDC (Change Data Capture)
2 -
AI
1 -
Analyze Workload Data
1 -
BTP
1 -
Business and IT Integration
2 -
Business application stu
1 -
Business Technology Platform
1 -
Business Trends
1,658 -
Business Trends
93 -
CAP
1 -
cf
1 -
Cloud Foundry
1 -
Confluent
1 -
Customer COE Basics and Fundamentals
1 -
Customer COE Latest and Greatest
3 -
Customer Data Browser app
1 -
Data Analysis Tool
1 -
data migration
1 -
data transfer
1 -
Datasphere
2 -
Event Information
1,400 -
Event Information
66 -
Expert
1 -
Expert Insights
177 -
Expert Insights
299 -
General
1 -
Google cloud
1 -
Google Next'24
1 -
Kafka
1 -
Life at SAP
780 -
Life at SAP
13 -
Migrate your Data App
1 -
MTA
1 -
Network Performance Analysis
1 -
NodeJS
1 -
PDF
1 -
POC
1 -
Product Updates
4,577 -
Product Updates
345 -
Replication Flow
1 -
RisewithSAP
1 -
SAP BTP
1 -
SAP BTP Cloud Foundry
1 -
SAP Cloud ALM
1 -
SAP Cloud Application Programming Model
1 -
SAP Datasphere
2 -
SAP S4HANA Cloud
1 -
SAP S4HANA Migration Cockpit
1 -
Technology Updates
6,873 -
Technology Updates
427 -
Workload Fluctuations
1
Related Content
- SAP Cloud Integration: Understanding the XML Digital Signature Standard in Technology Blogs by SAP
- Deliver Real-World Results with SAP Business AI: Q4 2023 & Q1 2024 Release Highlights in Technology Blogs by SAP
- Fast Track your AI Strategy with SAP Business AI in Technology Blogs by SAP
- Explore the Reference Solution Architecture for SAP Master Data Governance in Technology Blogs by SAP
- AIGC Innovative Experiment Integration with SAP Analytics Cloud for Intelligent Decision-making in Technology Blogs by SAP
Top kudoed authors
| User | Count |
|---|---|
| 40 | |
| 25 | |
| 17 | |
| 14 | |
| 8 | |
| 7 | |
| 7 | |
| 7 | |
| 6 | |
| 6 |