
- SAP Community
- Products and Technology
- Technology
- Technology Blogs by SAP
- SAP Intelligent Operations Control Center Topics a...
Technology Blogs by SAP
Learn how to extend and personalize SAP applications. Follow the SAP technology blog for insights into SAP BTP, ABAP, SAP Analytics Cloud, SAP HANA, and more.
Turn on suggestions
Auto-suggest helps you quickly narrow down your search results by suggesting possible matches as you type.
Showing results for
Advisor
Options
- Subscribe to RSS Feed
- Mark as New
- Mark as Read
- Bookmark
- Subscribe
- Printer Friendly Page
- Report Inappropriate Content
04-24-2021
3:25 PM
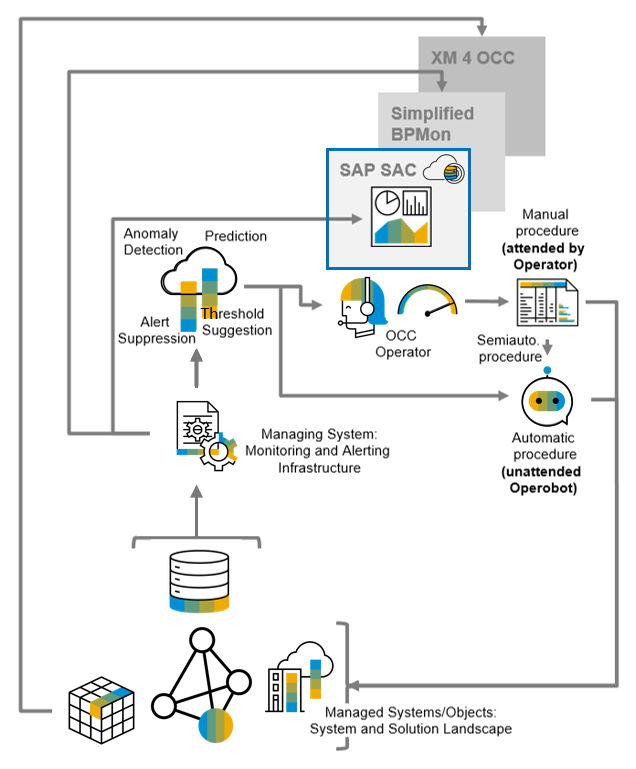
Previous blogs describe the Operations Control Center (OCC) as an integral part of SAP’s best practice operational model for IT organizations. It is responsible for services such as IT Monitoring, Alerting, Reporting/Analytics, Dashboards/Transparency as well as Root Cause Analysis of the hybrid system and solution landscape. Examples of attended (supported) and unattended (automated) event and alert reactions are found in part 1 and part 2 of this article series.
The IT organization, e.g. the IT Center or Expertise, consumes data and information to govern and manage information technology. Generally, a number of source systems are available to collect data from (managed systems) and to process data into information in (managing systems, aka Operations platforms). The latter provide applications for information usage.
In the analytical context, the following challenges exist:
The Operations Control Center needs (central) transparency to analyze and visualize IT processing in the system and solution landscape in scope.
SAP Focused Insights offers an OData interface to publish data to and provide data in SAP Analytics Cloud. This evolves an OCC’s SAP Solution Manage/Focused Insights dashboard collection to an Intelligent OCC’s IT Boardroom experience - utilizing modern features like machine learning and predictive analytics provided by SAP Analytics Cloud.
To use this interface, the content is configured in SAP Focused Insights/OCC Dashboard gadget and thereafter published to SAP Analytics Cloud. The interface FINS2SAC provides different collections usable by SAP Analytics Cloud visualizations and is officially available as of SAP Focused Insights ST-OST 200 SP4 for SAP Solution Manager 7.2 SP9:
The modeling process of unified analytics follows three phases. The (1) Exploration phase applies visual exploration to understand the characteristics of the data: accuracy, amount, completeness, correctness, currency, etc. of source data. The (2) Combination phase collects and integrates data from multiple sources and consolidates them, providing users with a unified view. The (3) Analysis phase discovers useful information and insights, supporting conclusion and decision-making.
In the example below, SAP Focused Insights has been used to create an OCC gadget. This gadget is now published to SAP Analytics Cloud.
SAP Focused Insights OCC Gadget:
After configuration of system connection and data source as well as modeling in SAP Analytics Cloud, the data from SAP Focused Insights can be used in advanced visualizations, analytics, prediction.
SAP Analytics Cloud Chart:
Operations Control Centers have specific requirements which can be implemented with a state-of-the-art data analytical and information visualization platform. A few challenges, presented as pain points and corresponding benefit cases, may serve as examples.
Different applications and "inboxes" for monitoring and alerting different aspects of your system and solution landscape make a central event management process difficult. This is true even if SAP Solution Manager is used for application operations monitoring and alerting as well as business process operations monitoring and alerting – as there are multiple monitoring applications two alert inboxes. For SAP Solution Manager, SAP Focused Insights provides a workaround which does not require SAP Analytics Cloud.
In SAP Focused Insights, configure your dashboard view(s) outlining the unified metric/alert hierarchy according to your requirements. Using the Operations type dashboard model, create a hierarchy of monitored objects. For example, organize your systems (SIDs), thereunder monitoring areas (level 1).
The specific metric data and alert information is aggregated under monitoring areas (level 2). In the example below, PH1’s S/4HANA ABAP Exceptions monitored object aggregates several metrics and alerts (level 3). Metric Number of ABAP System log Errors allows a drill-down into metric instances (in this case for several instances or the system), to visualize latest rated value for each metric/measure (level 4). Alert qRFC Errors allows a jump-in to the Alert Inbox, to process the latest alert instances/occurrences (level 4).
Different applications for analytics and reporting make a unified continuous improvement process difficult. Understanding source data is supported by data identification, data visualization, and data validation features in SAP Analytic Cloud. The exploration phase includes the selection of scenarios and data from source systems, for example system monitoring. Data from multiple sources is combined, the corresponding data collection is automated, analytics models are created, i.e. dimensions/characteristics and key figures/measures.
In the example below, SAP Analytics Cloud collects and channels data for system utilization from different managing systems. Geo map, bar chart, heat map, line chart visualizations are used to create the IT boardroom experience. Each view offers drill-down for detailed analyses.
Different applications for analytics and reporting makes a unified continuous improvement process difficult. Discovering useful information, informing conclusion, and supporting decision-making in and for IT operations is enabled by reports and dashboards using advanced features of SAP Analytics Cloud.
In the example below, SAP Analytics Cloud offers forecast of system utilization based on past data and machine learning/predictive models. Moreover, correlation analysis identifies system utilization metrics/key figures which show a relationship between them. These metrics/key figures can in turn be used to design and configure a more intelligent alerting in the Operations Control Center’s Event Management process.
In combination with modern business process documentation and monitoring (e.g. Simplified Business Process Monitoring by SAP Solution Manager) and state-of-the-art experience management (e.g. XM by Qualtrics), SAP Analytics Cloud or equivalent analytical application platforms offer a unified user experience, even central user interface, for seamless consumption and combined usage of IT operations data and information. Its user experience offers interaction with other operators and operobots to get faster insights for better decisions.
In the next articles of this series, the author will put Business Process Documentation and Monitoring and further examples of smart information usage into context of the Operations Control Center.
Aspects and Perspectives of the Intelligent Operations Control Center
Intelligent Operations Control Center - Topics and Examples Part I
Intelligent Operations Control Center - Topics and Examples Part II
Machine Learning Extension for Operations Control Center (dynamic thresholding, anomaly detection, e...
SAP Solution Manager
SAP Intelligent Robotic Process Automation
SAP Business Technology Platform
SAP Focused Insights
SAP Cloud ALM
Intelligent Consumption of Data and Information in the Operations Control Center
The IT organization, e.g. the IT Center or Expertise, consumes data and information to govern and manage information technology. Generally, a number of source systems are available to collect data from (managed systems) and to process data into information in (managing systems, aka Operations platforms). The latter provide applications for information usage.
In the analytical context, the following challenges exist:
- Exploit your operations data to generate insights and advanced analytics,
- Orchestrate your operations platforms to support decision-making in and for IT departments and Operations Control Center,
- Unify your operations transparency to provide an IT Boardroom user experience.
The Operations Control Center needs (central) transparency to analyze and visualize IT processing in the system and solution landscape in scope.
- If SAP Solution Manager or equivalent SAP operations platforms are available, SAP Focused Insights can be used to configure and use dashboards for various stakeholders and use cases.
- If SAP Analytics Cloud or equivalent is available, SAP Focused insights can provide data for data consumers in SAP Analytics Cloud.
SAP Focused Insights offers an OData interface to publish data to and provide data in SAP Analytics Cloud. This evolves an OCC’s SAP Solution Manage/Focused Insights dashboard collection to an Intelligent OCC’s IT Boardroom experience - utilizing modern features like machine learning and predictive analytics provided by SAP Analytics Cloud.
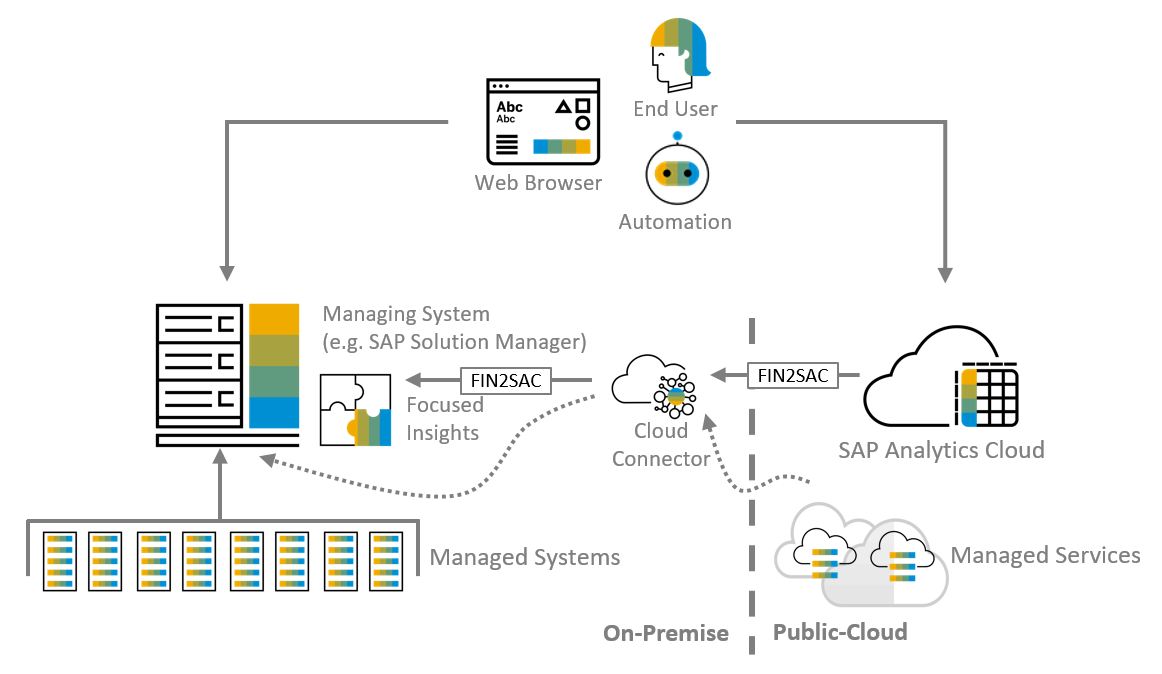
To use this interface, the content is configured in SAP Focused Insights/OCC Dashboard gadget and thereafter published to SAP Analytics Cloud. The interface FINS2SAC provides different collections usable by SAP Analytics Cloud visualizations and is officially available as of SAP Focused Insights ST-OST 200 SP4 for SAP Solution Manager 7.2 SP9:
- content of one or several time series configured in SAP Focused Insights OCC gadget,
- content of a table configured in SAP Focused Insights OCC gadget,
- content of one or several time series and use this content in SAC Predictive scenario.
The modeling process of unified analytics follows three phases. The (1) Exploration phase applies visual exploration to understand the characteristics of the data: accuracy, amount, completeness, correctness, currency, etc. of source data. The (2) Combination phase collects and integrates data from multiple sources and consolidates them, providing users with a unified view. The (3) Analysis phase discovers useful information and insights, supporting conclusion and decision-making.
Example of Intelligent Consumption in and with SAP Analytics Cloud
In the example below, SAP Focused Insights has been used to create an OCC gadget. This gadget is now published to SAP Analytics Cloud.
SAP Focused Insights OCC Gadget:

After configuration of system connection and data source as well as modeling in SAP Analytics Cloud, the data from SAP Focused Insights can be used in advanced visualizations, analytics, prediction.
SAP Analytics Cloud Chart:

Further Use Cases in the Context of Operations Control Center
Operations Control Centers have specific requirements which can be implemented with a state-of-the-art data analytical and information visualization platform. A few challenges, presented as pain points and corresponding benefit cases, may serve as examples.
Pain Point Scattered Monitoring/Decentral Alerting
Different applications and "inboxes" for monitoring and alerting different aspects of your system and solution landscape make a central event management process difficult. This is true even if SAP Solution Manager is used for application operations monitoring and alerting as well as business process operations monitoring and alerting – as there are multiple monitoring applications two alert inboxes. For SAP Solution Manager, SAP Focused Insights provides a workaround which does not require SAP Analytics Cloud.
In SAP Focused Insights, configure your dashboard view(s) outlining the unified metric/alert hierarchy according to your requirements. Using the Operations type dashboard model, create a hierarchy of monitored objects. For example, organize your systems (SIDs), thereunder monitoring areas (level 1).

The specific metric data and alert information is aggregated under monitoring areas (level 2). In the example below, PH1’s S/4HANA ABAP Exceptions monitored object aggregates several metrics and alerts (level 3). Metric Number of ABAP System log Errors allows a drill-down into metric instances (in this case for several instances or the system), to visualize latest rated value for each metric/measure (level 4). Alert qRFC Errors allows a jump-in to the Alert Inbox, to process the latest alert instances/occurrences (level 4).

Pain Point Multiple Data Sources and Various Analytical Applications
Different applications for analytics and reporting make a unified continuous improvement process difficult. Understanding source data is supported by data identification, data visualization, and data validation features in SAP Analytic Cloud. The exploration phase includes the selection of scenarios and data from source systems, for example system monitoring. Data from multiple sources is combined, the corresponding data collection is automated, analytics models are created, i.e. dimensions/characteristics and key figures/measures.
In the example below, SAP Analytics Cloud collects and channels data for system utilization from different managing systems. Geo map, bar chart, heat map, line chart visualizations are used to create the IT boardroom experience. Each view offers drill-down for detailed analyses.

Pain Point Historical versus Predictive Visualization and other Advanced Capabilities
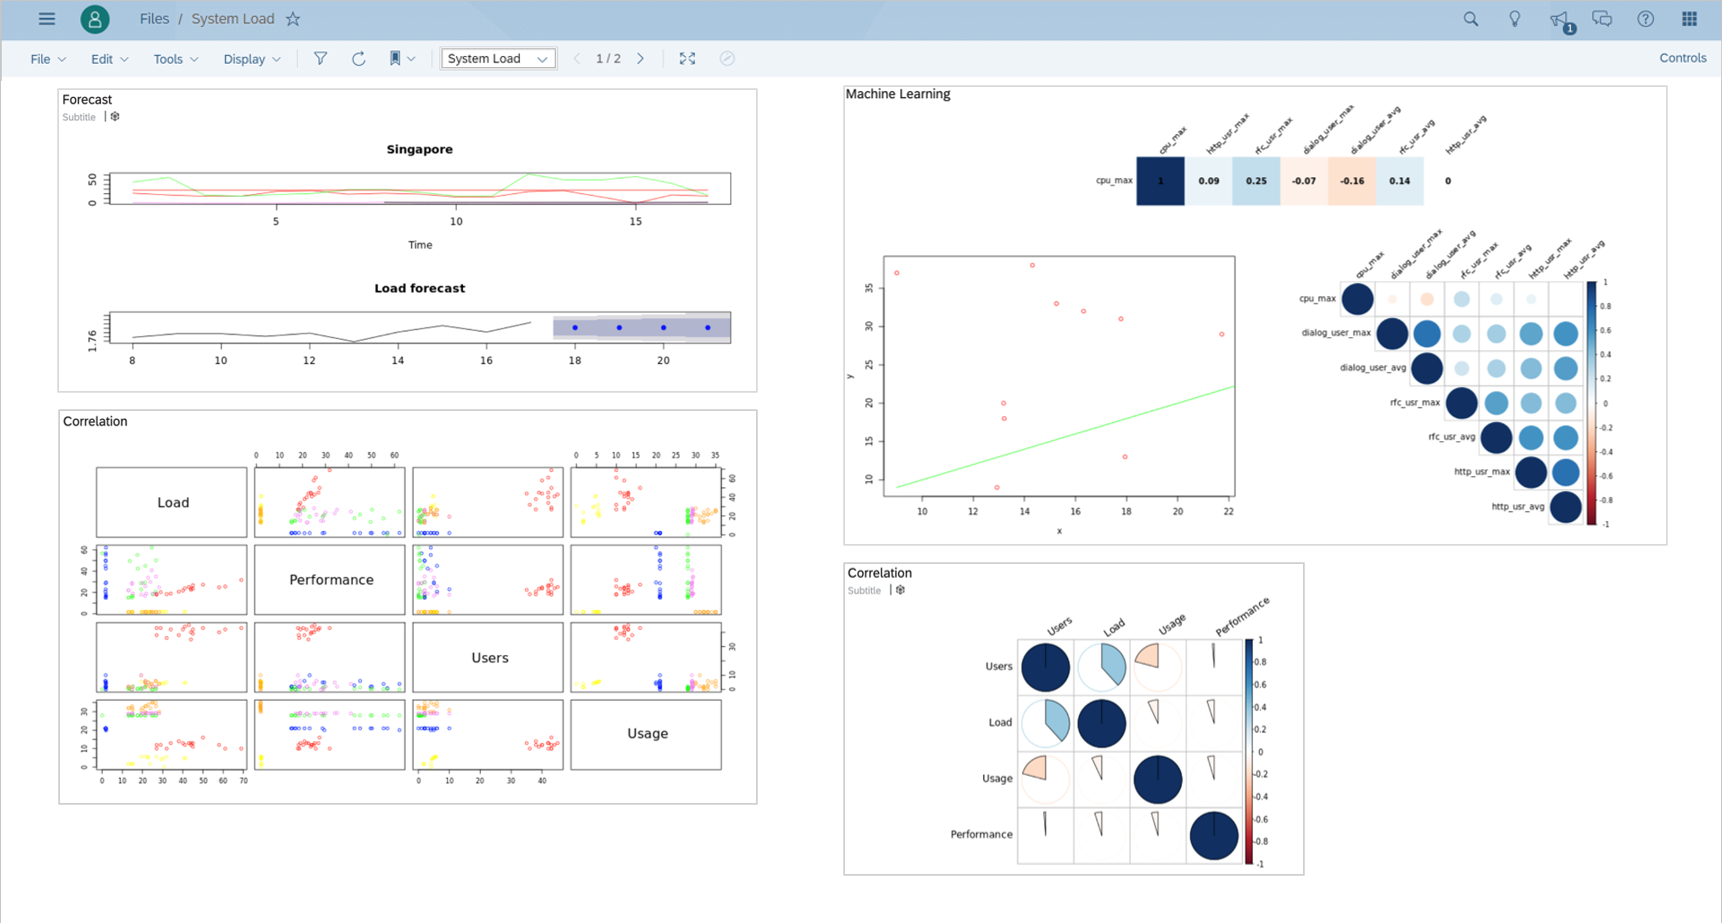
Different applications for analytics and reporting makes a unified continuous improvement process difficult. Discovering useful information, informing conclusion, and supporting decision-making in and for IT operations is enabled by reports and dashboards using advanced features of SAP Analytics Cloud.
- Design, visualize, and create your data with dynamic visual stories,
- Anticipate issues and forecast future with predictive analytics,
- Find answers by collaboration and discussion with conversational artificial intelligence and natural language technology,
- Prepare data and prepare decisions with machine learning and simulation,
- Evaluate and predict outcomes with next level business intelligence and augmented analytics.
In the example below, SAP Analytics Cloud offers forecast of system utilization based on past data and machine learning/predictive models. Moreover, correlation analysis identifies system utilization metrics/key figures which show a relationship between them. These metrics/key figures can in turn be used to design and configure a more intelligent alerting in the Operations Control Center’s Event Management process.
In combination with modern business process documentation and monitoring (e.g. Simplified Business Process Monitoring by SAP Solution Manager) and state-of-the-art experience management (e.g. XM by Qualtrics), SAP Analytics Cloud or equivalent analytical application platforms offer a unified user experience, even central user interface, for seamless consumption and combined usage of IT operations data and information. Its user experience offers interaction with other operators and operobots to get faster insights for better decisions.
In the next articles of this series, the author will put Business Process Documentation and Monitoring and further examples of smart information usage into context of the Operations Control Center.
Further reading
Aspects and Perspectives of the Intelligent Operations Control Center
Intelligent Operations Control Center - Topics and Examples Part I
Intelligent Operations Control Center - Topics and Examples Part II
Machine Learning Extension for Operations Control Center (dynamic thresholding, anomaly detection, e...
SAP Solution Manager
SAP Intelligent Robotic Process Automation
SAP Business Technology Platform
SAP Focused Insights
SAP Cloud ALM
Labels:
You must be a registered user to add a comment. If you've already registered, sign in. Otherwise, register and sign in.
Labels in this area
-
ABAP CDS Views - CDC (Change Data Capture)
2 -
AI
1 -
Analyze Workload Data
1 -
BTP
1 -
Business and IT Integration
2 -
Business application stu
1 -
Business Technology Platform
1 -
Business Trends
1,658 -
Business Trends
93 -
CAP
1 -
cf
1 -
Cloud Foundry
1 -
Confluent
1 -
Customer COE Basics and Fundamentals
1 -
Customer COE Latest and Greatest
3 -
Customer Data Browser app
1 -
Data Analysis Tool
1 -
data migration
1 -
data transfer
1 -
Datasphere
2 -
Event Information
1,400 -
Event Information
66 -
Expert
1 -
Expert Insights
177 -
Expert Insights
299 -
General
1 -
Google cloud
1 -
Google Next'24
1 -
Kafka
1 -
Life at SAP
780 -
Life at SAP
13 -
Migrate your Data App
1 -
MTA
1 -
Network Performance Analysis
1 -
NodeJS
1 -
PDF
1 -
POC
1 -
Product Updates
4,577 -
Product Updates
345 -
Replication Flow
1 -
RisewithSAP
1 -
SAP BTP
1 -
SAP BTP Cloud Foundry
1 -
SAP Cloud ALM
1 -
SAP Cloud Application Programming Model
1 -
SAP Datasphere
2 -
SAP S4HANA Cloud
1 -
SAP S4HANA Migration Cockpit
1 -
Technology Updates
6,873 -
Technology Updates
427 -
Workload Fluctuations
1
Related Content
- Use CRUD Opreations with SAP Datasphere Command-Line-Interface in Technology Blogs by SAP
- SAP Build Process Automation Pre-built content for Finance Use cases in Technology Blogs by SAP
- IoT - Ultimate Data Cyber Security - with Enterprise Blockchain and SAP BTP 🚀 in Technology Blogs by Members
- Hack2Build on Business AI – Highlighted Use Cases in Technology Blogs by SAP
- Analyze Expensive ABAP Workload in the Cloud with Work Process Sampling in Technology Blogs by SAP
Top kudoed authors
| User | Count |
|---|---|
| 41 | |
| 25 | |
| 17 | |
| 14 | |
| 9 | |
| 7 | |
| 6 | |
| 6 | |
| 6 | |
| 6 |