This is a Proof of Concept in customer system for embedded analytics, especially embedded SAP Analytics Cloud. S/4 HANA Cloud Embedded SAP Analytics Cloud can enhance the analysis function of the current system and can better help customers analyze business related data. In this blog post, the successful PoC of Embedded SAP ANALYTICS CLOUD on
Sales Order Fulfillment Analysis will be shared to readers to show its powerful functions and to introduce the key steps to implement it in detail.
What’s customer’s request?
The customer needs to obtain detailed analytical perspective of for
Sales Order Fulfillment Analysis. According to the customer’s need, schedule line item information(such as confirmed date, product, unit, quantity, etc.)and outbound delivery item information(such as actual GI date, delivered quantity, unit, etc.)should be consolidated into one model. The requirement is more complicated than standard report offered by SAP because schedule line item information and outbound delivery item information are delivered in difference CDS Views. There is a gap between the SAP ANALYTICS CLOUD content and customer requirements.
Therefore, embedded SAP ANALYTICS CLOUD has been introduced to the customer to customize the
Sales Order Fulfillment Analysis which can provide the information that the customer wants in one table.
The following table illustrates the basic expectation of the final output statement for Sales Order Fulfillment Analysis:

Dashboard
How to solve the problem?
There are four main steps to implement Embedded SAP Analytics Cloud: creating Custom CDS View, creating Custom Analytical Query, creating Story and creating an Application. The specific steps will be described in detail below. To protect customer sensitive data, some of the screenshots come from dummy test system.
- Creating Custom CDS Views
In this story, 2 CDS views need to be created. The first is YY1_OutboundDItem, which is created based on I_OutboundDeliveryItem to retrieve some important fields from outbound delivery item, such as actual GI date, delivered quantity, etc.
Navigate to Custom CDS View APP, create a new CDS view, fill the name and select “Analytical dimension” for the scenario. Add I_OutboundDeliveryItem as the Primary Datasource.

Add elements and calculations(optional).

In the Maintain Elements Properties section, leave it as default, no need to change anything. Save and publish the custom CDS View.
Then create the second CDS View YY1_SDScheduleLine. The view consolidates data from schedule line item and outbound delivery item CDS view.
Select “Analytical Cube” for the scenario. Choose C_SalesDocumentSchedLineDEX as primary Data Source and add following CDS Views as associated datasource in the picture.

Add elements.
Add calculations.
Then maintain Elements Properties.
Add filter.

Save and publish the custom CDS View.
- Creating Custom Analytical Queries
Choose “Custom Analytical Queries” app from menu Query Design. Create a query and select YY1_SDSCHEDULELINE as data source. Fill the name(YY1SOFULFILLMENTQRY) and label of the query.
Select Fields according to the requirements.
Add Calculated Measure and counter if necessary.

Add filters, for example:
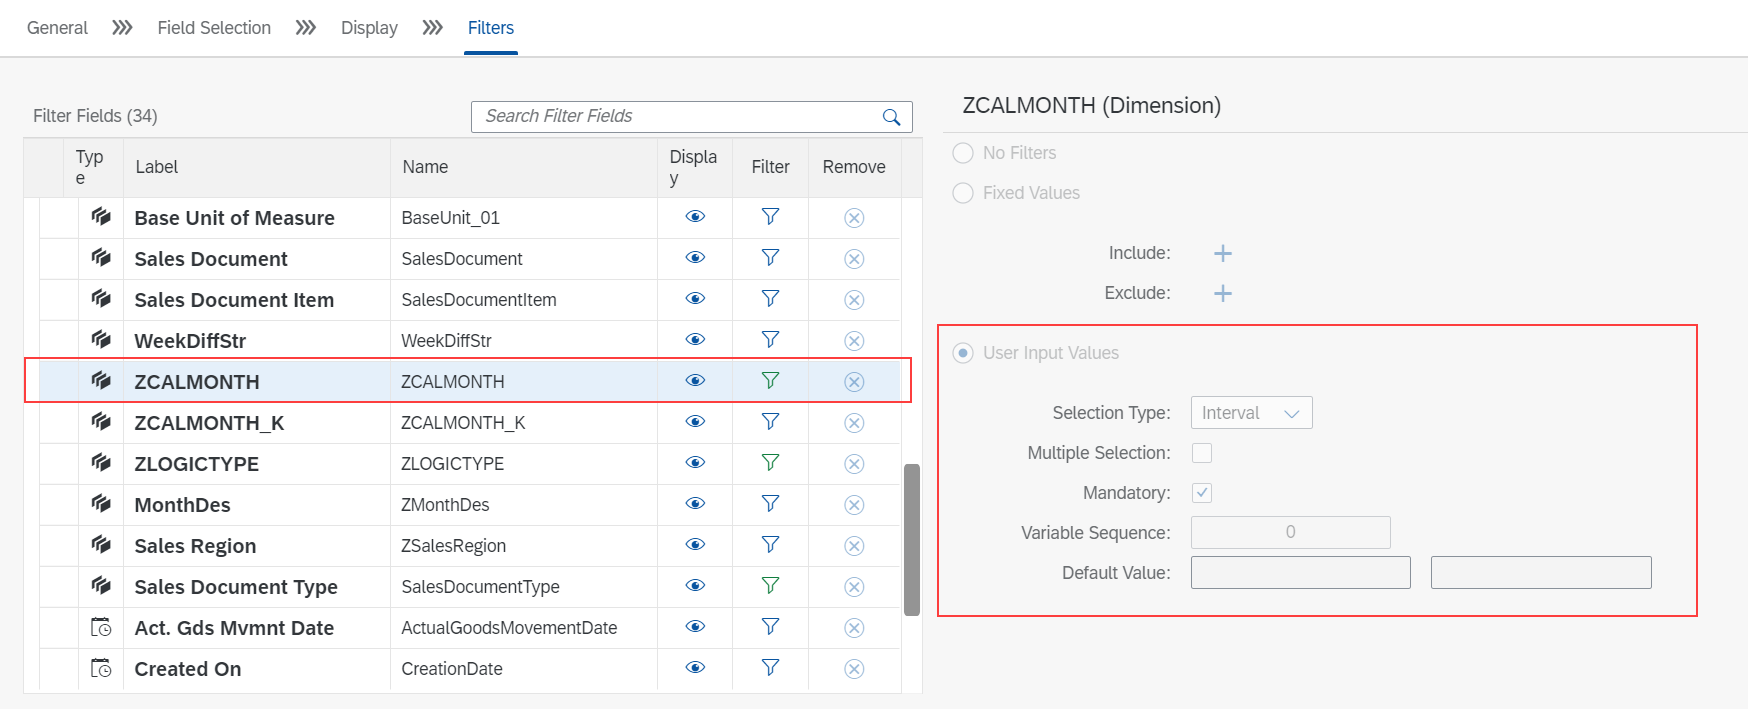
Then save and publish the query.
The Create Story page allows customers to define SAP Analytic Cloud story for a selected data source. Customers can create different visualizations to the data source. Multiple data sources can be added to the story and users can design interactive dashboards, create new pages, and add visualization such as charts, tables, and other graphics to visualize the data. The items on the page such as chart are arranged as tiles that can be moved around, resized, and styled to your liking.
Therefore, we have defined an SAP Analytic Cloud story for the new created data source to visualize the data that the customer wants to show on the page.
Firstly, navigate to KPI Design group in the Fiori Launchpad (FLP).
Choose “Stories” tab from the Manage KPIs and Reports app page and create a custom story.
The Create Story page appears. In the Definition tab, enter the title in the Header section and description in Business Information section. Then go to Configuration tab to define the story. A pre-defined template will be loaded.
Select a query from the list to build the story. Here we choose YY1_SALESFULFILLMENTANALY As Primary Data Source.

Based on the query selection, if there are mandatory parameters and filters, “Set Variables” dialog box appears wherein you must enter or choose the values to the input parameters of the selected DataSource.
A model for selected query will be generated on the fly and attached to the Story.
Per requirements, insert the summary Table.
Add calculated measures.
Insert the detail table and the chart.

Activate (Save) the story when the report is completed. Here is the screenshot of the finished story.

To create an application (aka FLP Tile) to launch the story, choose Applications > Add Tile. Choose a Tile Type format from the various options.
Fill out all the details and click on “Save and Publish”.

After successful save of the tile, it will navigate to “Custom Catalog Extension” app to publish a tile in the desired catalog.
In “Custom Catalog Extension” App, add a catalog to publish the tile. On successful publish, the tile will be available on the Fiori Launchpad. Click the tile to launch the story in the Fiori Launchpad.
Conclusion
In this blog post, we show how to create a custom SAP Analytics Cloud Story or Dashboard via S/4 HANA Cloud and embed it in S/4 HANA Cloud Fiori Launchpad. The Sales Order Fulfillment Analysis can provide all the information the customer required, which fully meets their business needs. By using the S/4 HANA Cloud embedded SAP Analytics Cloud, it becomes efficient to help customers solve problems with its powerful function. In the future, we will continue to share more successful stories of embedded analytics to readers.
For more information on SAP S/4 HANA Cloud embedded analytics with SAP Analytics Cloud, check out the following links:
- Customer use case of Embedded SAC: how to create custom SAC story and the dashboard in S/4 HANA Cloud: click here
- A Customer Use Case of Embedded Analytics in S/4HANA Cloud – Extend the Possibility:click here
- Customer use case of Embedded SAC on Material Stock Analysis: click here
- Customer use case of Embedded SAC on Inventory Aging Report: click here
- Customer use case of Embedded SAC on Inventory Aging Report (Enhanced): click here
- Customer use case of Embedded SAC on Sales Gross Profit Analysis: click here
- Customer use case of Embedded SAC on Goods Movement Analysis: click here
- Customer Use Case of Embedded SAP Analytics Cloud on Outbound Delivery and Billing Overview: click here
