
- SAP Community
- Products and Technology
- Technology
- Technology Blogs by SAP
- A Hitchhiker’s Guide to SAP Landscape Management C...
Technology Blogs by SAP
Learn how to extend and personalize SAP applications. Follow the SAP technology blog for insights into SAP BTP, ABAP, SAP Analytics Cloud, SAP HANA, and more.
Turn on suggestions
Auto-suggest helps you quickly narrow down your search results by suggesting possible matches as you type.
Showing results for
Employee
Options
- Subscribe to RSS Feed
- Mark as New
- Mark as Read
- Bookmark
- Subscribe
- Printer Friendly Page
- Report Inappropriate Content
04-16-2021
2:12 PM
In this series of blog posts, I’d like to introduce the capabilities of SAP Landscape Management Cloud. Each blog post will focus on a specific topic and will include a video to explain the scenario.
You can find a list of all topics covered in our overview post.
This blog post covers the analytics functionality within SAP Landscape Management Cloud. This functionality provides an SAP system–centric view on your infrastructure-as-a-service (IaaS) costing data.
SAP Landscape Management Cloud offers a rich set of analytics capabilities. These offer an insight into your IaaS costs (virtual machines and assigned storage), with an SAP system–centric view across your entire landscape running on public cloud providers.
The analytics capabilities are organised into different pages to provide different views of cloud spending for your landscape. Each page allows you to filter results and charts that show spending over time. You can hover over different parts of the visualisation (for example, a bar in a bar chart or a cost data point in a spending line chart) to gain additional information.
Below, you can find information about the analytics capabilities on each page:
The spending overview page provides a generic overview of the costs of your SAP systems. One of the charts you can find on this page is the spending trend chart shown at Figure 1.
This chart shows the trend of your IaaS costs – how they have gone up or down in the last few days or weeks.
You can also find graphs to analyze spending. You can filter by system, cloud region, system group (for example, production, quality, or development), pattern (as defined in SAP Landscape Management Cloud), and system instance type. By default, cloud spending is sorted from highest to lowest.
Hovering over the system bar, as shown in Figure 2, shows metadata such as the cloud region in which the system is deployed.
The region view page allows you, amongst others, to see each cloud region’s spending (Figure 3) and the systems deployed in each cloud region (Figure 4). You can drill up to get the comparison at higher aggregation.
The system view page shows how IaaS costs are distributed between SAP systems and their instances. You see each instance’s spending grouped by system ID (Figure 5).
When you hover over a system instance bar, you see metadata such as the cloud provider instance type for the system instance (Figure 6).
Additionally, you can find a system’s spending for each day and the pattern applied to each system on that day (Figure 7).
To get even more details, you can also analyze spending for the system instance over time (Figure 8).
On this page, you can compare actual IaaS costs with estimates provided by SAP Landscape Management Cloud.
Actual cloud spending is calculated based on the actual usage. Estimated spending is calculated based on the pattern defined in SAP Landscape Management Cloud.
You can analyze differences in estimated and actual spending for specific systems (Figure 9). You can also find out on which days there was a spend difference (Figure 10).
If the difference is large, it may be an indication that the system was not running according to the defined pattern. You can use this insight and identify the root cause. For example, you may discover that the system was running outside of the defined pattern for additional testing but was left running longer than expected, even after the testing was complete.
This view provides insights into how costs are distributed by SAP instance type and group, and the spend distribution.
You see the spending comparison by system instance type, then by group within each system instance type.
Figure 11 shows that sandbox group spending for SAP HANA is more than twice the quality group spending for SAP HANA. If this is an anomaly, you can take proper action based on this insight.
Figure 12 shows the distribution of your system instance’s spending data. Each system instance’s daily spend is one distribution value in the distribution chart. The data is distributed over multiple spending ranges as shown on the x-axis. This chart provides additional insight if there is an anomaly in the spending. For instance, you may expect the spend by system instance and by day to be less than US$70.00. However, you see that there are two distribution values that fall within the range of $87.54 and $97.18.
Summary
In summary, the analytics capabilities in SAP Landscape Management Cloud give insight into your IaaS costs with an SAP system–centric view across your entire landscape. You gain transparency of your cloud spending, are able to spot anomalies, and can therefore take appropriate actions. These capabilities help you manage your IaaS costs as part of your overall total cost of ownership.
If you would like to get notified about upcoming blog posts as well as further parts of this series, please follow the tag SAP Landscape Management Cloud and / or sebastian.stoschek2 and ensure to activate your #communications.
You will also find each post of this series collected in this link, once each post is published.
In case of questions regarding SAP Landscape Management Cloud you can post them either in our Questions and Answers section or right below this blog post.
Additional links
Community Page
Questions and Answers about SAP Landscape Management Cloud
Product video
Product page
SAP Help Portal – SAP Landscape Management Cloud
You can find a list of all topics covered in our overview post.
This blog post covers the analytics functionality within SAP Landscape Management Cloud. This functionality provides an SAP system–centric view on your infrastructure-as-a-service (IaaS) costing data.
Analyze IaaS costs of SAP systems in SAP Landscape Management Cloud
SAP Landscape Management Cloud offers a rich set of analytics capabilities. These offer an insight into your IaaS costs (virtual machines and assigned storage), with an SAP system–centric view across your entire landscape running on public cloud providers.
The analytics capabilities are organised into different pages to provide different views of cloud spending for your landscape. Each page allows you to filter results and charts that show spending over time. You can hover over different parts of the visualisation (for example, a bar in a bar chart or a cost data point in a spending line chart) to gain additional information.
Below, you can find information about the analytics capabilities on each page:
Spending overview
The spending overview page provides a generic overview of the costs of your SAP systems. One of the charts you can find on this page is the spending trend chart shown at Figure 1.

Figure 1: Spending Trend Chart
This chart shows the trend of your IaaS costs – how they have gone up or down in the last few days or weeks.
You can also find graphs to analyze spending. You can filter by system, cloud region, system group (for example, production, quality, or development), pattern (as defined in SAP Landscape Management Cloud), and system instance type. By default, cloud spending is sorted from highest to lowest.
Hovering over the system bar, as shown in Figure 2, shows metadata such as the cloud region in which the system is deployed.
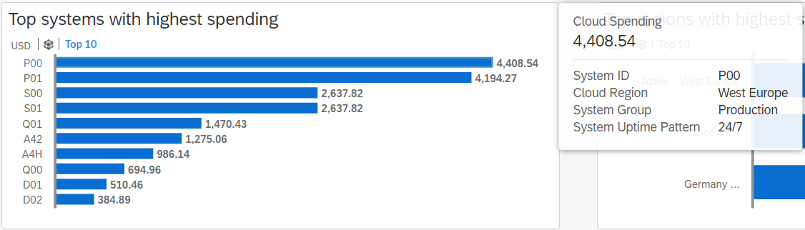
Figure 2: “Top Systems with the Highest Spending” Chart, Including Metadata
Region view
The region view page allows you, amongst others, to see each cloud region’s spending (Figure 3) and the systems deployed in each cloud region (Figure 4). You can drill up to get the comparison at higher aggregation.

Figure 3: Cloud Spending by Region

Figure 4: Spending of Systems by Region
System view
The system view page shows how IaaS costs are distributed between SAP systems and their instances. You see each instance’s spending grouped by system ID (Figure 5).

Figure 5: Spending per System Instance
When you hover over a system instance bar, you see metadata such as the cloud provider instance type for the system instance (Figure 6).

Figure 6: Metadata When Hovering Over a Bar
Additionally, you can find a system’s spending for each day and the pattern applied to each system on that day (Figure 7).

Figure 7: System Spending Over Time
To get even more details, you can also analyze spending for the system instance over time (Figure 8).

Figure 8: System Instance Spending Over Time
“Actual vs. estimated” view
On this page, you can compare actual IaaS costs with estimates provided by SAP Landscape Management Cloud.
Actual cloud spending is calculated based on the actual usage. Estimated spending is calculated based on the pattern defined in SAP Landscape Management Cloud.
You can analyze differences in estimated and actual spending for specific systems (Figure 9). You can also find out on which days there was a spend difference (Figure 10).

Figure 9: Difference in Spend

Figure 10: Days When There is a Spend Difference
If the difference is large, it may be an indication that the system was not running according to the defined pattern. You can use this insight and identify the root cause. For example, you may discover that the system was running outside of the defined pattern for additional testing but was left running longer than expected, even after the testing was complete.
Cost distribution
This view provides insights into how costs are distributed by SAP instance type and group, and the spend distribution.
You see the spending comparison by system instance type, then by group within each system instance type.
Figure 11 shows that sandbox group spending for SAP HANA is more than twice the quality group spending for SAP HANA. If this is an anomaly, you can take proper action based on this insight.

Figure 11: Spending by System Instance Type and Group
Figure 12 shows the distribution of your system instance’s spending data. Each system instance’s daily spend is one distribution value in the distribution chart. The data is distributed over multiple spending ranges as shown on the x-axis. This chart provides additional insight if there is an anomaly in the spending. For instance, you may expect the spend by system instance and by day to be less than US$70.00. However, you see that there are two distribution values that fall within the range of $87.54 and $97.18.

Figure 12: Spend Distribution
Summary
In summary, the analytics capabilities in SAP Landscape Management Cloud give insight into your IaaS costs with an SAP system–centric view across your entire landscape. You gain transparency of your cloud spending, are able to spot anomalies, and can therefore take appropriate actions. These capabilities help you manage your IaaS costs as part of your overall total cost of ownership.
If you would like to get notified about upcoming blog posts as well as further parts of this series, please follow the tag SAP Landscape Management Cloud and / or sebastian.stoschek2 and ensure to activate your #communications.
You will also find each post of this series collected in this link, once each post is published.
In case of questions regarding SAP Landscape Management Cloud you can post them either in our Questions and Answers section or right below this blog post.
Additional links
Community Page
Questions and Answers about SAP Landscape Management Cloud
Product video
Product page
SAP Help Portal – SAP Landscape Management Cloud
- SAP Managed Tags:
- SAP Landscape Management,
- SAP Landscape Management Cloud
Labels:
You must be a registered user to add a comment. If you've already registered, sign in. Otherwise, register and sign in.
Labels in this area
-
ABAP CDS Views - CDC (Change Data Capture)
2 -
AI
1 -
Analyze Workload Data
1 -
BTP
1 -
Business and IT Integration
2 -
Business application stu
1 -
Business Technology Platform
1 -
Business Trends
1,658 -
Business Trends
91 -
CAP
1 -
cf
1 -
Cloud Foundry
1 -
Confluent
1 -
Customer COE Basics and Fundamentals
1 -
Customer COE Latest and Greatest
3 -
Customer Data Browser app
1 -
Data Analysis Tool
1 -
data migration
1 -
data transfer
1 -
Datasphere
2 -
Event Information
1,400 -
Event Information
66 -
Expert
1 -
Expert Insights
177 -
Expert Insights
293 -
General
1 -
Google cloud
1 -
Google Next'24
1 -
Kafka
1 -
Life at SAP
780 -
Life at SAP
13 -
Migrate your Data App
1 -
MTA
1 -
Network Performance Analysis
1 -
NodeJS
1 -
PDF
1 -
POC
1 -
Product Updates
4,577 -
Product Updates
340 -
Replication Flow
1 -
RisewithSAP
1 -
SAP BTP
1 -
SAP BTP Cloud Foundry
1 -
SAP Cloud ALM
1 -
SAP Cloud Application Programming Model
1 -
SAP Datasphere
2 -
SAP S4HANA Cloud
1 -
SAP S4HANA Migration Cockpit
1 -
Technology Updates
6,873 -
Technology Updates
419 -
Workload Fluctuations
1
Related Content
- Cloud Transport Management configuration between spaces in Technology Q&A
- Onboarding Users in SAP Quality Issue Resolution in Technology Blogs by SAP
- How to add Create Git-enabled change link in custom Business Role? in Technology Q&A
- How to host static webpages through SAP CPI-Iflow in Technology Blogs by Members
- BRF+ outbound delivery in Technology Q&A
Top kudoed authors
| User | Count |
|---|---|
| 35 | |
| 25 | |
| 14 | |
| 7 | |
| 7 | |
| 6 | |
| 6 | |
| 5 | |
| 4 | |
| 4 |