
- SAP Community
- Products and Technology
- Technology
- Technology Blogs by Members
- Monitoring of ABAP System on AWS Using CloudWatch ...
Technology Blogs by Members
Explore a vibrant mix of technical expertise, industry insights, and tech buzz in member blogs covering SAP products, technology, and events. Get in the mix!
Turn on suggestions
Auto-suggest helps you quickly narrow down your search results by suggesting possible matches as you type.
Showing results for
jaskisin
Participant
Options
- Subscribe to RSS Feed
- Mark as New
- Mark as Read
- Bookmark
- Subscribe
- Printer Friendly Page
- Report Inappropriate Content
04-11-2021
9:00 AM
This is in continuation of my previous blog post Monitoring of ABAP System on AWS Using CloudWatch – Part II
As a part of post configuration, we must do the below steps for regular execution
We must enable the scheduler so that AWS Lambda function can be triggered after regular interval of time to fetch the required data for CloudWatch
To do the same, go to Amazon EventBridge → Event and click on Rules. We can find sap-monitor’s Rule already configured.
Select the Rule and then click on Enable, confirm the action to Enable the Rule
Once the Rule is enabled, then as per the schedule Lambda Function will fetch the data from SAP.
For monitoring multiple metrics at the same time, we can create and configure the our own dashboard using AWS CloudWatch.
To-do the same, go to AWS CloudWatch from AWS Console and then click on Create Dashboard
Then we need to specify the name of the Dashboard which will be created and click Create Dashboard
Dashboard has been created for Monitoring of the system.
Once the dashboard has been created then we need to add different Widgets as per the requirement. To do the same, we need to go to the newly created Dashboard and click on Add Widget
Then we need to specify the data source that will be used to create widgets which is Metrics
Then we need to select the Metric Name that needs to be displayed on the CloudWatch Dashboard and click on Create Widget
We can now see the Graphed Metrics on the Dashboard
Similarly, we can select more widgets to pin the graphical metrics on the CloudWatch Dashboard as below
We must save the dashboard so that widgets can be saved and can be utilized for quicker view.
We can also specify the settings by which a notification can be sent as per the requirement.
We can setup alarms for sending any type of notification as per the requirement, to do so we need to go to CloudWatch → Alarms and click on Create alarm
Then we need to Specify the metric and conditions to trigger the notification, for that we need to click on Select Metric
Specify the Metric for which we need to generate the Alarm and then click on Select metric
Then we need to specify the time period and statistics for which alarm needs to be set. Here we need time period of 5 mins
Then we need to specify the condition on which alarm needs to be raised by the CloudWatch. Here we have defined the threshold value to 60 and click Next
Then we need to specify the configuration actions when Alarm get a catch. Here we have specified the Amazon SNS topic
We can also specify the Auto scaling group, EC2 action any systems manager Ops Center action, if required and then click on Next
Then we need to review the specified parameter and create the alarm
Below screen will appear after successful creation of Alarm, but state will be Insufficient Data till the first recording of data
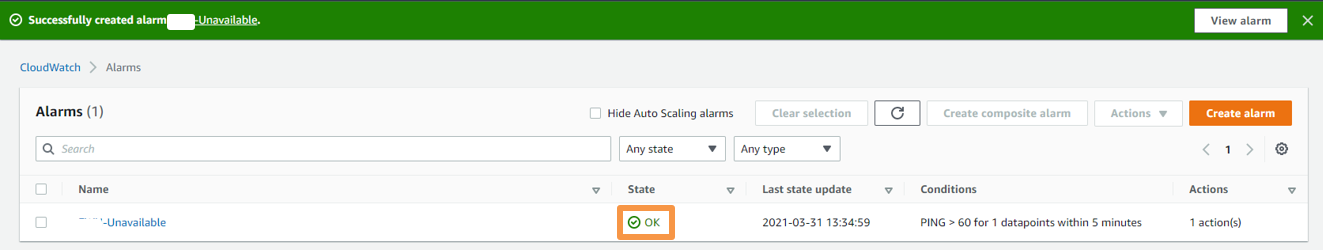
After the first recording of the statistics from the CloudWatch, the status should change to OK
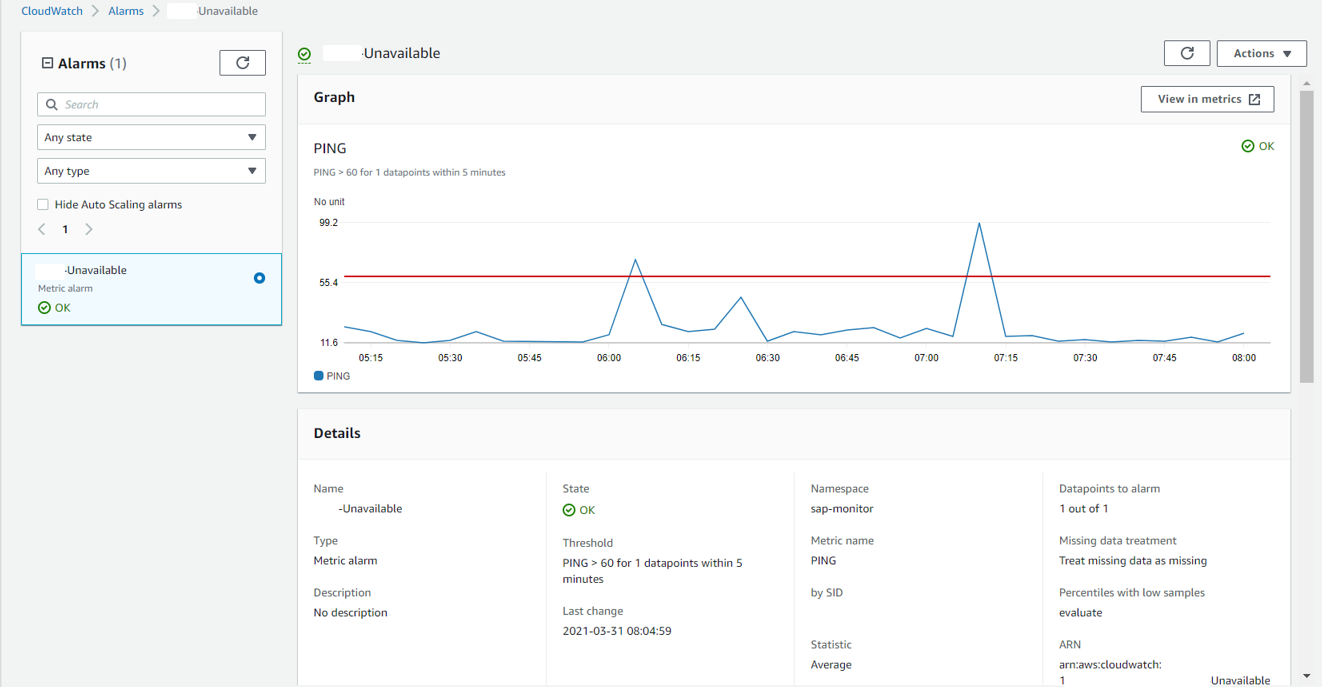
We can also see the Data collection in graphical manner for Alarm
When there is any breach in the threshold specified in the alarm settings then it gets recorded in AWS EventBridge
And information of this breach has been sent via email to the stakeholders as per the SNS configuration
For using this solution in live customer environment, we have below points which needs to be considered
From performance point of view, this solution uses two ways to connect to SAP System Regularity and collect insights: -
There no addition cost for using this service, but one need to pay for the underlining AWS services which is getting used, such as AWS Lambda, CloudWatch, AWS SNS etc. For a single SAP system with two application servers, the estimated cost is 16 USD per month per SID without considering any free tiers. These are estimated cost which is depend on various factors, please check link for calculation details
To limit the stored log data and reduce the cost in the long run, make sure to also reduce the retention period for /aws/lambda/sap-monitor-<SID> to one week. For more details on this please refer link.
A full list of currently captured metrics and their importance can be found below:
If we also like to monitor other OS-related metrics such as free hard disk space, then we can also deploy the CloudWatch Agent on top.
As the deployment triggers Cloud Formation stack internally, hence we can navigate to CloudFormation → Stacks → Events which can provide details of the steps which were carried out during the execution
We also have detailed logs which we can see from AWS Cloudwatch, for which need to navigate to proper log groups from CloudWatch
Now SAP System installed on AWS EC2 is getting monitored using AWS Services.
BEST OF LUCK!!
In this 3 parts of article, we have discussed how we can Deploy, Test, Post Configuration, Dashboard of Monitoring ABAP Systems via AWS.
THANK YOU..
6. POST-CONFIGRUATION
As a part of post configuration, we must do the below steps for regular execution
6.1 Enable Scheduler
We must enable the scheduler so that AWS Lambda function can be triggered after regular interval of time to fetch the required data for CloudWatch
To do the same, go to Amazon EventBridge → Event and click on Rules. We can find sap-monitor’s Rule already configured.

Select the Rule and then click on Enable, confirm the action to Enable the Rule

Once the Rule is enabled, then as per the schedule Lambda Function will fetch the data from SAP.
7. DASHBOARD
For monitoring multiple metrics at the same time, we can create and configure the our own dashboard using AWS CloudWatch.
7.1 Creation of Dashboard
To-do the same, go to AWS CloudWatch from AWS Console and then click on Create Dashboard

Then we need to specify the name of the Dashboard which will be created and click Create Dashboard

Dashboard has been created for Monitoring of the system.
7.2 Adding Widgets
Once the dashboard has been created then we need to add different Widgets as per the requirement. To do the same, we need to go to the newly created Dashboard and click on Add Widget

Then we need to specify the data source that will be used to create widgets which is Metrics

Then we need to select the Metric Name that needs to be displayed on the CloudWatch Dashboard and click on Create Widget
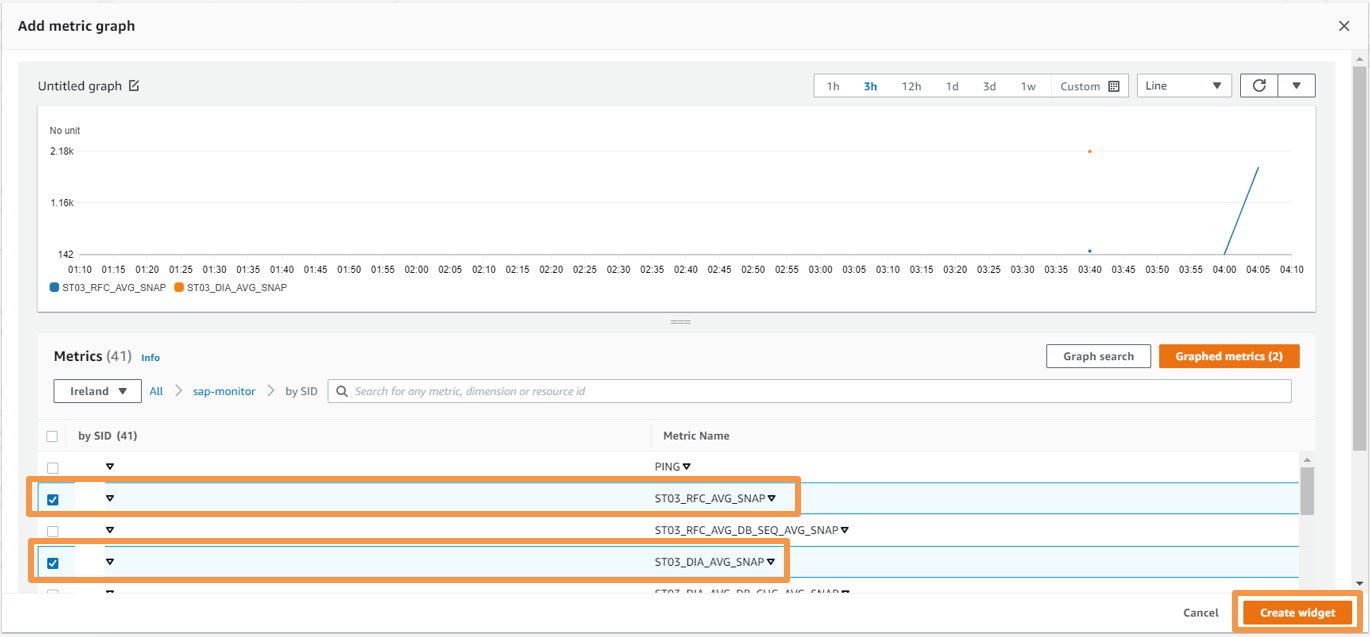
We can now see the Graphed Metrics on the Dashboard
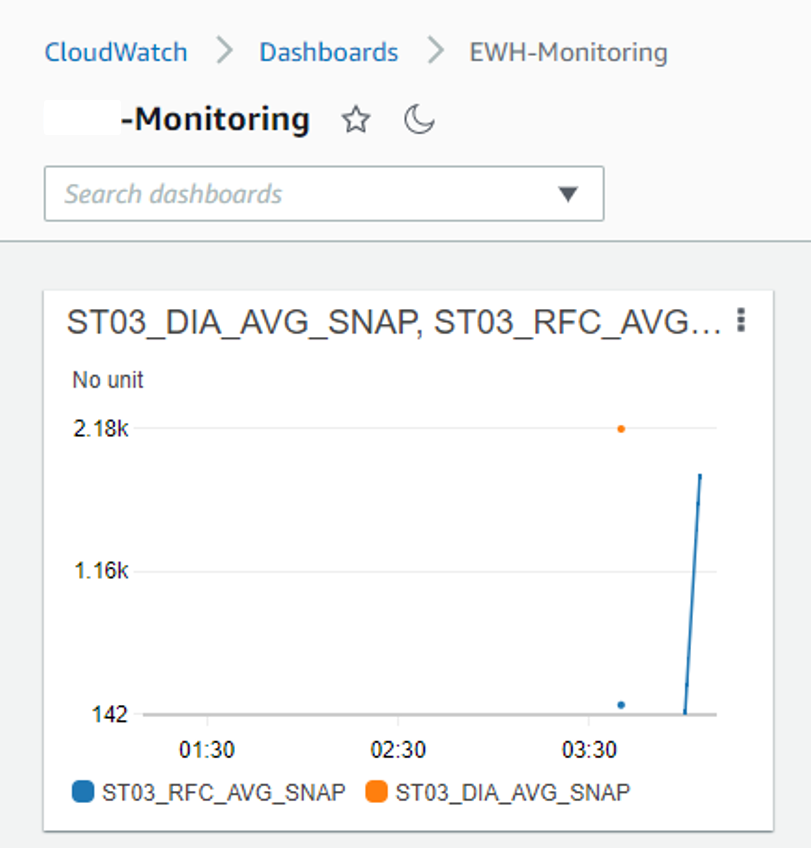
Similarly, we can select more widgets to pin the graphical metrics on the CloudWatch Dashboard as below

We must save the dashboard so that widgets can be saved and can be utilized for quicker view.
8. NOTIFICATION
We can also specify the settings by which a notification can be sent as per the requirement.
8.1 Setting Up Alarms
We can setup alarms for sending any type of notification as per the requirement, to do so we need to go to CloudWatch → Alarms and click on Create alarm

Then we need to Specify the metric and conditions to trigger the notification, for that we need to click on Select Metric

Specify the Metric for which we need to generate the Alarm and then click on Select metric

Then we need to specify the time period and statistics for which alarm needs to be set. Here we need time period of 5 mins

Then we need to specify the condition on which alarm needs to be raised by the CloudWatch. Here we have defined the threshold value to 60 and click Next

Then we need to specify the configuration actions when Alarm get a catch. Here we have specified the Amazon SNS topic

We can also specify the Auto scaling group, EC2 action any systems manager Ops Center action, if required and then click on Next

Then we need to specify the name and description of the Alarm and click Next

Then we need to review the specified parameter and create the alarm


Below screen will appear after successful creation of Alarm, but state will be Insufficient Data till the first recording of data

After the first recording of the statistics from the CloudWatch, the status should change to OK
We can also see the Data collection in graphical manner for Alarm
When there is any breach in the threshold specified in the alarm settings then it gets recorded in AWS EventBridge
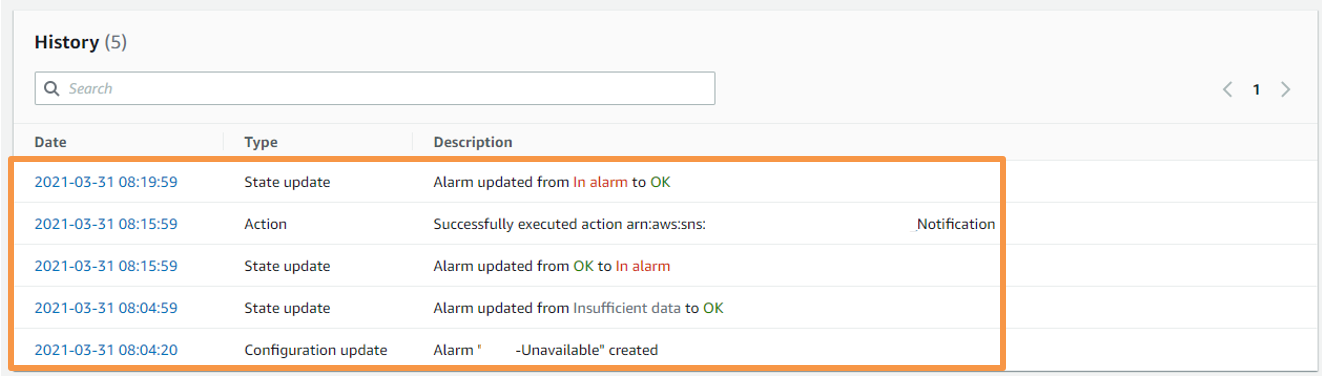
And information of this breach has been sent via email to the stakeholders as per the SNS configuration

9. CONSIDERATIONS
For using this solution in live customer environment, we have below points which needs to be considered
9.1 Performance
From performance point of view, this solution uses two ways to connect to SAP System Regularity and collect insights: -
- One Minute interval for /SDF/MON data with a 30 second granularity which is scheduled daily on demand. According to SAP, CPU and memory overhead on the SAP system caused by /SDF/SMON is negligible and can safely be run in production. Link can be referred for further details
- Five Minute interval for ST03 “Last Minute Load”. SAP statistical records (STAD) and related aggregation (ST03) are usually enabled by default, if it’s not enabled then need to check SAP note 2369736. They are the foundation of any SAP monitoring, especially for SAP GoingLive Check, SAP EarlyWatch Alert and SAP Solution Manager.
9.2 Cost
There no addition cost for using this service, but one need to pay for the underlining AWS services which is getting used, such as AWS Lambda, CloudWatch, AWS SNS etc. For a single SAP system with two application servers, the estimated cost is 16 USD per month per SID without considering any free tiers. These are estimated cost which is depend on various factors, please check link for calculation details
To limit the stored log data and reduce the cost in the long run, make sure to also reduce the retention period for /aws/lambda/sap-monitor-<SID> to one week. For more details on this please refer link.
9.3 Capture Metric
A full list of currently captured metrics and their importance can be found below:
Generic (1 - per SID):

"PING" = SAP Monitor RFC Execution Time (/SDF/SMON) "TOTAL_APP_SERVERS" = Number of active SAP Application Servers


/SDF/SMON (14 - per Instance), granularity 1 min:

"ACT_WPS" = Number of Active Work Processes

"ACT_DIA" = Number of Active Dialog Work Processes

"TRFC_FREE" = Number of Available Work Processes for RFCs

"SESSIONS" = Number of Sessions

"USERS" = Number of Logins

"UPDQ" = Update Queue Length

"ENQQ" = Enqueue Queue Length

"DIAQ" = Dialog Queue Length

"PRIVWPNO" = Number of Work Processes in Priv Modes

"DIAAVG20" = Average Load last 20s

"DIAAVG60" = Average Load last 60s

"FREE_MEM_PERC" = Free Memory in % of RAM

"USR_TOTAL" = CPU Utilization (User) in %

"SYS_TOTAL" = CPU Utilization (System) in %


SWNC_GET_WORKLOAD_SNAPSHOT = st03 Last Minute Load (12 - per SID), granularity 5 min


Currently enabled for Tasktypes DIA & RFC:


"ST03_AVG_SNAP" = Average Response Time per Step in ms (ideally < 1s)

"ST03CPU_TIME_PERC_SNAP" = Average CPU Time in % as part of average response time (ideally ca. 40%)

"ST03DB_TIME_PERC_SNAP" = Average DB Time in % as part of average response time (ideally ca. 40%)

"ST03AVG_DB_DIR_SNAP" = Average Database Request Time per Direct reads in ms (ideally max. 10ms)

"ST03AVG_DB_SEQ_AVG_SNAP" = Average Database Request Time per Sequential reads in ms (ideally max. 10ms)

"ST03_AVG_DB_CHG_AVG_SNAP" = Average Database Request Time per Changes in ms (ideally max. 10ms)
If we also like to monitor other OS-related metrics such as free hard disk space, then we can also deploy the CloudWatch Agent on top.
10. LOGS
10.1 CloudFormation
As the deployment triggers Cloud Formation stack internally, hence we can navigate to CloudFormation → Stacks → Events which can provide details of the steps which were carried out during the execution

10.2 CloudWatch
We also have detailed logs which we can see from AWS Cloudwatch, for which need to navigate to proper log groups from CloudWatch

Now SAP System installed on AWS EC2 is getting monitored using AWS Services.
BEST OF LUCK!!
11. CONCLUSION:
In this 3 parts of article, we have discussed how we can Deploy, Test, Post Configuration, Dashboard of Monitoring ABAP Systems via AWS.
THANK YOU..
- SAP Managed Tags:
- NW ABAP Monitoring Tools,
- Cloud
You must be a registered user to add a comment. If you've already registered, sign in. Otherwise, register and sign in.
Labels in this area
-
"automatische backups"
1 -
"regelmäßige sicherung"
1 -
"TypeScript" "Development" "FeedBack"
1 -
505 Technology Updates 53
1 -
ABAP
14 -
ABAP API
1 -
ABAP CDS Views
2 -
ABAP CDS Views - BW Extraction
1 -
ABAP CDS Views - CDC (Change Data Capture)
1 -
ABAP class
2 -
ABAP Cloud
2 -
ABAP Development
5 -
ABAP in Eclipse
1 -
ABAP Platform Trial
1 -
ABAP Programming
2 -
abap technical
1 -
absl
1 -
access data from SAP Datasphere directly from Snowflake
1 -
Access data from SAP datasphere to Qliksense
1 -
Accrual
1 -
action
1 -
adapter modules
1 -
Addon
1 -
Adobe Document Services
1 -
ADS
1 -
ADS Config
1 -
ADS with ABAP
1 -
ADS with Java
1 -
ADT
2 -
Advance Shipping and Receiving
1 -
Advanced Event Mesh
3 -
AEM
1 -
AI
7 -
AI Launchpad
1 -
AI Projects
1 -
AIML
9 -
Alert in Sap analytical cloud
1 -
Amazon S3
1 -
Analytical Dataset
1 -
Analytical Model
1 -
Analytics
1 -
Analyze Workload Data
1 -
annotations
1 -
API
1 -
API and Integration
3 -
API Call
2 -
Application Architecture
1 -
Application Development
5 -
Application Development for SAP HANA Cloud
3 -
Applications and Business Processes (AP)
1 -
Artificial Intelligence
1 -
Artificial Intelligence (AI)
4 -
Artificial Intelligence (AI) 1 Business Trends 363 Business Trends 8 Digital Transformation with Cloud ERP (DT) 1 Event Information 462 Event Information 15 Expert Insights 114 Expert Insights 76 Life at SAP 418 Life at SAP 1 Product Updates 4
1 -
Artificial Intelligence (AI) blockchain Data & Analytics
1 -
Artificial Intelligence (AI) blockchain Data & Analytics Intelligent Enterprise
1 -
Artificial Intelligence (AI) blockchain Data & Analytics Intelligent Enterprise Oil Gas IoT Exploration Production
1 -
Artificial Intelligence (AI) blockchain Data & Analytics Intelligent Enterprise sustainability responsibility esg social compliance cybersecurity risk
1 -
ASE
1 -
ASR
2 -
ASUG
1 -
Attachments
1 -
Authorisations
1 -
Automating Processes
1 -
Automation
1 -
aws
2 -
Azure
1 -
Azure AI Studio
1 -
B2B Integration
1 -
Backorder Processing
1 -
Backup
1 -
Backup and Recovery
1 -
Backup schedule
1 -
BADI_MATERIAL_CHECK error message
1 -
Bank
1 -
BAS
1 -
basis
2 -
Basis Monitoring & Tcodes with Key notes
2 -
Batch Management
1 -
BDC
1 -
Best Practice
1 -
bitcoin
1 -
Blockchain
3 -
BOP in aATP
1 -
BOP Segments
1 -
BOP Strategies
1 -
BOP Variant
1 -
BPC
1 -
BPC LIVE
1 -
BTP
11 -
BTP Destination
2 -
Business AI
1 -
Business and IT Integration
1 -
Business application stu
1 -
Business Application Studio
1 -
Business Architecture
1 -
Business Communication Services
1 -
Business Continuity
1 -
Business Data Fabric
3 -
Business Partner
12 -
Business Partner Master Data
10 -
Business Technology Platform
2 -
Business Trends
1 -
CA
1 -
calculation view
1 -
CAP
3 -
Capgemini
1 -
CAPM
1 -
Catalyst for Efficiency: Revolutionizing SAP Integration Suite with Artificial Intelligence (AI) and
1 -
CCMS
2 -
CDQ
12 -
CDS
2 -
Cental Finance
1 -
Certificates
1 -
CFL
1 -
Change Management
1 -
chatbot
1 -
chatgpt
3 -
CL_SALV_TABLE
2 -
Class Runner
1 -
Classrunner
1 -
Cloud ALM Monitoring
1 -
Cloud ALM Operations
1 -
cloud connector
1 -
Cloud Extensibility
1 -
Cloud Foundry
4 -
Cloud Integration
6 -
Cloud Platform Integration
2 -
cloudalm
1 -
communication
1 -
Compensation Information Management
1 -
Compensation Management
1 -
Compliance
1 -
Compound Employee API
1 -
Configuration
1 -
Connectors
1 -
Consolidation Extension for SAP Analytics Cloud
1 -
Controller-Service-Repository pattern
1 -
Conversion
1 -
Cosine similarity
1 -
cryptocurrency
1 -
CSI
1 -
ctms
1 -
Custom chatbot
3 -
Custom Destination Service
1 -
custom fields
1 -
Customer Experience
1 -
Customer Journey
1 -
Customizing
1 -
cyber security
2 -
Data
1 -
Data & Analytics
1 -
Data Aging
1 -
Data Analytics
2 -
Data and Analytics (DA)
1 -
Data Archiving
1 -
Data Back-up
1 -
Data Governance
5 -
Data Integration
2 -
Data Quality
12 -
Data Quality Management
12 -
Data Synchronization
1 -
data transfer
1 -
Data Unleashed
1 -
Data Value
8 -
database tables
1 -
Datasphere
2 -
datenbanksicherung
1 -
dba cockpit
1 -
dbacockpit
1 -
Debugging
2 -
Delimiting Pay Components
1 -
Delta Integrations
1 -
Destination
3 -
Destination Service
1 -
Developer extensibility
1 -
Developing with SAP Integration Suite
1 -
Devops
1 -
digital transformation
1 -
Documentation
1 -
Dot Product
1 -
DQM
1 -
dump database
1 -
dump transaction
1 -
e-Invoice
1 -
E4H Conversion
1 -
Eclipse ADT ABAP Development Tools
2 -
edoc
1 -
edocument
1 -
ELA
1 -
Embedded Consolidation
1 -
Embedding
1 -
Embeddings
1 -
Employee Central
1 -
Employee Central Payroll
1 -
Employee Central Time Off
1 -
Employee Information
1 -
Employee Rehires
1 -
Enable Now
1 -
Enable now manager
1 -
endpoint
1 -
Enhancement Request
1 -
Enterprise Architecture
1 -
ETL Business Analytics with SAP Signavio
1 -
Euclidean distance
1 -
Event Dates
1 -
Event Driven Architecture
1 -
Event Mesh
2 -
Event Reason
1 -
EventBasedIntegration
1 -
EWM
1 -
EWM Outbound configuration
1 -
EWM-TM-Integration
1 -
Existing Event Changes
1 -
Expand
1 -
Expert
2 -
Expert Insights
1 -
Fiori
14 -
Fiori Elements
2 -
Fiori SAPUI5
12 -
Flask
1 -
Full Stack
8 -
Funds Management
1 -
General
1 -
Generative AI
1 -
Getting Started
1 -
GitHub
8 -
Grants Management
1 -
groovy
1 -
GTP
1 -
HANA
5 -
HANA Cloud
2 -
Hana Cloud Database Integration
2 -
HANA DB
1 -
HANA XS Advanced
1 -
Historical Events
1 -
home labs
1 -
HowTo
1 -
HR Data Management
1 -
html5
8 -
HTML5 Application
1 -
Identity cards validation
1 -
idm
1 -
Implementation
1 -
input parameter
1 -
instant payments
1 -
Integration
3 -
Integration Advisor
1 -
Integration Architecture
1 -
Integration Center
1 -
Integration Suite
1 -
intelligent enterprise
1 -
Java
1 -
job
1 -
Job Information Changes
1 -
Job-Related Events
1 -
Job_Event_Information
1 -
joule
4 -
Journal Entries
1 -
Just Ask
1 -
Kerberos for ABAP
8 -
Kerberos for JAVA
8 -
Launch Wizard
1 -
Learning Content
2 -
Life at SAP
1 -
lightning
1 -
Linear Regression SAP HANA Cloud
1 -
local tax regulations
1 -
LP
1 -
Machine Learning
2 -
Marketing
1 -
Master Data
3 -
Master Data Management
14 -
Maxdb
2 -
MDG
1 -
MDGM
1 -
MDM
1 -
Message box.
1 -
Messages on RF Device
1 -
Microservices Architecture
1 -
Microsoft Universal Print
1 -
Middleware Solutions
1 -
Migration
5 -
ML Model Development
1 -
Modeling in SAP HANA Cloud
8 -
Monitoring
3 -
MTA
1 -
Multi-Record Scenarios
1 -
Multiple Event Triggers
1 -
Neo
1 -
New Event Creation
1 -
New Feature
1 -
Newcomer
1 -
NodeJS
2 -
ODATA
2 -
OData APIs
1 -
odatav2
1 -
ODATAV4
1 -
ODBC
1 -
ODBC Connection
1 -
Onpremise
1 -
open source
2 -
OpenAI API
1 -
Oracle
1 -
PaPM
1 -
PaPM Dynamic Data Copy through Writer function
1 -
PaPM Remote Call
1 -
PAS-C01
1 -
Pay Component Management
1 -
PGP
1 -
Pickle
1 -
PLANNING ARCHITECTURE
1 -
Popup in Sap analytical cloud
1 -
PostgrSQL
1 -
POSTMAN
1 -
Process Automation
2 -
Product Updates
4 -
PSM
1 -
Public Cloud
1 -
Python
4 -
Qlik
1 -
Qualtrics
1 -
RAP
3 -
RAP BO
2 -
Record Deletion
1 -
Recovery
1 -
recurring payments
1 -
redeply
1 -
Release
1 -
Remote Consumption Model
1 -
Replication Flows
1 -
Research
1 -
Resilience
1 -
REST
1 -
REST API
1 -
Retagging Required
1 -
Risk
1 -
Rolling Kernel Switch
1 -
route
1 -
rules
1 -
S4 HANA
1 -
S4 HANA Cloud
1 -
S4 HANA On-Premise
1 -
S4HANA
3 -
S4HANA_OP_2023
2 -
SAC
10 -
SAC PLANNING
9 -
SAP
4 -
SAP ABAP
1 -
SAP Advanced Event Mesh
1 -
SAP AI Core
8 -
SAP AI Launchpad
8 -
SAP Analytic Cloud Compass
1 -
Sap Analytical Cloud
1 -
SAP Analytics Cloud
4 -
SAP Analytics Cloud for Consolidation
2 -
SAP Analytics Cloud Story
1 -
SAP analytics clouds
1 -
SAP BAS
1 -
SAP Basis
6 -
SAP BODS
1 -
SAP BODS certification.
1 -
SAP BTP
20 -
SAP BTP Build Work Zone
2 -
SAP BTP Cloud Foundry
5 -
SAP BTP Costing
1 -
SAP BTP CTMS
1 -
SAP BTP Innovation
1 -
SAP BTP Migration Tool
1 -
SAP BTP SDK IOS
1 -
SAP Build
11 -
SAP Build App
1 -
SAP Build apps
1 -
SAP Build CodeJam
1 -
SAP Build Process Automation
3 -
SAP Build work zone
10 -
SAP Business Objects Platform
1 -
SAP Business Technology
2 -
SAP Business Technology Platform (XP)
1 -
sap bw
1 -
SAP CAP
2 -
SAP CDC
1 -
SAP CDP
1 -
SAP CDS VIEW
1 -
SAP Certification
1 -
SAP Cloud ALM
4 -
SAP Cloud Application Programming Model
1 -
SAP Cloud Integration for Data Services
1 -
SAP cloud platform
8 -
SAP Companion
1 -
SAP CPI
3 -
SAP CPI (Cloud Platform Integration)
2 -
SAP CPI Discover tab
1 -
sap credential store
1 -
SAP Customer Data Cloud
1 -
SAP Customer Data Platform
1 -
SAP Data Intelligence
1 -
SAP Data Migration in Retail Industry
1 -
SAP Data Services
1 -
SAP DATABASE
1 -
SAP Dataspher to Non SAP BI tools
1 -
SAP Datasphere
9 -
SAP DRC
1 -
SAP EWM
1 -
SAP Fiori
2 -
SAP Fiori App Embedding
1 -
Sap Fiori Extension Project Using BAS
1 -
SAP GRC
1 -
SAP HANA
1 -
SAP HCM (Human Capital Management)
1 -
SAP HR Solutions
1 -
SAP IDM
1 -
SAP Integration Suite
9 -
SAP Integrations
4 -
SAP iRPA
2 -
SAP Learning Class
1 -
SAP Learning Hub
1 -
SAP Odata
2 -
SAP on Azure
1 -
SAP PartnerEdge
1 -
sap partners
1 -
SAP Password Reset
1 -
SAP PO Migration
1 -
SAP Prepackaged Content
1 -
SAP Process Automation
2 -
SAP Process Integration
2 -
SAP Process Orchestration
1 -
SAP S4HANA
2 -
SAP S4HANA Cloud
1 -
SAP S4HANA Cloud for Finance
1 -
SAP S4HANA Cloud private edition
1 -
SAP Sandbox
1 -
SAP STMS
1 -
SAP SuccessFactors
2 -
SAP SuccessFactors HXM Core
1 -
SAP Time
1 -
SAP TM
2 -
SAP Trading Partner Management
1 -
SAP UI5
1 -
SAP Upgrade
1 -
SAP Utilities
1 -
SAP-GUI
8 -
SAP_COM_0276
1 -
SAPBTP
1 -
SAPCPI
1 -
SAPEWM
1 -
sapmentors
1 -
saponaws
2 -
SAPS4HANA
1 -
SAPUI5
4 -
schedule
1 -
Secure Login Client Setup
8 -
security
9 -
Selenium Testing
1 -
SEN
1 -
SEN Manager
1 -
service
1 -
SET_CELL_TYPE
1 -
SET_CELL_TYPE_COLUMN
1 -
SFTP scenario
2 -
Simplex
1 -
Single Sign On
8 -
Singlesource
1 -
SKLearn
1 -
soap
1 -
Software Development
1 -
SOLMAN
1 -
solman 7.2
2 -
Solution Manager
3 -
sp_dumpdb
1 -
sp_dumptrans
1 -
SQL
1 -
sql script
1 -
SSL
8 -
SSO
8 -
Substring function
1 -
SuccessFactors
1 -
SuccessFactors Time Tracking
1 -
Sybase
1 -
system copy method
1 -
System owner
1 -
Table splitting
1 -
Tax Integration
1 -
Technical article
1 -
Technical articles
1 -
Technology Updates
1 -
Technology Updates
1 -
Technology_Updates
1 -
Threats
1 -
Time Collectors
1 -
Time Off
2 -
Tips and tricks
2 -
Tools
1 -
Trainings & Certifications
1 -
Transport in SAP BODS
1 -
Transport Management
1 -
TypeScript
2 -
unbind
1 -
Unified Customer Profile
1 -
UPB
1 -
Use of Parameters for Data Copy in PaPM
1 -
User Unlock
1 -
VA02
1 -
Validations
1 -
Vector Database
1 -
Vector Engine
1 -
Visual Studio Code
1 -
VSCode
1 -
Web SDK
1 -
work zone
1 -
workload
1 -
xsa
1 -
XSA Refresh
1
- « Previous
- Next »
Related Content
- Hack2Build on Business AI – Highlighted Use Cases in Technology Blogs by SAP
- Analyze Expensive ABAP Workload in the Cloud with Work Process Sampling in Technology Blogs by SAP
- Capture Your Own Workload Statistics in the ABAP Environment in the Cloud in Technology Blogs by SAP
- 10+ ways to reshape your SAP landscape with SAP Business Technology Platform - Blog 7 in Technology Blogs by SAP
- 10+ ways to reshape your SAP landscape with SAP Business Technology Platform – Blog 4 in Technology Blogs by SAP
Top kudoed authors
| User | Count |
|---|---|
| 11 | |
| 10 | |
| 7 | |
| 6 | |
| 4 | |
| 4 | |
| 3 | |
| 3 | |
| 3 | |
| 3 |