
- SAP Community
- Products and Technology
- Financial Management
- Financial Management Blogs by Members
- Introduction to IT Cost Management
Financial Management Blogs by Members
Dive into a treasure trove of SAP financial management wisdom shared by a vibrant community of bloggers. Submit a blog post of your own to share knowledge.
Turn on suggestions
Auto-suggest helps you quickly narrow down your search results by suggesting possible matches as you type.
Showing results for
vanjajovanovic
Explorer
Options
- Subscribe to RSS Feed
- Mark as New
- Mark as Read
- Bookmark
- Subscribe
- Printer Friendly Page
- Report Inappropriate Content
03-08-2021
4:04 PM
Hello everyone, my name is Vanja. In last two years, I had the opportunity to be the lead of SAP Profitability and Performance Management Solution’s IT Cost Management in content development team. In that period, I’ve investigated and learned that IT departments are crucial for a lot of companies and IT expenses should be carefully monitored more than ever. For that reason, I think I am knowledgeable enough to write a blog post about this topic. It will be divided into two parts (blog posts). First part covers introduction to IT cost management, and second part will cover additional functionalities: integration with cloud billing systems and how the costs of ongoing project with its WBS (Work Breakdown Structure) are allocated through predefined hierarchy.
Technology is the core of many companies as it connects different business units in order to enable greater efficiency and better communication. In addition, almost every employee needs access to applications, programs, hardware, and various systems. All of this has contributed to technology becoming key in decision-making processes so it requires more attention from managers.
Standard market approach requires from software solutions to incorporate profitability measurement, cost transparency and tracking resource consumption in order to give answers to the most challenging aspects of any company. All departments of a company are connected and somewhat dependent on each other, so the latest technologies allow them to access data in real time, through the cloud system, which has significantly contributed to the unloading of internal servers in companies and fast data processing.
Financial data in general is structured through general ledger and sometimes raw financial data is not understandable enough for IT managers. In this framework you will see that general ledger data is organized in cost pools with belonging sub pools. Applied framework describes flow of costs from cost sources across IT resources (IT Towers), Services and Business units. Activity Based Costing methodology is implemented in cost allocation, so you may notice step down allocation through many levels. Market situation, global trends and customer needs caused significant growth of IT costs, so management takes these costs allocation as a real challenge that leaders face on a daily basis. Many of their questions can be answered by SAP Profitability and Performance Management capabilities through IT Cost Management content with the newest version 11 from SP13.
Financial information is structured through the general ledger, but this information is sometimes not enough for the decision makers in the IT departments, so there is a need to structure it into sub pools and pools according to common characteristics. Pools are made up of related General ledgers so you may find some of the pools that are used in our content:
- Internal labor, which includes costs related to salaries and benefits of employees
- External labor, refers to compensation contracts with external agencies and work engaged outside the company
- Outside services, implies services by external partners in various domains
- Hardware that includes spare parts, depreciation, purchase on lease or capital
- Software that is purchased or on lease, includes licenses, maintenance, support
After the financial data is structured through cost pools, each tower or resource is assigned a specific pool and sub pool as well as accompanying services and applications. Cost Towers represent infrastructure supported by IT and concentrated into groups depending on owners or users. In following steps of cost allocation process, tower costs are allocated to services with various categories and types. Final allocation is performed on business units, as final users.
Complete allocation flow you may find in picture below:

In order to assure that costs are properly allocated through dimensions, drivers and driver values are specifically created to connect each specific dimension. Leasing unit, hardware unit, man hours, FTE, etc. are used as tower drivers. Besides them, service drivers present specific drivers describing service usage: number of devices, number of users, number of accounts, storage used and many more. IT cost management content enables editing of drivers when the users have the need for that.
Each allocation step can be tracked in all phases, with more or less details, depending on user needs for granularity of data. If user needs more details, by simple adding of dimensions, granularity and transparency can be achieved. Value flow is one of the most popular charts our solution offers, as shown in the following chart:
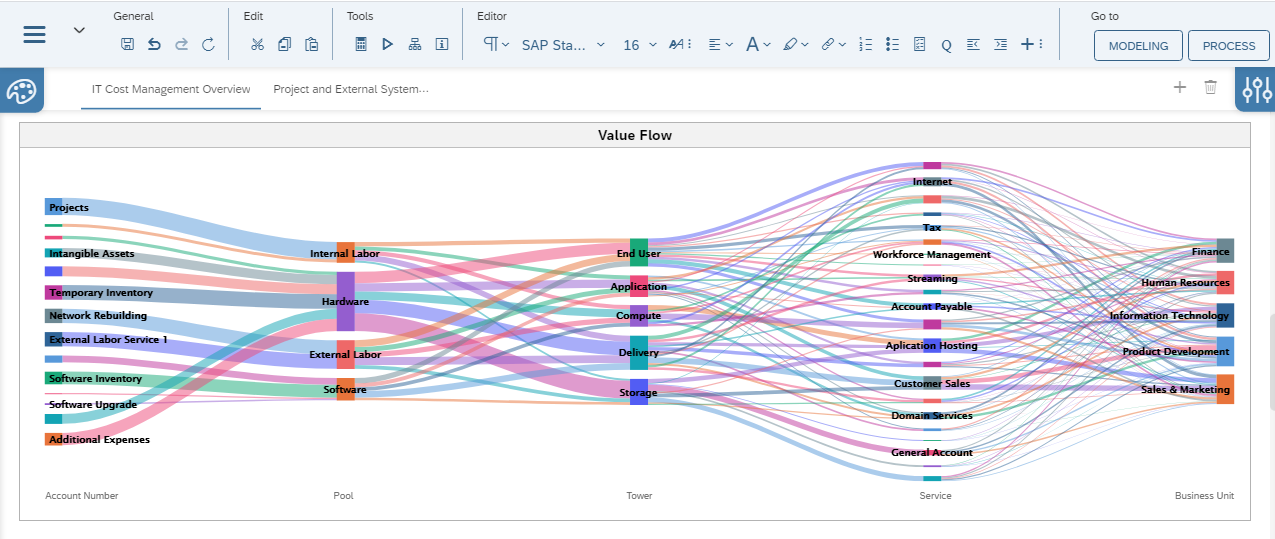
In order to achieve even greater level of details, in chart settings additional dimensions can be chosen:

Let me explain you about data source used in our example, to get the insights about the core of the content. Model table is used as primary function with predefined fields as dimension so in case of implementation it enables connection with customer real data. In picture below you may see header settings as well as available fields for one specific model table:

As ‘Model Table Source’ is used Environment which means that model is managed directly in Environment. Listed fields are taken from SAP S/4HANA tables to enable faster implementation and go-live.
In addition to the above Model data source, there are other sources that are managed externally, and the model table serves as a reference to make the data available in the environment. Example of those sources are: Data Dictionary, SAP S/4HANA, Smart Data Access (SDA). For each of those sources, additional settings should be set to make data available in environment. In case of external sources, information from fields must be synchronized into environment fields.

Now, when the data is well structured within model tables, step-down allocations enter the scene:

As I already explained before, our allocation process follows standard methodology in combination with activity-based costing. Assign Pools, Opex and Capex is allocation function that is used to assign general ledger data to appropriate pools and sub pools ant put it in proper form for IT understanding. From that point, allocation on cost towers can start after all towers and sub towers are mapped with corresponding polls and sub pools. On the other side, almost every service and application have matching tower and sub tower, so costs of towers are easily allocated on further dimensions. In the previous text you can see that users of IT services are widespread in all parts of the company, so the last allocation of costs is just to users, in our case business units that can be HR, Finance, Customer Services, Sales, Marketing and many more. Final result contains all information – from first allocation to the last one, so you can track results on each dimension separately, or by choosing more dimension – like it is presented in value flow.
Since 2020 has posted a lot of challenges to business leaders, IT spending had to be monitored and tightly controlled. Many IT projects are suspended, waiting for economic recovery. On the other hand, companies need systems that can quickly and easily adapt to the situation, and yet be efficient and accurate in measuring costs at different levels. Such methodology can be seen through sample content, with stepdown allocations of relevant IT costs with high level of details.
Until next time, and second part of IT Cost Management story.
- SAP Managed Tags:
- SAP Profitability and Performance Management,
- SAP S/4HANA
2 Comments
You must be a registered user to add a comment. If you've already registered, sign in. Otherwise, register and sign in.
Labels in this area
-
Assign Missing Authorization Objects
1 -
Bank Reconciliation Accounts
1 -
CLM
1 -
FIN-CS
1 -
Finance
2 -
GRIR
1 -
Group Reporting
1 -
Invoice Printing Lock
2 -
Mapping of Catalog & Group
1 -
Mapping with User Profile
1 -
matching concept and accounting treatment
1 -
Oil & Gas
1 -
Payment Batch Configurations
1 -
Public Cloud
1 -
Revenue Recognition
1 -
review booklet
1 -
SAP BRIM
1 -
SAP CI
1 -
SAP RAR
1 -
SAP S4HANA Cloud
1 -
SAP S4HANA Cloud for Finance
1 -
SAP Treasury Hedge Accounting
1 -
Z Catalog
1 -
Z Group
1
Related Content
- SAP advanced treasury and risk management package for GROW with SAP in Financial Management Blogs by SAP
- Direct Tax deductible items and automatic posting on extended ledger in Financial Management Q&A
- Manage dates-driven planning processes with SAP Analytics Cloud in Financial Management Blogs by SAP
- Payment Batch Configurations SAP BCM - S4HANA in Financial Management Blogs by Members
- Advanced treasury and risk management package for RISE with SAP in Financial Management Blogs by SAP