
- SAP Community
- Products and Technology
- Technology
- Technology Blogs by SAP
- The beauty of Inverse formulas and the Value Drive...
Technology Blogs by SAP
Learn how to extend and personalize SAP applications. Follow the SAP technology blog for insights into SAP BTP, ABAP, SAP Analytics Cloud, SAP HANA, and more.
Turn on suggestions
Auto-suggest helps you quickly narrow down your search results by suggesting possible matches as you type.
Showing results for
Product and Topic Expert
Options
- Subscribe to RSS Feed
- Mark as New
- Mark as Read
- Bookmark
- Subscribe
- Printer Friendly Page
- Report Inappropriate Content
02-22-2021
7:17 PM
Have you ever wondered what if? What if I would have taken that job offer, what if I would have said yes… I know I sure have. Personally, I haven’t found a solution yet, but in professional life there is a way to make this contemplation effective in business decision making using so called "What if" analysis.
In this blogpost I’d like to take you through two powerful functionalities in SAP Analytics Cloud that help you answer the question of what if: the Value Driver Tree and Inverse calculations. The Value Driver Tree is a clear visualization of the flow of data in your model and the Inverse calculation let’s you manipulate the flow also across calculated fields. Let us delve deeper into this functionality using a personal case.
The case
I wouldn’t dare call myself an entrepreneur as I’ve worked for an employer all of my life, but thinking back to my youth I have spent some weekends selling plants from my parents’ driveway. This was an ingenious business model where I was able to have no procurement cost due to my grandmother’s garden providing an ample supply of plants, and no labor cost as my parents slaved away making sure inventory was nicely trimmed. I just needed to take care of product management and sales which might have been a preamble to my future but that’s another story.
What we’ll do is take this case of marvelous business ingenuity, and now start asking my 8 year old self, what if?
Modelling
Taking the case as is would be relatively simple to model in SAP Analytics Cloud. Therefore, we’ll create a model with only 3 accounts indicating the simplicity: Price, Volume and Revenue. As these three held all the business metrics I ought to be relevant back then.
Opening the dimension adding the three accounts as well as the formula.
Now let’s save this model and see what it looks like.
Value Driver Tree
To see what it looks like I will create a story with a canvas page and add a Value Driver Tree widget referring to the just saved model.
Here I get the option to auto create the Value Driver Tree from the model which I’ll do selecting all accounts.
Entering some numbers would give me the view of a booming Sunday’s business results.
Here I can ask myself the first question: What if I’d increase my price with 10%, what would this mean for revenue? Using the Value Driver tree, the answer is delivered to me immediately! Back then I had to ask my father – my chief analyst at the time – for these insights, so this would’ve been a true time saver!
Now let’s challenge Nick jr. a bit more, what if my grandmother got fed up with her garden shrinking and started asking a fee per plant? If we’ll add some accounts here and update the Value Driver Tree we’ll find out!
To accommodate this major shift in supplier relations we’ll add three more accounts and corresponding formulas: Cost price, Procurement cost and Gross Profit.
Generating another Value Driver Tree will now answer this question to see if the time invested still warrants the projected profits. Given this setback some extra volumes would be needed to reach the target of at least €20 of Profits per day. Given the Gross profit node is a formula, it cannot directly be edited. This is where the Inverse calculation comes in, where we can make the non-editable, editable.
Inverse your problem to a solution
In the formula section of the Account dimension in our model we can add Inverse functionality. The Inverse functionality allows entry on formulas, because in the Inverse selection we explain how to make changes with the entry to the underlying accounts of the calculation. In below example you see that I’ve added Inverse functionality to the nodes that I’d like to be editable. As Grandmother won’t budge, I’ve chosen to only make Revenue and Gross profit editable, by increasing either node, Volume will now increase accordingly – or decrease naturally –.
Adding Inverse is simple as a tooltip explaining the syntax and providing options will automatically appear. Note that I’ve added the full formula in Gross profit to make sure everything can be specifically assigned.
Final What if questions I can now ask are: What do I need to do to get my desired level of €20 Gross Profit? How do I get to €30? The Value Driver Tree answers, and Nick jr. is ready to do business!
Conclusion
Above example is naturally lacking in complexity, it however does show the beauty of the Inverse functionality combined with the Value Driver tree. I’d encourage you to explore this further for your own business scenario, adding more complex formulas with INVERSEIF and OR statements to capture the full complexity of the real world as best you can. You’d be amazed what excitement this sparks in the business user to be able to answer "What if" scenarios in such a flexible and visual manner.
In this blogpost I’d like to take you through two powerful functionalities in SAP Analytics Cloud that help you answer the question of what if: the Value Driver Tree and Inverse calculations. The Value Driver Tree is a clear visualization of the flow of data in your model and the Inverse calculation let’s you manipulate the flow also across calculated fields. Let us delve deeper into this functionality using a personal case.
The case
I wouldn’t dare call myself an entrepreneur as I’ve worked for an employer all of my life, but thinking back to my youth I have spent some weekends selling plants from my parents’ driveway. This was an ingenious business model where I was able to have no procurement cost due to my grandmother’s garden providing an ample supply of plants, and no labor cost as my parents slaved away making sure inventory was nicely trimmed. I just needed to take care of product management and sales which might have been a preamble to my future but that’s another story.
What we’ll do is take this case of marvelous business ingenuity, and now start asking my 8 year old self, what if?
Modelling
Taking the case as is would be relatively simple to model in SAP Analytics Cloud. Therefore, we’ll create a model with only 3 accounts indicating the simplicity: Price, Volume and Revenue. As these three held all the business metrics I ought to be relevant back then.
Creating a Blank model from scratch and adding only 1 dimension, the Account dimension

Start with a blank model

Add a generic dimension

Choose the Account dimension
Opening the dimension adding the three accounts as well as the formula.

Put in the Account information
Now let’s save this model and see what it looks like.
Value Driver Tree
To see what it looks like I will create a story with a canvas page and add a Value Driver Tree widget referring to the just saved model.
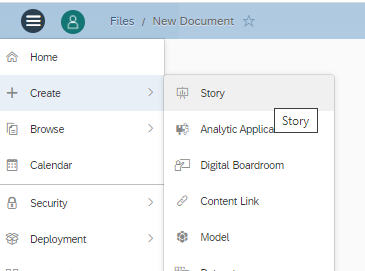
Create a Story

Add a Canvas page

Add the Value Driver Tree
Here I get the option to auto create the Value Driver Tree from the model which I’ll do selecting all accounts.

Auto-create Value Driver Tree

Select all accounts

Value Driver Tree created
Entering some numbers would give me the view of a booming Sunday’s business results.
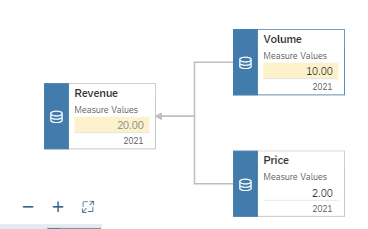
Entering values
Here I can ask myself the first question: What if I’d increase my price with 10%, what would this mean for revenue? Using the Value Driver tree, the answer is delivered to me immediately! Back then I had to ask my father – my chief analyst at the time – for these insights, so this would’ve been a true time saver!
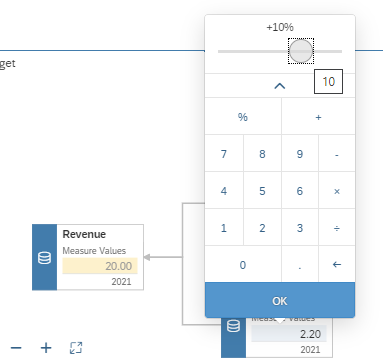
Percentage increase

Review results
Now let’s challenge Nick jr. a bit more, what if my grandmother got fed up with her garden shrinking and started asking a fee per plant? If we’ll add some accounts here and update the Value Driver Tree we’ll find out!
To accommodate this major shift in supplier relations we’ll add three more accounts and corresponding formulas: Cost price, Procurement cost and Gross Profit.

Adjusted accounts
Generating another Value Driver Tree will now answer this question to see if the time invested still warrants the projected profits. Given this setback some extra volumes would be needed to reach the target of at least €20 of Profits per day. Given the Gross profit node is a formula, it cannot directly be edited. This is where the Inverse calculation comes in, where we can make the non-editable, editable.

Newly created Value Driver Tree
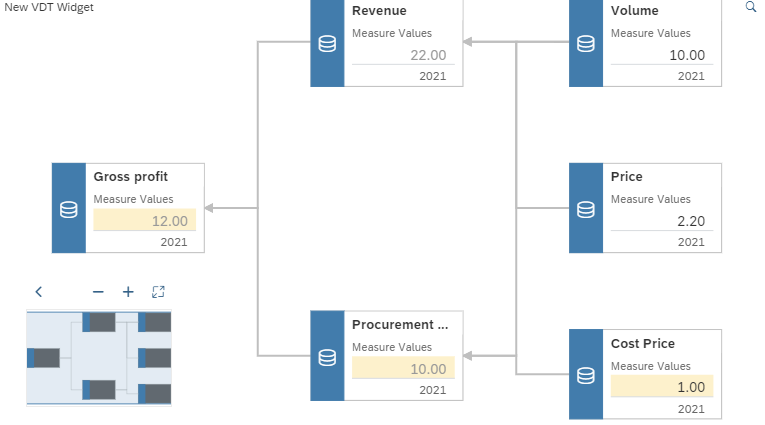
New values
Inverse your problem to a solution
In the formula section of the Account dimension in our model we can add Inverse functionality. The Inverse functionality allows entry on formulas, because in the Inverse selection we explain how to make changes with the entry to the underlying accounts of the calculation. In below example you see that I’ve added Inverse functionality to the nodes that I’d like to be editable. As Grandmother won’t budge, I’ve chosen to only make Revenue and Gross profit editable, by increasing either node, Volume will now increase accordingly – or decrease naturally –.
Adding Inverse is simple as a tooltip explaining the syntax and providing options will automatically appear. Note that I’ve added the full formula in Gross profit to make sure everything can be specifically assigned.

Inverse Tooltip

Final formula view
Final What if questions I can now ask are: What do I need to do to get my desired level of €20 Gross Profit? How do I get to €30? The Value Driver Tree answers, and Nick jr. is ready to do business!

€20 Scenario

€30 Scenario
Conclusion
Above example is naturally lacking in complexity, it however does show the beauty of the Inverse functionality combined with the Value Driver tree. I’d encourage you to explore this further for your own business scenario, adding more complex formulas with INVERSEIF and OR statements to capture the full complexity of the real world as best you can. You’d be amazed what excitement this sparks in the business user to be able to answer "What if" scenarios in such a flexible and visual manner.
- SAP Managed Tags:
- SAP Analytics Cloud,
- SAP Analytics Cloud for planning
Labels:
6 Comments
You must be a registered user to add a comment. If you've already registered, sign in. Otherwise, register and sign in.
Labels in this area
-
ABAP CDS Views - CDC (Change Data Capture)
2 -
AI
1 -
Analyze Workload Data
1 -
BTP
1 -
Business and IT Integration
2 -
Business application stu
1 -
Business Technology Platform
1 -
Business Trends
1,658 -
Business Trends
91 -
CAP
1 -
cf
1 -
Cloud Foundry
1 -
Confluent
1 -
Customer COE Basics and Fundamentals
1 -
Customer COE Latest and Greatest
3 -
Customer Data Browser app
1 -
Data Analysis Tool
1 -
data migration
1 -
data transfer
1 -
Datasphere
2 -
Event Information
1,400 -
Event Information
66 -
Expert
1 -
Expert Insights
177 -
Expert Insights
295 -
General
1 -
Google cloud
1 -
Google Next'24
1 -
Kafka
1 -
Life at SAP
780 -
Life at SAP
13 -
Migrate your Data App
1 -
MTA
1 -
Network Performance Analysis
1 -
NodeJS
1 -
PDF
1 -
POC
1 -
Product Updates
4,577 -
Product Updates
341 -
Replication Flow
1 -
RisewithSAP
1 -
SAP BTP
1 -
SAP BTP Cloud Foundry
1 -
SAP Cloud ALM
1 -
SAP Cloud Application Programming Model
1 -
SAP Datasphere
2 -
SAP S4HANA Cloud
1 -
SAP S4HANA Migration Cockpit
1 -
Technology Updates
6,873 -
Technology Updates
419 -
Workload Fluctuations
1
Related Content
- Start page of SAP Signavio Process Insights, discovery edition, the 4 pillars and documentation in Technology Blogs by SAP
- Issues with "SAP Analytics Cloud, add-in for Microsoft Excel" while working with SAP Datasphere in Technology Q&A
- Analysis for Office - Lost Functionality - View Query Documents? RSA1 -> Documents in Technology Q&A
- Merge cells in analysis for office? in Technology Q&A
- SAP Signavio is the highest ranked Leader in the SPARK Matrix™ Digital Twin of an Organization (DTO) in Technology Blogs by SAP
Top kudoed authors
| User | Count |
|---|---|
| 36 | |
| 25 | |
| 17 | |
| 13 | |
| 8 | |
| 7 | |
| 6 | |
| 6 | |
| 6 | |
| 6 |