Welcome everybody to the second use case for using constant selection. If you have never heard of a constant selection and would like to understand the basics first check out our introductory blog.
But now let's dive right in! A typical use case for constant selection would be to compare the performance of different sales managers with the average to identify who is performing below average and by how much. We are going to look at the Gross Margin of the Sales Managers.
First, you need to calculate the average Gross Margin per Sales Manager.

If you add this new measure to the chart drilled down by manager it is not showing you the average, but the Gross Margin per Sales Manager as it is taking the drill-down into account and therefore no aggregation takes place on the dimension Sales Manager.

To overrule the drill-down, we create a restriction on top of the aggregation created before. You restrict the aggregation on actuals and make a constant selection of Sales Manager and Category.

This measure will show the average across managers instead of the personal performance of each Sales Manager.

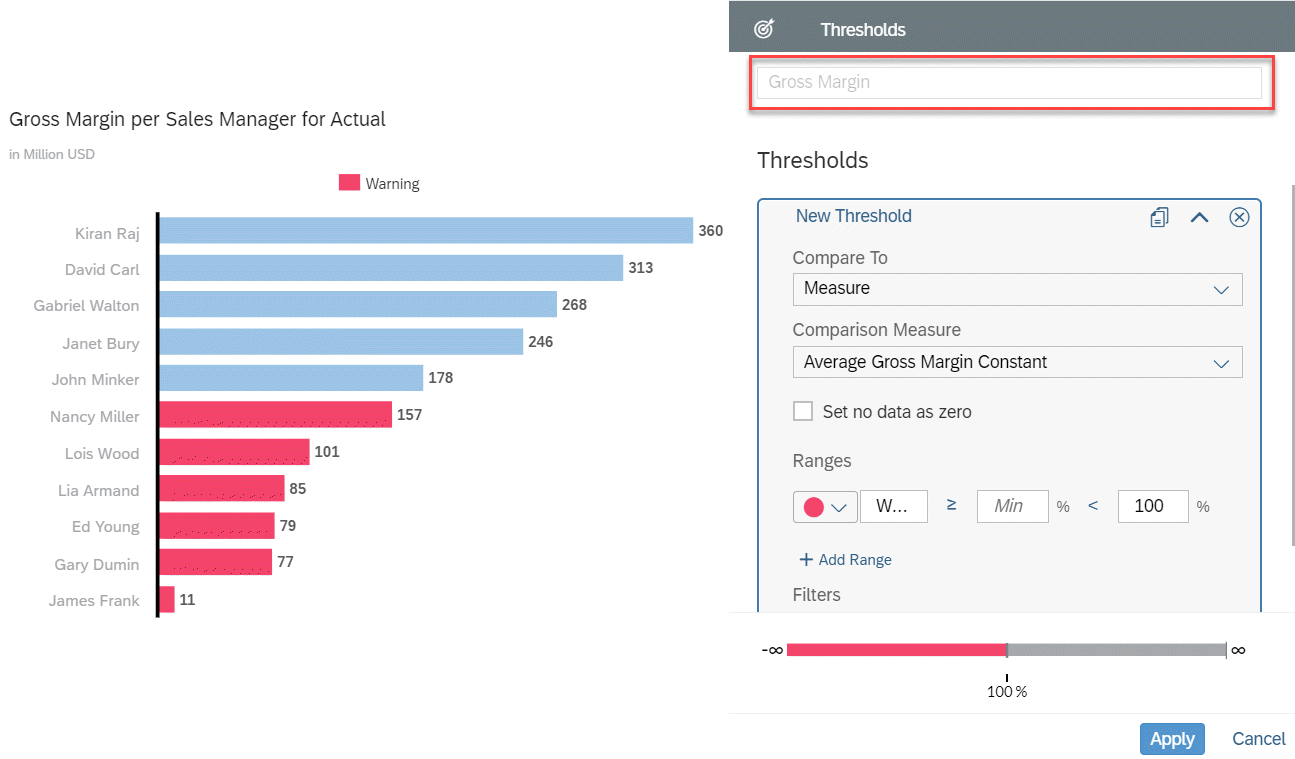
Now we want to compare the individual performance to the average. You could display the difference of each sales manager’s performance to the average as a variance or you can use a threshold to mark which Sales Managers are underperforming in red, which we will do in this example as shown below.
If you need more information on thresholds, please check out this blog.
You can also count the number of Sales Managers who are performing below average, which will be useful for bigger data sets. For this you would create a calculation with an if statement first, which checks if the Gross margin is smaller than the average Gross Margin.

Finally, you need to create an aggregation on the calculation above, to count (excluding NULL and 0) the Sales Manager who perform below average. This aggregation will execute the above calculation for each Sales Manager and count all those up, where the result of the If Statement is 1.

This calculation will correctly show that 6 Sales Managers are performing below average:

Filters on dimensions, that are not defined as constant dimensions can be applied and work as expected. In this example we have been looking at the global gross margin per Sales Manager. The region is not kept constant and therefore all calculated measures above will work with a regional filter. Let’s look at the Gross Margin and the Sales Manager Performance for China. We can see that less Sales Managers are selling in this region, that the Gross margin is lower and that three of the Sales Managers are performing below average.

To read about other use cases, check out the following blogs:
