
- SAP Community
- Products and Technology
- Technology
- Technology Blogs by SAP
- Sneak Peek into SAP Analytics Cloud release for Q1...
Technology Blogs by SAP
Learn how to extend and personalize SAP applications. Follow the SAP technology blog for insights into SAP BTP, ABAP, SAP Analytics Cloud, SAP HANA, and more.
Turn on suggestions
Auto-suggest helps you quickly narrow down your search results by suggesting possible matches as you type.
Showing results for
Product and Topic Expert
Options
- Subscribe to RSS Feed
- Mark as New
- Mark as Read
- Bookmark
- Subscribe
- Printer Friendly Page
- Report Inappropriate Content
01-14-2021
10:13 AM
It's a New Year and we have some great new features coming with SAP Analytics Cloud QRC release for Q1 2021. In this quarter we bring you a number of highly anticipated and requested features with a focusing on user experience, integration and keeping you in the loop when you are on the go.
We will be coming to you very shortly with blogs and videos explain these latest and greatest features, but before that I want to give you a sneak peek at some of the highlights.
Our What's New video is also now available.
The Data Analyzer is a predefined ready-to-run service for SAP BW queries launched in 2019. You can use the Builder panel to navigate and analyze your data by adding and removing dimensions from the table, filtering for items, and changing its display and sort order. Creating your personalized Insight
In this release we allow you to save these Insights either publicly or privately and you can even share them with your colleagues.
In 2021 we will be increasing the flexibility and ease of use of our Plan Process Management. Starting in Q1 we will be introducing new task types such as Composite, General and Review. With these new tasks comes some new behaviours including:
Another highly requested feature in Q1 is the ability to open your Story in Explorer mode. You can enable Explorer for all charts and Tables in your story, with one click by selecting Explorer View Mode from the builder panel.
Once Explorer mode is enabled you can make changes to Dimensions and Measures, change sort order and easily navigate between pages and widgets. And when complete you can save your changes or copy them to your story page or create a new page.
For more details you can check out this great blog.
You will also notice when opening a story our new and updated view time tool bar. It has been collapsed and minimized to take up less space on the page, allowing users to focus on the content of their story. Frequently used actions such as filter, refresh and bookmarks have been retained on the tool bar for easy access.
Navigation between pages can be done using the roller or simply by using the drop down menu. If users still prefer the traditional way of displaying page tabs, they can switch back at anytime by selecting tab bar from the Display menu.
Smart Discovery has long been one of our most popular smart features, opening the world of Machine Learning to everyday analytics users. In this release we have improved our user experience to further bridge the knowledge gap and allow analysts to safely use machine learning in BI.
Preparing data for use with machine learning algorithms can be complex and extremely time consuming, Smart Discovery now automatically leverages data contained in existing BI models eliminating manual data preparation.
Furthermore, it maps the output cleanly to the business question and make it simple for the user to then refine and improve.
Last but at no means least we have the very exciting Voice to Insight! We have all gotten very used to asking Alexa, Siri and Google questions. Well know you can ask SAP Analytics Cloud questions about your data.
With Search to Insight we can ask business questions of our data using Natural Language Query, this also went Mobile last year but now you can speak your business questions in to your mobile device and quickly get insights return to you on the go.
We will be diving deeper into these features and many more in the coming weeks but we hope this gives you a flavour of what is to come in Q1 2021.
Want to experience new and existing features for yourself? Take the leap and start your journey towards making data-driven decisions with confidence by signing up for a 90-day free trial, today.
We will be coming to you very shortly with blogs and videos explain these latest and greatest features, but before that I want to give you a sneak peek at some of the highlights.
Our What's New video is also now available.
Data Analyzer
The Data Analyzer is a predefined ready-to-run service for SAP BW queries launched in 2019. You can use the Builder panel to navigate and analyze your data by adding and removing dimensions from the table, filtering for items, and changing its display and sort order. Creating your personalized Insight
In this release we allow you to save these Insights either publicly or privately and you can even share them with your colleagues.

Plan Process Management – Flexible Modeling of Calendar Tasks and Processes
In 2021 we will be increasing the flexibility and ease of use of our Plan Process Management. Starting in Q1 we will be introducing new task types such as Composite, General and Review. With these new tasks comes some new behaviours including:
Task Conversion – convert between Composite and General/Review tasks*
People section – "Team-like" behaviour whereby only single submission is required when multiple assignees or reviewers exist
Time distribution – Dedicated due dates for assignee & reviewers, and slider to easily adjust submit vs approval time allocation
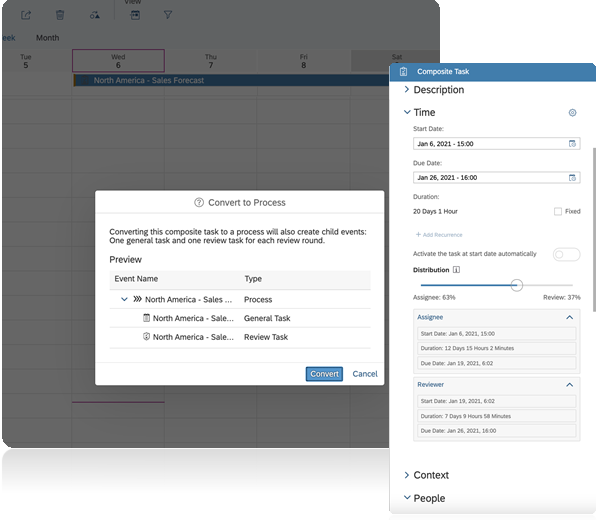
This allows users to easily customization any task or sub-component of a task by adding specific dates for reviewers and assignees and enhancing the overall transparency and tracking of your projects.
Story Exploration & Improved view-time story tool bar
Another highly requested feature in Q1 is the ability to open your Story in Explorer mode. You can enable Explorer for all charts and Tables in your story, with one click by selecting Explorer View Mode from the builder panel.

Once Explorer mode is enabled you can make changes to Dimensions and Measures, change sort order and easily navigate between pages and widgets. And when complete you can save your changes or copy them to your story page or create a new page.

For more details you can check out this great blog.
You will also notice when opening a story our new and updated view time tool bar. It has been collapsed and minimized to take up less space on the page, allowing users to focus on the content of their story. Frequently used actions such as filter, refresh and bookmarks have been retained on the tool bar for easy access.

Navigation between pages can be done using the roller or simply by using the drop down menu. If users still prefer the traditional way of displaying page tabs, they can switch back at anytime by selecting tab bar from the Display menu.
Smart Discovery
Smart Discovery has long been one of our most popular smart features, opening the world of Machine Learning to everyday analytics users. In this release we have improved our user experience to further bridge the knowledge gap and allow analysts to safely use machine learning in BI.
Preparing data for use with machine learning algorithms can be complex and extremely time consuming, Smart Discovery now automatically leverages data contained in existing BI models eliminating manual data preparation.

Furthermore, it maps the output cleanly to the business question and make it simple for the user to then refine and improve.
Voice to Insight
Last but at no means least we have the very exciting Voice to Insight! We have all gotten very used to asking Alexa, Siri and Google questions. Well know you can ask SAP Analytics Cloud questions about your data.
With Search to Insight we can ask business questions of our data using Natural Language Query, this also went Mobile last year but now you can speak your business questions in to your mobile device and quickly get insights return to you on the go.

We will be diving deeper into these features and many more in the coming weeks but we hope this gives you a flavour of what is to come in Q1 2021.
Want to experience new and existing features for yourself? Take the leap and start your journey towards making data-driven decisions with confidence by signing up for a 90-day free trial, today.
Labels:
2 Comments
You must be a registered user to add a comment. If you've already registered, sign in. Otherwise, register and sign in.
Labels in this area
-
ABAP CDS Views - CDC (Change Data Capture)
2 -
AI
1 -
Analyze Workload Data
1 -
BTP
1 -
Business and IT Integration
2 -
Business application stu
1 -
Business Technology Platform
1 -
Business Trends
1,658 -
Business Trends
91 -
CAP
1 -
cf
1 -
Cloud Foundry
1 -
Confluent
1 -
Customer COE Basics and Fundamentals
1 -
Customer COE Latest and Greatest
3 -
Customer Data Browser app
1 -
Data Analysis Tool
1 -
data migration
1 -
data transfer
1 -
Datasphere
2 -
Event Information
1,400 -
Event Information
66 -
Expert
1 -
Expert Insights
177 -
Expert Insights
296 -
General
1 -
Google cloud
1 -
Google Next'24
1 -
Kafka
1 -
Life at SAP
780 -
Life at SAP
13 -
Migrate your Data App
1 -
MTA
1 -
Network Performance Analysis
1 -
NodeJS
1 -
PDF
1 -
POC
1 -
Product Updates
4,577 -
Product Updates
342 -
Replication Flow
1 -
RisewithSAP
1 -
SAP BTP
1 -
SAP BTP Cloud Foundry
1 -
SAP Cloud ALM
1 -
SAP Cloud Application Programming Model
1 -
SAP Datasphere
2 -
SAP S4HANA Cloud
1 -
SAP S4HANA Migration Cockpit
1 -
Technology Updates
6,873 -
Technology Updates
420 -
Workload Fluctuations
1
Related Content
- Customer & Partner Roundtable for SAP BTP ABAP Environment #12 in Technology Blogs by SAP
- 入門!SAP Analytics Cloud for planning 機能紹介シリーズ - データアクションとマルチアクション in Technology Blogs by SAP
- Composite Data Source Configuration in Optimized Story Experience in Technology Blogs by SAP
- Need Info on System Owner Permissions for SAC,DSP in Technology Q&A
- SAP Datasphere インテリジェントルックアップ : 名寄せ機能のご紹介 in Technology Blogs by SAP
Top kudoed authors
| User | Count |
|---|---|
| 37 | |
| 25 | |
| 17 | |
| 13 | |
| 7 | |
| 7 | |
| 7 | |
| 6 | |
| 6 | |
| 6 |