
- SAP Community
- Groups
- Interest Groups
- Welcome Corner
- Blog Posts
- I Have A Dream: Code Visualization
Welcome Corner Blog Posts
Go a little bit deeper into the Welcome Corner with blog posts. Learn how to get started in SAP Community and get tips on maximizing your participation.
Turn on suggestions
Auto-suggest helps you quickly narrow down your search results by suggesting possible matches as you type.
Showing results for
ennowulff
Active Contributor
Options
- Subscribe to RSS Feed
- Mark as New
- Mark as Read
- Bookmark
- Subscribe
- Printer Friendly Page
- Report Inappropriate Content
12-29-2020
7:58 PM
There are some things I find absolutely addicting. Besides of code beauty and clean code and education, which I find interesting, I am also a great fan of gamification and visualization.
I wanted to find out how gamification might work in the ABAP programming environment and therefor started the GLADIUS project where you could kind of code-fight ABAP problems.
Visualization in the SAPGUI is not very easy because the graphical conditions are quite limited. There are UI5 components which can be used better for visualizing data and figures, like this UI5 demo. Some visualizations are also possible in SAPGUI but often very complicated.
There is a very interesting aspect of visualization and some special data: source code. Some people also tried to visualize source code dependencies or specials aspects of code like lines of codes, number of methods or attributes of a class and many more.
I will try to give an overview on existing projects and ideas that I have... Sorry for this long article. I figured out to split into mutliple posts but decided that one larger article might be better. Have fun reading!
Before you can visualize source code, you need to have some metrics that you can apply on the displayed objects. Because there are limitations on the amount of different metrics and displayable data for one object, you will have to define some views depending on your intent.
One of the most metrics used might be LOC - Lines of Code. This metric is very simple and yet useful in similar cases. Other metrics might be
These metrics can be more or less easily be found out. There are other metrics that are harder to determine and sometimes are not directly stored with the code, like:
You might also consider to add beauty metrics:
I know that clean code and beauty depends on personal views but some might be quite countable if you run abapOpenChecks by lars.hvam on it...
There is a good overview of code metrics by ndepend.
If you want to visualize code you have limited options because you can only use a few of the existing metrics to build an object. If you use three metrics for the width and length, the height and the color then you are done. Other metrics can only be displayed by tags or additional tags but not really visualized. Of course you can have something like a dashboard to display all the metrics but that is not what I understand by visualization.
At the end of this post I will try to tell about some ideas of how to display more metrics at once.
Here are the projects and examples that I found on my search for code visualization. There are many projects that seem to be quite active although the demo sites are down. Some projects are some years old and do not seem to be maintained any more.
The first time I got in contact with code visualizations was with Moose and the contributions of rainer.winkler to it. Moose provides a some very nice pictures of code like the one on the main page of Moosetechnology.org:
Moose can be used to view the source code parts, get an overview on the number of objects and its dependencies. The more lines of code an object has the bigger it is. Private methods are red and protected are blue (or vice versa). Black dots are attributes. Or something like that. Sorry, I don't remember exactly. Dependencies are shown by lines.
rainer.winkler wrote some blog posts about it and uses it for his daily work to understand and document legacy code.
Another great but maybe discontinued project is Code City by Richard Wettel. Code City visualizes source code in form of a city. Each class is a block and each method a building. The more lines a method has the higher the building is.
Code City also uses Moose as platform.
Promising: there is a Codecity Eclipse-Plugin in the Eclipse marketplace. I assume that it will not work with ABAP...
Further Links:
The Code is Beautiful project of Quantified Code provides some very promising screenshots:
Some source code is on github but the demos are not reachable.
On this web page some code visualization tools are named and provides some further links.
Code Radar is a project to visualize code similar to Code City and also provides a functionality to compare two different versions of a code base which you can explore in the demo.
Also very interesting is the project Softvis3d. Also looks very promising but same here: unluckily the some demos are not running althouhg the github project seems to be quite active. Try out this demo.
The company ndepend offers a complete suite for code metrics, code visualization and more.
The above projects are great and can be really helpful to understand and document code. But after my son got an Oculus Quest 2 VR headset on Christmas day, I have the dream to explore code in virtual reality. The Headset and the experience within this virtual reality is so amazing that I can think of many things and options to do there. One thing is to walk through classes and into the code. And at least I am not the only one who was thinking of it...
The ICE or ISUE Lab in Orlando, Florida, already did some researches on this topic.
They built a world where code is displayed as a 3D world that can be explored by walking from class to class.
Inside each class you can see the code of it:
Again there is very little information about this project. The website shows that there are a lot of things going on, but nothing about the Code Park project. There is a video where I took the screenshots from.
There is one abstract I found by the Aalen University where the idea of 3D-code visualization and virtual interaction has been described very detailed. The screenshots I see here come quite close to the main idea that I had and that I will describe in the next chapter. The parts of the code are displayed as real buildings with structure and windows.
I wrote a lot about existing projects, metrics and I hope you got an idea of what could be.
Now I would like to give you some idea of how code visualization, virtual reality and gamification might come together...
Up to now we learned, that buildings are a good idea to visualize code. The last chapter comes quite near to my idea of how a I imagine a real cool 3D source code world. The buildings are not only blocks but buildings that look like buildings with windows and some architecture. At least they have only four dimensions:
If you walk through this city then there could be code of arms or emblems of all contributors of this class. The person that last changed the object could be highlighted by a fire ring or purple glowing mist.
Objects that someone is working on can have a scaffold around it.
Classes that haven't been changed for years and do not have clean code might look like this:
If there are a lot of changes and abapOpenChecks has no "errors" then the building could look like this:
The programs behind the most or common used transaction could be placed in the middle of the city or directly at the harbour so it can be accessed easily:
Buildings can have attributes that clearly show some metrics:
If you can visualize separate programs, transactions and classes, then it might also be useful to display other objects like dictionary tables or maintenance views. Tables could be displayed as tanks or storage houses. The more data in it the bigger the storage.
Periodic jobs could be buses, trains or horse carts driving through the streets. Also processes could be visualized by moving objects. Although I have no idea of how to retrieve the data for it...Modules might be districts of the city.
Pictures taken from game Anno 1404 with help of http://annowelt.eu/
As mentioned in the beginning, the GLADIUS project wants to make the programmer fight for better coding. What, if you could fight the Code Inspector monster by changing as many CI findings in a given amount of time. You could challenge your colleagues at the end of the day to find the worst problem or the most important issue. In half an hour you will have to fight as many issues or findings as possible. At the end of the day you made a building better, more beautiful then it was before.
The code inspector findings of a class could be a monster with as many arms as there were findings. And if I talk about monsters, there is one ABAP programmer who is specialized in monster who might have fun to build them in 3D: bfeeb8ed7fa64a7d95efc21f74a8c135 your turn... 😉
At first glance all of this might be too much effort for having fun at work. But I am convinced, that some good visualizations, metrics and game rules can provide much better and stable code. This 3D Fylthrought might be a big overload but, hey, this is a dream. 😉 And modelling and interaction is not that complicated using the unreal engine or unity. The art will be to build houses dynamically and nevertheless beautiful. Plus showing relevant information and visualize changes when code was improved. VR and coding should also be possible as there are at least three different virtual desktop apps which make it possible to view the PC desktops in a virtual environment.
Of course no one would spend so much effort to design and build such a fantasy landscape of an ERP code base... Or maybe some day?
majcon had this dream already some years ago. Let's see if this dream will come true someday...
I wanted to find out how gamification might work in the ABAP programming environment and therefor started the GLADIUS project where you could kind of code-fight ABAP problems.
Visualization in the SAPGUI is not very easy because the graphical conditions are quite limited. There are UI5 components which can be used better for visualizing data and figures, like this UI5 demo. Some visualizations are also possible in SAPGUI but often very complicated.
There is a very interesting aspect of visualization and some special data: source code. Some people also tried to visualize source code dependencies or specials aspects of code like lines of codes, number of methods or attributes of a class and many more.
I will try to give an overview on existing projects and ideas that I have... Sorry for this long article. I figured out to split into mutliple posts but decided that one larger article might be better. Have fun reading!
Metrics
Before you can visualize source code, you need to have some metrics that you can apply on the displayed objects. Because there are limitations on the amount of different metrics and displayable data for one object, you will have to define some views depending on your intent.
One of the most metrics used might be LOC - Lines of Code. This metric is very simple and yet useful in similar cases. Other metrics might be
- Number of comments per lines of code
- Number of methods of a class
- Number of attributes of a class
- Number of dependencies (where-used list)
- Code coverage
- Number of changes
- age
- Number of contributors
These metrics can be more or less easily be found out. There are other metrics that are harder to determine and sometimes are not directly stored with the code, like:
- performance
- security issues
- number of issues
- number of short dumps caused by this function
- number of transactions
You might also consider to add beauty metrics:
- pretty printer executed?
- indented code
- number of spare lines
I know that clean code and beauty depends on personal views but some might be quite countable if you run abapOpenChecks by lars.hvam on it...
There is a good overview of code metrics by ndepend.
Using Metrics for Visualization
If you want to visualize code you have limited options because you can only use a few of the existing metrics to build an object. If you use three metrics for the width and length, the height and the color then you are done. Other metrics can only be displayed by tags or additional tags but not really visualized. Of course you can have something like a dashboard to display all the metrics but that is not what I understand by visualization.
At the end of this post I will try to tell about some ideas of how to display more metrics at once.
Code Visualization Projects
Here are the projects and examples that I found on my search for code visualization. There are many projects that seem to be quite active although the demo sites are down. Some projects are some years old and do not seem to be maintained any more.
Moose
The first time I got in contact with code visualizations was with Moose and the contributions of rainer.winkler to it. Moose provides a some very nice pictures of code like the one on the main page of Moosetechnology.org:

Visualized code with Moose
Moose can be used to view the source code parts, get an overview on the number of objects and its dependencies. The more lines of code an object has the bigger it is. Private methods are red and protected are blue (or vice versa). Black dots are attributes. Or something like that. Sorry, I don't remember exactly. Dependencies are shown by lines.
rainer.winkler wrote some blog posts about it and uses it for his daily work to understand and document legacy code.
Code City
Another great but maybe discontinued project is Code City by Richard Wettel. Code City visualizes source code in form of a city. Each class is a block and each method a building. The more lines a method has the higher the building is.

A Code City
Code City also uses Moose as platform.
Promising: there is a Codecity Eclipse-Plugin in the Eclipse marketplace. I assume that it will not work with ABAP...

Codecity Eclipse plugin
Further Links:
Quantified Code
The Code is Beautiful project of Quantified Code provides some very promising screenshots:

Code Is Beautiful
Some source code is on github but the demos are not reachable.
5 Tips to help you visualize Code
On this web page some code visualization tools are named and provides some further links.
Code Radar
Code Radar is a project to visualize code similar to Code City and also provides a functionality to compare two different versions of a code base which you can explore in the demo.
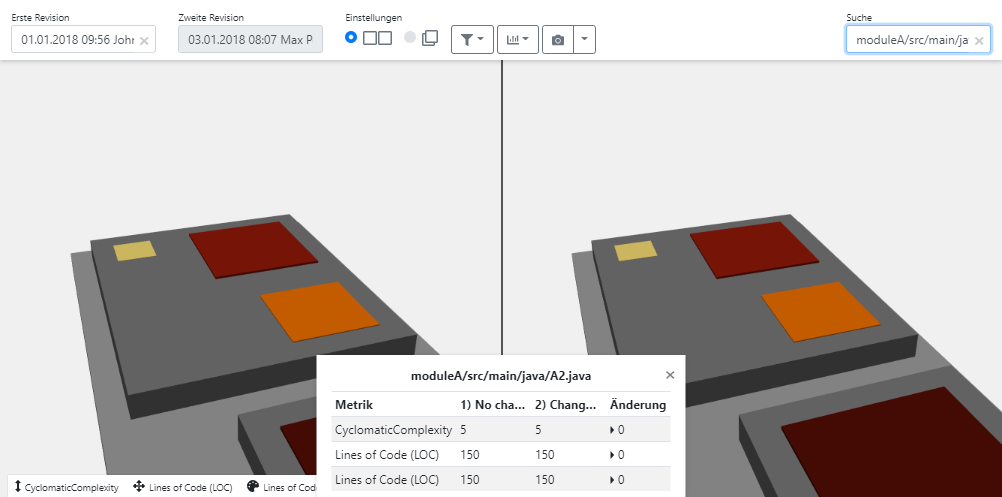
Code Radar
Softvis3d by sonarcube
Also very interesting is the project Softvis3d. Also looks very promising but same here: unluckily the some demos are not running althouhg the github project seems to be quite active. Try out this demo.

Softvis3d
ndepend
The company ndepend offers a complete suite for code metrics, code visualization and more.
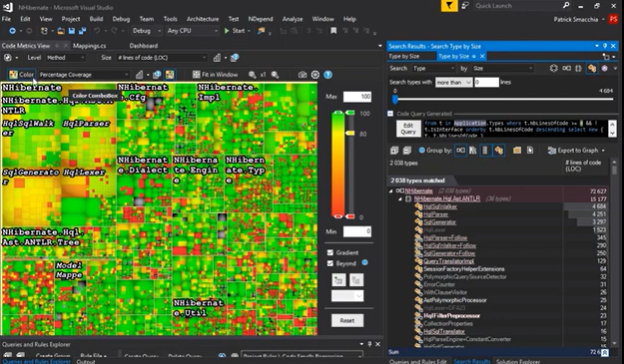
ndepend code visualization dashboard
The Future
The above projects are great and can be really helpful to understand and document code. But after my son got an Oculus Quest 2 VR headset on Christmas day, I have the dream to explore code in virtual reality. The Headset and the experience within this virtual reality is so amazing that I can think of many things and options to do there. One thing is to walk through classes and into the code. And at least I am not the only one who was thinking of it...
ISUE Lab
The ICE or ISUE Lab in Orlando, Florida, already did some researches on this topic.
They built a world where code is displayed as a 3D world that can be explored by walking from class to class.

Code Park: class building
Inside each class you can see the code of it:

Code Park: inside a class
Again there is very little information about this project. The website shows that there are a lot of things going on, but nothing about the Code Park project. There is a video where I took the screenshots from.
Code 3D-Fylthrough
There is one abstract I found by the Aalen University where the idea of 3D-code visualization and virtual interaction has been described very detailed. The screenshots I see here come quite close to the main idea that I had and that I will describe in the next chapter. The parts of the code are displayed as real buildings with structure and windows.

3D world of Code

3D world buildings
VR Code City
I wrote a lot about existing projects, metrics and I hope you got an idea of what could be.
Now I would like to give you some idea of how code visualization, virtual reality and gamification might come together...
Up to now we learned, that buildings are a good idea to visualize code. The last chapter comes quite near to my idea of how a I imagine a real cool 3D source code world. The buildings are not only blocks but buildings that look like buildings with windows and some architecture. At least they have only four dimensions:
- width
- length
- height
- colour
If you walk through this city then there could be code of arms or emblems of all contributors of this class. The person that last changed the object could be highlighted by a fire ring or purple glowing mist.
building types and attributes
Objects that someone is working on can have a scaffold around it.

Building someone is working on
Classes that haven't been changed for years and do not have clean code might look like this:

old building with unclean code
If there are a lot of changes and abapOpenChecks has no "errors" then the building could look like this:

beautiful code object
The programs behind the most or common used transaction could be placed in the middle of the city or directly at the harbour so it can be accessed easily:

often used objects
Special Metrics
Buildings can have attributes that clearly show some metrics:
- A test coverage of 100% is sourrounded by green mist while objects w/o unit test are on fire.
- Open issues for an object can be visualized by a shiny red laser beam pointing to the sky.
- The more often an object has been changed the wider and better the way to it. If the object hasn't been changed for years then you might need a machete to get into the house.
System visualization
If you can visualize separate programs, transactions and classes, then it might also be useful to display other objects like dictionary tables or maintenance views. Tables could be displayed as tanks or storage houses. The more data in it the bigger the storage.


storages (big and small)
Periodic jobs could be buses, trains or horse carts driving through the streets. Also processes could be visualized by moving objects. Although I have no idea of how to retrieve the data for it...Modules might be districts of the city.
Pictures taken from game Anno 1404 with help of http://annowelt.eu/
VR code fights
As mentioned in the beginning, the GLADIUS project wants to make the programmer fight for better coding. What, if you could fight the Code Inspector monster by changing as many CI findings in a given amount of time. You could challenge your colleagues at the end of the day to find the worst problem or the most important issue. In half an hour you will have to fight as many issues or findings as possible. At the end of the day you made a building better, more beautiful then it was before.
The code inspector findings of a class could be a monster with as many arms as there were findings. And if I talk about monsters, there is one ABAP programmer who is specialized in monster who might have fun to build them in 3D: bfeeb8ed7fa64a7d95efc21f74a8c135 your turn... 😉

code insepctor monsters
Conclusion
At first glance all of this might be too much effort for having fun at work. But I am convinced, that some good visualizations, metrics and game rules can provide much better and stable code. This 3D Fylthrought might be a big overload but, hey, this is a dream. 😉 And modelling and interaction is not that complicated using the unreal engine or unity. The art will be to build houses dynamically and nevertheless beautiful. Plus showing relevant information and visualize changes when code was improved. VR and coding should also be possible as there are at least three different virtual desktop apps which make it possible to view the PC desktops in a virtual environment.
Of course no one would spend so much effort to design and build such a fantasy landscape of an ERP code base... Or maybe some day?
majcon had this dream already some years ago. Let's see if this dream will come true someday...
- SAP Managed Tags:
- SAP Community
28 Comments
You must be a registered user to add a comment. If you've already registered, sign in. Otherwise, register and sign in.
Labels in this area
Top kudoed authors
| User | Count |
|---|---|
| 5 | |
| 2 | |
| 1 | |
| 1 | |
| 1 | |
| 1 | |
| 1 | |
| 1 | |
| 1 | |
| 1 |