
- SAP Community
- Products and Technology
- Enterprise Resource Planning
- ERP Blogs by Members
- Creating KPI reports using Custom Queries
Enterprise Resource Planning Blogs by Members
Gain new perspectives and knowledge about enterprise resource planning in blog posts from community members. Share your own comments and ERP insights today!
Turn on suggestions
Auto-suggest helps you quickly narrow down your search results by suggesting possible matches as you type.
Showing results for
former_member40
Participant
Options
- Subscribe to RSS Feed
- Mark as New
- Mark as Read
- Bookmark
- Subscribe
- Printer Friendly Page
- Report Inappropriate Content
12-28-2020
4:21 PM
Introduction
The Fiori app Manage KPIs and Reports allows us to create KPIs and smart business reports in a flexible way, using charts, tables, and a combination of them, resulting in objective reports, easy to navigate, and with real time information.
But to create a report that fits your goals, selecting the correct datatasource is fundamental. SAP has delivered a list of existing datasources already available to be used in smart reports. But usually, its necessary to adapt the queries with your own custom dimensions and measures.
There are very good blog posts that explain how to create smart reports. But in this post I will explain how to create a Generic Drill Down report, emphasizing some important aspects that needs to be taken into consideration when using customized queries, especially when you want to compare actual and planned measures combined with dimensions.
Landscape:
SAP S/4Hana on premise 1909
Scenario:
This scenario uses Financial data from a customized query.
I will describe in a logical order, to make it clear what are all the pre-requisites to have success on the Report creation.
The datasource that I chose, I created using the app “Custom analytical Queries” and is based on the data from the Composite view I_ActualPlanJrnlEntryItemCube.
In my last post https://blogs.sap.com/2020/07/27/creating-reports-using-app-custom-analytical-queries/ I detailed how to create the custom query.
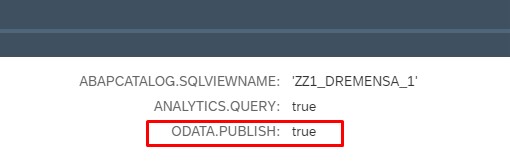
To be able to use the Query in Smart reports, it must be exposed to Odata Service.
It means that the query must have a path in tcode SICF for /default_host/sap/opu/odata/sap/
After created the query, I exposed it using tcode /IWFND/MAINT_SERVICE.
After that, the query will have the following annotation (Query view app):
In Fiori Library, all the technical details are described so you can setup the roles and catalogs for the app “Manage KPIs and Reports”:
https://fioriappslibrary.hana.ondemand.com/sap/fix/externalViewer/#/detail/Apps('F2814')/S18OP
The first thing you need to do is create a group, where you will add your KPIs and reports.
Click on “KPIs” next to the “Groups” tab and click on “+” to create it. It will ask you to select the group (previously created).
Define a name for your KPI and select the datasource

Search for your data source and select it. The fields “Odata Service” and “Entity set” will automatically be filled if you datasource are correctly exposed to Odata Service.
After selecting the datasource, you need to define the filters and measures
And you also have the option to define goals, related to fixed value ranges, measures or percentage.
After clicking on “Save and activate”, you need to save in in a package and workbench request.
In the same screen after saving the KPI, you can create you report:
Define a name for your report and click on “Configuration”:

Here, the filters previously defined in the KPI are transferred. But you can add more filter options to the report screen:

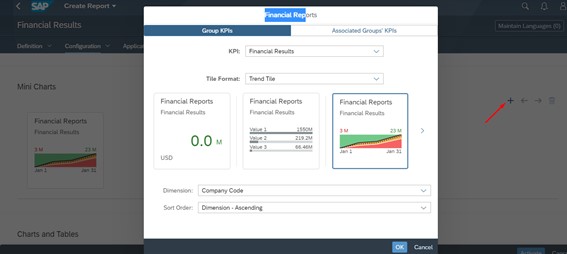
You can add mini-charts to your reports. Mini charts can give you comparisons and trends for selected measures combined to dimensions, in a simplified view:
And clicking on “Add view”, you can define charts and tables to be displayed and selected in the report:
The chart will first display consolidated data according to the KPI main filters. Click on the “settings button” and define other measures and dimensions for your view:
In this datasource, I had already created restricted and calculated measures that I can use on my views:
Note: In your previously customized query/datasource, its recommended that you create restricted measures for “Actuals” and “Planned” values. It will allow you to have more chart options, where you can combine values in 2 or more axis.
In this example I used a restricted measure “Gross Margin Actual” and “Gross Margin – Plan”, that I created in my query restricting by “Functional Area + Plan Category” (Custom Analytical Query app):
Note that for “Plan” measures, I chose “User Input Filter”, as this measure will depend on the Plan Category informed in the Query prompt.
For “Actual” Measures, the category ACT01 can be fixed as filter.
Coming back to “Manage KPI and reports” app, these measures you will allow you to select charts with 2 or more axes combinations:
Your chart will be displayed according to the dimensions and measures defined for the view:
If you select a measure without “Actual/Plan” differentiation, you will be more limited in terms of available charts. But you will be able to use dimensions like “Actual/Plan Indicator” to compare data:

In the above example, chart with “2 or more axis combinations” will not be available (bellow is a simple column chart):
You can add several views with charts/tables in the report, by clicking of the “+” button:
When the report is finished, click on “Activate”.
To create the Tile you have to leave the edit mode (after activating the report) in the report screen, and select the last tab “Applications”
Choose a tile type for your app:
Then you need to fill the Title, sub-title and the catalog, previously created (the catalog must be assigned to a role in PFCG that is assigned to the user in SU01).
You also define the refresh time for the data displayed in the tile. According to the tile type, you will need to define dimensions, object type, which will define the information that will be refreshed and displayed in the tile on your Fiori Launchpad.
At the bottom of the screen you fill the Semantic Object and “Action”. This will create a link of the tile with the Fiori Launchpad Designer, which will group the tiles in your catalog and define the URL for the specific app.
After you save the Tile, it will be available in the catalog you saved it. Search for the catalog and Tile in the “App Finder”. Add it to your group.
To be able to access the tile, you will need to go to Fiori Launchpad Designer. Use the bellow link, changing the server and port according to your system’s configuration:
https://<server>:<port>/sap/bc/ui5_ui5/sap/arsrvc_upb_admn/main.html
Find your catalog and check the Tile and Target mapping that were created:
Click on the engine icon and save it on a previously created customized request.
Go back to Fiori Launchpad and access you app!
The Fiori app Manage KPIs and Reports allows us to create KPIs and smart business reports in a flexible way, using charts, tables, and a combination of them, resulting in objective reports, easy to navigate, and with real time information.
But to create a report that fits your goals, selecting the correct datatasource is fundamental. SAP has delivered a list of existing datasources already available to be used in smart reports. But usually, its necessary to adapt the queries with your own custom dimensions and measures.
There are very good blog posts that explain how to create smart reports. But in this post I will explain how to create a Generic Drill Down report, emphasizing some important aspects that needs to be taken into consideration when using customized queries, especially when you want to compare actual and planned measures combined with dimensions.
Landscape:
SAP S/4Hana on premise 1909
Scenario:
This scenario uses Financial data from a customized query.
I will describe in a logical order, to make it clear what are all the pre-requisites to have success on the Report creation.
- Choose a datasource
- Ensure that the datasource is exposed to an Odata Service
- Check if you have the proper role to the app
- Create the KPI Group
- Create the KPI
- Create the report
- Create a Tile
- Update the tile in Sap Fiori Launchpad
- Check your report
- Choose a datasource
The datasource that I chose, I created using the app “Custom analytical Queries” and is based on the data from the Composite view I_ActualPlanJrnlEntryItemCube.
In my last post https://blogs.sap.com/2020/07/27/creating-reports-using-app-custom-analytical-queries/ I detailed how to create the custom query.
- Ensure that the datasource is exposed to Odata Service
To be able to use the Query in Smart reports, it must be exposed to Odata Service.
It means that the query must have a path in tcode SICF for /default_host/sap/opu/odata/sap/
After created the query, I exposed it using tcode /IWFND/MAINT_SERVICE.
After that, the query will have the following annotation (Query view app):
- Check if you have the proper role to the app “Manage KPIs and reports”
In Fiori Library, all the technical details are described so you can setup the roles and catalogs for the app “Manage KPIs and Reports”:
https://fioriappslibrary.hana.ondemand.com/sap/fix/externalViewer/#/detail/Apps('F2814')/S18OP

- Create the KPI Group
The first thing you need to do is create a group, where you will add your KPIs and reports.


- Create the KPI
Click on “KPIs” next to the “Groups” tab and click on “+” to create it. It will ask you to select the group (previously created).

Define a name for your KPI and select the datasource

Search for your data source and select it. The fields “Odata Service” and “Entity set” will automatically be filled if you datasource are correctly exposed to Odata Service.

After selecting the datasource, you need to define the filters and measures

And you also have the option to define goals, related to fixed value ranges, measures or percentage.

After clicking on “Save and activate”, you need to save in in a package and workbench request.
- Create the report
In the same screen after saving the KPI, you can create you report:

Define a name for your report and click on “Configuration”:
Here, the filters previously defined in the KPI are transferred. But you can add more filter options to the report screen:
You can add mini-charts to your reports. Mini charts can give you comparisons and trends for selected measures combined to dimensions, in a simplified view:
And clicking on “Add view”, you can define charts and tables to be displayed and selected in the report:


The chart will first display consolidated data according to the KPI main filters. Click on the “settings button” and define other measures and dimensions for your view:

In this datasource, I had already created restricted and calculated measures that I can use on my views:
Note: In your previously customized query/datasource, its recommended that you create restricted measures for “Actuals” and “Planned” values. It will allow you to have more chart options, where you can combine values in 2 or more axis.

In this example I used a restricted measure “Gross Margin Actual” and “Gross Margin – Plan”, that I created in my query restricting by “Functional Area + Plan Category” (Custom Analytical Query app):

Note that for “Plan” measures, I chose “User Input Filter”, as this measure will depend on the Plan Category informed in the Query prompt.

For “Actual” Measures, the category ACT01 can be fixed as filter.
Coming back to “Manage KPI and reports” app, these measures you will allow you to select charts with 2 or more axes combinations:

Your chart will be displayed according to the dimensions and measures defined for the view:

If you select a measure without “Actual/Plan” differentiation, you will be more limited in terms of available charts. But you will be able to use dimensions like “Actual/Plan Indicator” to compare data:
In the above example, chart with “2 or more axis combinations” will not be available (bellow is a simple column chart):

You also have the option to display it as a table. In this case, if you create a “Gross Margin Act/Plan difference” measure, you can add it as a 3rd axis and have an enhanced table display:

You can add several views with charts/tables in the report, by clicking of the “+” button:

When the report is finished, click on “Activate”.
- Create a Tile
To create the Tile you have to leave the edit mode (after activating the report) in the report screen, and select the last tab “Applications”

Choose a tile type for your app:

Then you need to fill the Title, sub-title and the catalog, previously created (the catalog must be assigned to a role in PFCG that is assigned to the user in SU01).
You also define the refresh time for the data displayed in the tile. According to the tile type, you will need to define dimensions, object type, which will define the information that will be refreshed and displayed in the tile on your Fiori Launchpad.
At the bottom of the screen you fill the Semantic Object and “Action”. This will create a link of the tile with the Fiori Launchpad Designer, which will group the tiles in your catalog and define the URL for the specific app.


After you save the Tile, it will be available in the catalog you saved it. Search for the catalog and Tile in the “App Finder”. Add it to your group.
To be able to access the tile, you will need to go to Fiori Launchpad Designer. Use the bellow link, changing the server and port according to your system’s configuration:
https://<server>:<port>/sap/bc/ui5_ui5/sap/arsrvc_upb_admn/main.html
Find your catalog and check the Tile and Target mapping that were created:

Click on the engine icon and save it on a previously created customized request.
Go back to Fiori Launchpad and access you app!

- SAP Managed Tags:
- SAP S/4HANA Finance,
- SAP S/4HANA Embedded Analytics
6 Comments
You must be a registered user to add a comment. If you've already registered, sign in. Otherwise, register and sign in.
Labels in this area
-
"mm02"
1 -
A_PurchaseOrderItem additional fields
1 -
ABAP
1 -
ABAP Extensibility
1 -
ACCOSTRATE
1 -
ACDOCP
1 -
Adding your country in SPRO - Project Administration
1 -
Advance Return Management
1 -
AI and RPA in SAP Upgrades
1 -
Approval Workflows
1 -
ARM
1 -
ASN
1 -
Asset Management
1 -
Associations in CDS Views
1 -
auditlog
1 -
Authorization
1 -
Availability date
1 -
Azure Center for SAP Solutions
1 -
AzureSentinel
2 -
Bank
1 -
BAPI_SALESORDER_CREATEFROMDAT2
1 -
BRF+
1 -
BRFPLUS
1 -
Bundled Cloud Services
1 -
business participation
1 -
Business Processes
1 -
CAPM
1 -
Carbon
1 -
Cental Finance
1 -
CFIN
1 -
CFIN Document Splitting
1 -
Cloud ALM
1 -
Cloud Integration
1 -
condition contract management
1 -
Connection - The default connection string cannot be used.
1 -
Custom Table Creation
1 -
Customer Screen in Production Order
1 -
Data Quality Management
1 -
Date required
1 -
Decisions
1 -
desafios4hana
1 -
Developing with SAP Integration Suite
1 -
Direct Outbound Delivery
1 -
DMOVE2S4
1 -
EAM
1 -
EDI
2 -
EDI 850
1 -
EDI 856
1 -
edocument
1 -
EHS Product Structure
1 -
Emergency Access Management
1 -
Energy
1 -
EPC
1 -
Financial Operations
1 -
Find
1 -
FINSSKF
1 -
Fiori
1 -
Flexible Workflow
1 -
Gas
1 -
Gen AI enabled SAP Upgrades
1 -
General
1 -
generate_xlsx_file
1 -
Getting Started
1 -
HomogeneousDMO
1 -
IDOC
2 -
Integration
1 -
Learning Content
2 -
LogicApps
2 -
low touchproject
1 -
Maintenance
1 -
management
1 -
Material creation
1 -
Material Management
1 -
MD04
1 -
MD61
1 -
methodology
1 -
Microsoft
2 -
MicrosoftSentinel
2 -
Migration
1 -
MRP
1 -
MS Teams
2 -
MT940
1 -
Newcomer
1 -
Notifications
1 -
Oil
1 -
open connectors
1 -
Order Change Log
1 -
ORDERS
2 -
OSS Note 390635
1 -
outbound delivery
1 -
outsourcing
1 -
PCE
1 -
Permit to Work
1 -
PIR Consumption Mode
1 -
PIR's
1 -
PIRs
1 -
PIRs Consumption
1 -
PIRs Reduction
1 -
Plan Independent Requirement
1 -
Premium Plus
1 -
pricing
1 -
Primavera P6
1 -
Process Excellence
1 -
Process Management
1 -
Process Order Change Log
1 -
Process purchase requisitions
1 -
Product Information
1 -
Production Order Change Log
1 -
Purchase requisition
1 -
Purchasing Lead Time
1 -
Redwood for SAP Job execution Setup
1 -
RISE with SAP
1 -
RisewithSAP
1 -
Rizing
1 -
S4 Cost Center Planning
1 -
S4 HANA
1 -
S4HANA
3 -
Sales and Distribution
1 -
Sales Commission
1 -
sales order
1 -
SAP
2 -
SAP Best Practices
1 -
SAP Build
1 -
SAP Build apps
1 -
SAP Cloud ALM
1 -
SAP Data Quality Management
1 -
SAP Maintenance resource scheduling
2 -
SAP Note 390635
1 -
SAP S4HANA
2 -
SAP S4HANA Cloud private edition
1 -
SAP Upgrade Automation
1 -
SAP WCM
1 -
SAP Work Clearance Management
1 -
Schedule Agreement
1 -
SDM
1 -
security
2 -
Settlement Management
1 -
soar
2 -
SSIS
1 -
SU01
1 -
SUM2.0SP17
1 -
SUMDMO
1 -
Teams
2 -
User Administration
1 -
User Participation
1 -
Utilities
1 -
va01
1 -
vendor
1 -
vl01n
1 -
vl02n
1 -
WCM
1 -
X12 850
1 -
xlsx_file_abap
1 -
YTD|MTD|QTD in CDs views using Date Function
1
- « Previous
- Next »
Related Content
- SAP S4HANA Cloud Public Edition Logistics FAQ in Enterprise Resource Planning Blogs by SAP
- Futuristic Aerospace or Defense BTP Data Mesh Layer using Collibra, Next Labs ABAC/DAM, IAG and GRC in Enterprise Resource Planning Blogs by Members
- SQL Query to Produce MRP Report in Enterprise Resource Planning Q&A
- Boost SCM Efficiency: Mat. Shelf Life Mgmt App Empowers Intelligent Decision-Making for Enterprises in Enterprise Resource Planning Blogs by SAP
- SAP S/4HANA Cloud Extensions with SAP Build Best Practices: An Expert Roundtable in Enterprise Resource Planning Blogs by SAP
Top kudoed authors
| User | Count |
|---|---|
| 5 | |
| 2 | |
| 2 | |
| 2 | |
| 2 | |
| 2 | |
| 2 | |
| 1 | |
| 1 |