In last spring, we have delivered SAP’s next generation-based Microsoft Office extension: SAP Analytics Cloud, add-in for Microsoft Office. This add-in brings an integration of Microsoft Excel Office web-based and desktop versions in SAP Analytics Cloud. You can have the flexibility of further analysis and planning on native SAP Analytics Cloud models with Microsoft Office Excel 365.
As reminder, with GA version in May, connected to SAP analytics Cloud models, it was already possible to select a model, create a report, retrieve versions write- back/revert data.
Since last May, we have delivered new capabilities and much more to come!
Let’s explore the great latest deliveries
SAP Analytics Cloud, add-in, Wave 2021.02 is available! Click and see it in action!
Six months after it’s General Availability on the market (Wave 2020.18), let’s explore the latest deliveries and new key benefits for users. See the highlights below:
- Increased agility:
- Excel Desktop and Online version are now supported for both Window and MAC IOS.
- For new tenant, the setting “Trusted origin” is checked by default, so no manual configuration is required anymore
- Update on technical configuration to follow SAP new standards for Cloud Domains – Please Read Switching to new domain
- Fasten Planning process:
- New default behavior for data entry: to better support massive data entry (or massive copy /paste) in planning process, we have introduced a new “Process” data step.
A user enters multiple values and process it, directly reflected on the grid, without waiting for the system to update between entries. This will insure performance and avoid latencies. See after data entry below:
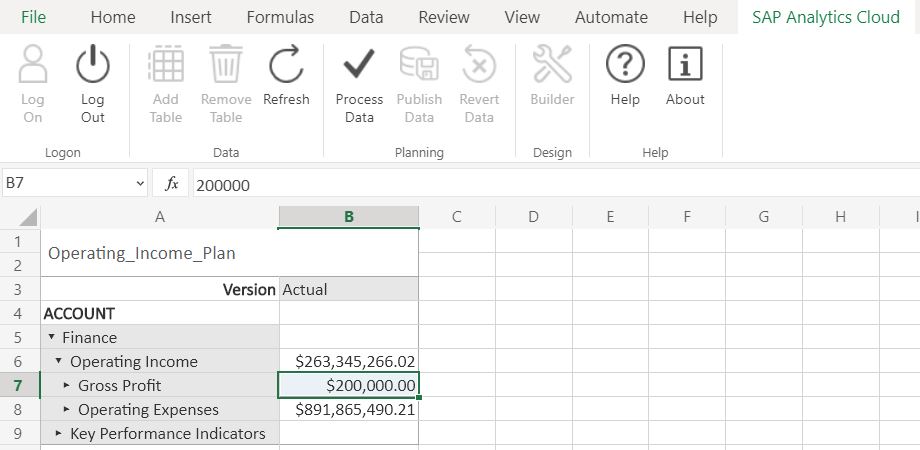
Then "processed data " are highlighted in the grid and can be published to SAP Analytics Cloud -or reverted

See more details on the feature on the Help.
- Improved Navigation and Reporting capabilities:
- Improved user experience with
- Adaptive ribbon appearance following user navigation

- New report design capabilities to improve flexibility in the grid lay-out as
- "Swap axes, Arrange Totals parent /nodes Below”
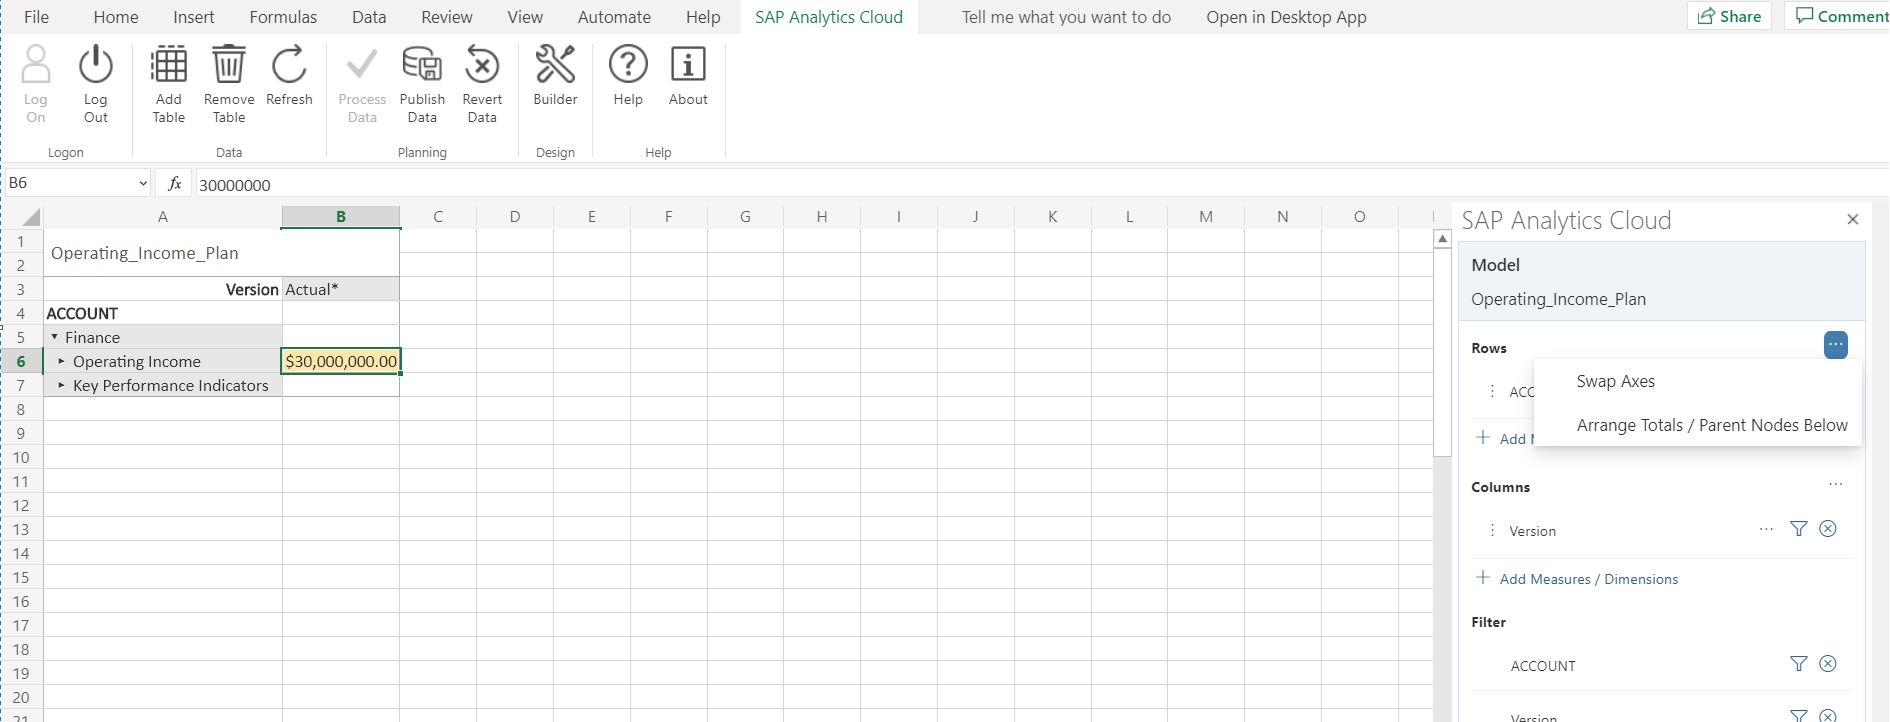
- "Sort" dimensions members by description in the report.

See more details on these features on the Help.
Road map for Q4 2020 and future direction
