
- SAP Community
- Products and Technology
- Technology
- Technology Blogs by SAP
- Track ISS with SAP Data Intelligence and SAP HANA:...
Technology Blogs by SAP
Learn how to extend and personalize SAP applications. Follow the SAP technology blog for insights into SAP BTP, ABAP, SAP Analytics Cloud, SAP HANA, and more.
Turn on suggestions
Auto-suggest helps you quickly narrow down your search results by suggesting possible matches as you type.
Showing results for
Developer Advocate
Options
- Subscribe to RSS Feed
- Mark as New
- Mark as Read
- Bookmark
- Subscribe
- Printer Friendly Page
- Report Inappropriate Content
12-04-2020
6:27 PM
The purpose of this post is purely educational.
Using SAP Data Intelligence (fka SAP Data Hub) and SAP HANA for what we will achieve is the overkill. But learning how to build data pipelines while having fun and learning something about space (what we geeks all love) should be reasonable.
To the point. This example is used as a demo in a session INT105 - Build Data Pipelines with SAP Data Intelligence at SAP TechEd 2020. You are more than welcome to join that session and to watch that demo. But it is not a prerequisite for following this post.
We want to collect data about the locations on the Earth’s globe that are directly beneath the International Space Station (ISS) ?️. This would allow us to plot these locations getting a visualization similar to below.
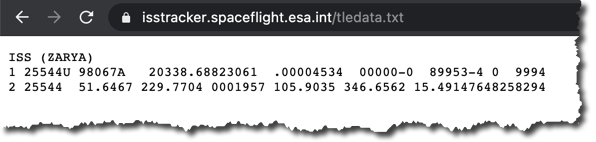
We will use an API endpoint https://isstracker.spaceflight.esa.int/tledata.txt provided by European Space Agency as the source of the ISS location. It returns a TLE (Two-line Element) record "encoding a list of orbital elements of an Earth-orbiting object for a given point in time, [called] the epoch." (source: Wikipedia)
And further accordingly to Wikipedia: "The format was originally intended for punch cards, encoding a set of elements on two standard 80-column cards."
We will need to transform this TLE data into an Earth-based location for the current time, and for that we will use Python's Skyfield package: https://pypi.org/project/skyfield/.
SAP HANA db will be our destination to store the data for further analysis and visualization.
I'd had an instance of SAP HANA, express edition, (ver. 2.0.45 at the time) already deployed at one of the cloud providers. To have both systems co-located I deployed an instance of SAP Data Intelligence trial (ver. 3.0.0 at the time) to the same cloud provider in the same region.
Please note that deployment options and the choice of a IaaS vendor are not relevant in this scenario as long as an instance of SAP Data Intelligence can communicate with the instance of SAP HANA and you can access data in the SAP HANA db from an external client.
For the sake of simplicity I will use
I would recommend you go through the following tutorials, if not yet familiar with SAP Data Intelligence at all:
For the steps that follow I assume you have some familiarity with the basics of SAP Data Intelligence now. I will not detail every small task or an icon to click below.
Create a new graph in the Modeler application.
Switch to the JSON view of the graph and paste the following code.
This will import the initial graph.
Now switch back to the Diagram view and click the Auto-Layout icon.
In the imported pipeline check the configuration of the HTTP Client operator:
Save the graph with the name
Once the graph is saved (and only then) you can execute it.
It might take a bit longer the first time while SAP Data Intelligence builds containers to run the graph. But once you see the status changed to
You should see new TLE records polled from the source API endpoint every 10 seconds.
If you look into the UI of the second Wiretap, then you should see exactly the same records there. That's because in this initial graph the
Let's modify the code to transform the TLE record into a record that contains a timestamp plus a latitude and a longitude of the ISS location projected on the Earth surface.
Stop the running graph, and open a script of the
A few additional comments about the code:
Save the graph.
But it is to early to run it yet. If you try to run this graph, it will fail with the error:
The Python package
Go to Repository and right click on
Call it
... and include the following code.
Please note the use of
In a Configuration panel add a tag
Save it and refresh the Repository panel. You should see two files --
Go back to the graph's diagram and include a Python operator to a group.
Do not be confused that a group contains only one operator. A group allows defining additional configurations.
In the configuration of the group add the same tag as assigned to the Dockerfile, i.e.
Run the graph. It will take a few minutes longer to start because it needs to build a new container image based on the Dockerfile we have defined.
Open the UI of the second Wiretap to see transformed messages, when the graph is running.
In the next episode we will add operators to the graph to persist this transformed data in SAP HANA database.
Stay healthy ❤️ everyone,
-Vitaliy (aka @Sygyzmundovych)
Using SAP Data Intelligence (fka SAP Data Hub) and SAP HANA for what we will achieve is the overkill. But learning how to build data pipelines while having fun and learning something about space (what we geeks all love) should be reasonable.

This selfie in NASA astronaut's suit is as far into space as I have been...
To the point. This example is used as a demo in a session INT105 - Build Data Pipelines with SAP Data Intelligence at SAP TechEd 2020. You are more than welcome to join that session and to watch that demo. But it is not a prerequisite for following this post.
The scenario
We want to collect data about the locations on the Earth’s globe that are directly beneath the International Space Station (ISS) ?️. This would allow us to plot these locations getting a visualization similar to below.

We will use an API endpoint https://isstracker.spaceflight.esa.int/tledata.txt provided by European Space Agency as the source of the ISS location. It returns a TLE (Two-line Element) record "encoding a list of orbital elements of an Earth-orbiting object for a given point in time, [called] the epoch." (source: Wikipedia)
And further accordingly to Wikipedia: "The format was originally intended for punch cards, encoding a set of elements on two standard 80-column cards."
We will need to transform this TLE data into an Earth-based location for the current time, and for that we will use Python's Skyfield package: https://pypi.org/project/skyfield/.
SAP HANA db will be our destination to store the data for further analysis and visualization.
The setup
I'd had an instance of SAP HANA, express edition, (ver. 2.0.45 at the time) already deployed at one of the cloud providers. To have both systems co-located I deployed an instance of SAP Data Intelligence trial (ver. 3.0.0 at the time) to the same cloud provider in the same region.
Please note that deployment options and the choice of a IaaS vendor are not relevant in this scenario as long as an instance of SAP Data Intelligence can communicate with the instance of SAP HANA and you can access data in the SAP HANA db from an external client.
For the sake of simplicity I will use
SYSTEM users in both system. Needless to say it is a very bad practice. And never do this in Production!Prerequisites
I would recommend you go through the following tutorials, if not yet familiar with SAP Data Intelligence at all:
- Navigate SAP Data Intelligence: https://developers.sap.com/tutorials/dataintelligence-trial-v2-navigation.html
- Build your first pipeline: https://developers.sap.com/tutorials/dataintelligence-trial-v2-pipelines-part01.html
For the steps that follow I assume you have some familiarity with the basics of SAP Data Intelligence now. I will not detail every small task or an icon to click below.
Initial pipeline in SAP Data Intelligence Modeler
Create a new graph in the Modeler application.
Switch to the JSON view of the graph and paste the following code.
{

    "description":"ISS locations",

    "processes":

    {

        "python3operator1":{"component":"com.sap.system.python3Operator","metadata":{"label":"Python3 Operator","extensible":true,"config":{"script":"def on_tle(tle_data):\n    api.send(\"location\", tle_data)\n\napi.set_port_callback(\"tle\", on_tle)"},"additionalinports":[{"name":"tle","type":"string"}],"additionaloutports":[{"name":"location","type":"message"},{"name":"debug","type":"string"}]}},

        "httpclient1":{"component":"com.sap.http.client2","metadata":{"label":"HTTP Client","config":{"pollingEnabled":true,"postConnection":{},"getConnection":{"connectionProperties":{"host":"isstracker.spaceflight.esa.int","port":443,"protocol":"HTTPS","authenticationType":"NoAuth"},"path":"tledata.txt","configurationType":"Manual"},"getPeriodInMs":10000}}},

        "wiretap1":{"component":"com.sap.util.wiretap","metadata":{"label":"Wiretap","ui":"dynpath","config":{}}},

        "tostringconverter1":{"component":"com.sap.util.toStringConverter","metadata":{"label":"ToString Converter","config":{}}},

        "wiretap3":{"component":"com.sap.util.wiretap","metadata":{"label":"Wiretap","ui":"dynpath","config":{}}}

    },

    "connections":[{"src":{"port":"out","process":"httpclient1"},"tgt":{"port":"in","process":"wiretap1"}},{"src":{"port":"out","process":"wiretap1"},"tgt":{"port":"ininterface","process":"tostringconverter1"}},{"src":{"port":"outstring","process":"tostringconverter1"},"tgt":{"port":"tle","process":"python3operator1"}},{"src":{"port":"location","process":"python3operator1"},"tgt":{"port":"in","process":"wiretap3"}}],"inports":{},"outports":{},

    "groups":[],

    "properties":{}

}
This will import the initial graph.
Now switch back to the Diagram view and click the Auto-Layout icon.

In the imported pipeline check the configuration of the HTTP Client operator:
- It is already set to poll every
10seconds... - ...from
https://isstracker.spaceflight.esa.int/tledata.txtusing theGETmethod.

Ingest data from the API endpoint
Save the graph with the name
community.sample.iss and a category Community Samples.
Once the graph is saved (and only then) you can execute it.
It might take a bit longer the first time while SAP Data Intelligence builds containers to run the graph. But once you see the status changed to
Running then right click on the first Wiretap to open it's UI.
You should see new TLE records polled from the source API endpoint every 10 seconds.

Transform data with Python operator
If you look into the UI of the second Wiretap, then you should see exactly the same records there. That's because in this initial graph the
Python3 operator simply sends to the output port location exactly the same information it receives on the input port tle.def on_tle(tle_data):
api.send("location", tle_data)
api.set_port_callback("tle", on_tle)Let's modify the code to transform the TLE record into a record that contains a timestamp plus a latitude and a longitude of the ISS location projected on the Earth surface.
Stop the running graph, and open a script of the
Python3 Operator. Replace existing code with the following.# Import dependencies
from skyfield.api import Topos, load, EarthSatellite
import datetime
# Decoding input and formatting output
def on_tle(tle_data):
l1, l2, l3 = tle_data.strip().splitlines()
ts = load.timescale()
satellite = EarthSatellite(l2, l3, l1, ts)
pytime_now=datetime.datetime.now(datetime.timezone.utc)
ts_now=load.timescale().from_datetime(pytime_now)
geocentric = satellite.at(ts_now)
subpoint = geocentric.subpoint()
timestamp = pytime_now
location = [
{
"TSTMP" : pytime_now.strftime('%Y-%m-%d %H:%M:%S.%f'),
"LAT" : subpoint.latitude.degrees,
"LON" : subpoint.longitude.degrees,
"ALT" : int(subpoint.elevation.m)
}
]
# api.send("debug", str(satellite))
api.send(
"location",
api.Message(location, {"Satelite": str(l1)})
)
# Callback(s)
api.set_port_callback("tle", on_tle)A few additional comments about the code:
- Although TLE literally means "two lines" we need to split it into three lines, as the first one contains the human-readable name of the Earth satellite.
- TLE record is not updated all the time. It contains the orbital elements at the specific time, called epoch, and the actual position can be calculated for +/- 24 hours with a good precision. Here we calculate for the current time stamp only (again, this is an exercise building graphs).
- The
locationis an array, not just a dictionary here, because this is what we will need later for an SAP HANA operator. TSTMPis formatted to be compatible with SAP HANA timestamp format.
Save the graph.
But it is to early to run it yet. If you try to run this graph, it will fail with the error:
Graph failure: operator.com.sap.system.python3Operator:python3operator1: Error while executing Python Operator's user provided script: No module named 'skyfield' [line 2]Define a container image
The Python package
skyfield is missing in the run-time container environment. We need to build a container image that includes the required package and tell the Python operator to use it during a run-time.Go to Repository and right click on
dockerfiles. Chose Create Docker File.
Call it
samples.skyfield...
... and include the following code.
FROM $com.sap.sles.base

RUN pip3 install --user skyfield
Please note the use of
--user flag in pip as an access to the root user is not possible for security reasons.In a Configuration panel add a tag
skyfield.
Save it and refresh the Repository panel. You should see two files --
Dockerfile and Tags.json -- created under dockerfiles.samples.skyfield folder.Build and use a container image
Go back to the graph's diagram and include a Python operator to a group.
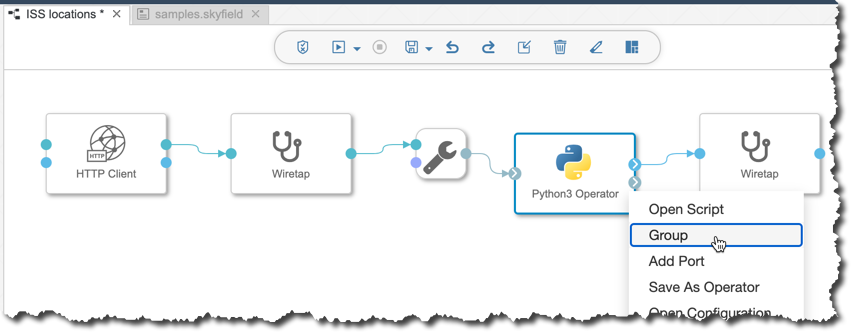
Do not be confused that a group contains only one operator. A group allows defining additional configurations.
In the configuration of the group add the same tag as assigned to the Dockerfile, i.e.
skyfield.
Run the graph. It will take a few minutes longer to start because it needs to build a new container image based on the Dockerfile we have defined.

Open the UI of the second Wiretap to see transformed messages, when the graph is running.

In the next episode we will add operators to the graph to persist this transformed data in SAP HANA database.
Stay healthy ❤️ everyone,
-Vitaliy (aka @Sygyzmundovych)
- SAP Managed Tags:
- SAP Data Intelligence,
- Python,
- SAP TechEd,
- SAP HANA,
- SAP HANA, express edition
Labels:
2 Comments
You must be a registered user to add a comment. If you've already registered, sign in. Otherwise, register and sign in.
Labels in this area
-
ABAP CDS Views - CDC (Change Data Capture)
2 -
AI
1 -
Analyze Workload Data
1 -
BTP
1 -
Business and IT Integration
2 -
Business application stu
1 -
Business Technology Platform
1 -
Business Trends
1,661 -
Business Trends
87 -
CAP
1 -
cf
1 -
Cloud Foundry
1 -
Confluent
1 -
Customer COE Basics and Fundamentals
1 -
Customer COE Latest and Greatest
3 -
Customer Data Browser app
1 -
Data Analysis Tool
1 -
data migration
1 -
data transfer
1 -
Datasphere
2 -
Event Information
1,400 -
Event Information
64 -
Expert
1 -
Expert Insights
178 -
Expert Insights
273 -
General
1 -
Google cloud
1 -
Google Next'24
1 -
Kafka
1 -
Life at SAP
784 -
Life at SAP
11 -
Migrate your Data App
1 -
MTA
1 -
Network Performance Analysis
1 -
NodeJS
1 -
PDF
1 -
POC
1 -
Product Updates
4,577 -
Product Updates
327 -
Replication Flow
1 -
RisewithSAP
1 -
SAP BTP
1 -
SAP BTP Cloud Foundry
1 -
SAP Cloud ALM
1 -
SAP Cloud Application Programming Model
1 -
SAP Datasphere
2 -
SAP S4HANA Cloud
1 -
SAP S4HANA Migration Cockpit
1 -
Technology Updates
6,886 -
Technology Updates
404 -
Workload Fluctuations
1
Related Content
- 10+ ways to reshape your SAP landscape with SAP BTP - Blog 4 Interview in Technology Blogs by SAP
- 10+ ways to reshape your SAP landscape with SAP Business Technology Platform – Blog 4 in Technology Blogs by SAP
- Harnessing the Power of SAP HANA Cloud Vector Engine for Context-Aware LLM Architecture in Technology Blogs by SAP
- Possible Use Cases Of ECC & S/4HANA Connection With SAP Datasphere. in Technology Q&A
- Deliver Real-World Results with SAP Business AI: Q4 2023 & Q1 2024 Release Highlights in Technology Blogs by SAP
Top kudoed authors
| User | Count |
|---|---|
| 13 | |
| 10 | |
| 10 | |
| 7 | |
| 7 | |
| 6 | |
| 6 | |
| 5 | |
| 5 | |
| 4 |