
Technology Blogs by SAP
Learn how to extend and personalize SAP applications. Follow the SAP technology blog for insights into SAP BTP, ABAP, SAP Analytics Cloud, SAP HANA, and more.
Turn on suggestions
Auto-suggest helps you quickly narrow down your search results by suggesting possible matches as you type.
Showing results for
former_member75
Participant
Options
- Subscribe to RSS Feed
- Mark as New
- Mark as Read
- Bookmark
- Subscribe
- Printer Friendly Page
- Report Inappropriate Content
11-18-2020
12:04 AM
This blog covers the new features and enhancements in the SAP Analytics Cloud and SAP Digital Boardroom Q3 2019 Release.
Please note that the Analytics Cloud Help documentation is updated at the same time as the upgrade to this release, so the links here may not yet reflect what is described below until after the upgrade is complete.
Make sure to Upgrade your SAP Analytics Cloud agent to the latest agent version 1.0.237 to take advantage of all the data acquisition types. These are the data acquisition minimum requirements:
- Version 1.0.99 for SAP ERP / SQL databases
- Version 1.0.91 for SAP Universe (UNX)
- Version 1.0.233 for SAP Business Warehouse (BW)
- Version 1.0.75 for all other data source types
For more information, see the SAP Analytics Cloud System Requirements and Technical Prerequisites.
SAP Analytics Cloud fully supports Microsoft Edge and Google Chrome for all activities and areas of SAP Analytics Cloud including viewing, authoring and administration.
Highlighted Feature Updates:
The features listed in the highlights section are the top feature enhancements in Q3 2019
- Administration & Infrastructure:
- Analytics Designer:
- Debug mode
- Define filter lines for different input data in R-visualization widgets
- Geo map widget enhancements
- Set widget size and position according to application logic and canvas size
- Define theme
- Panel widget
- Data analyzer
- Data Integration:
- SAP S/4HANA exports run in the background
- Maintain BW member order in Global Dimensions
- Replicating data from SAP HANA
- Data Visualizations:
- Export tables into Excel files
- Prevent Viewers from Removing Non-Modifiable Story Filters
- Dynamic time filter workflow enhancements
- Dynamic time offset for page and story filters
- Enhanced Linked Analysis
- Cross calculation for currency conversion in charts
- Variance as a Data label for line, radar, scatterplot, heatmap and more
- Display percentages or absolute values in Pie/Donut Charts
- Prioritize front bar data labels in layered bar charts
- Dynamic text for any dimension
- Explorer in Embedded mode
- General Updates:
- Intelligent Enterprise:
- Extended support for live BW blending use cases
- Version to version variance & Waterfall chart support for SAP BW live data
- Hierarchy geo map visualizations for SAP BW
- Planning:
- Turn calendar tasks into recurring tasks
- Default mass data entry
- Calendar keyboard support
- Enhanced visualization of child tasks within a process
- Context for calendar tasks and processes
- Generate tasks or processes with the Calendar wizard
- Parameters for data actions and advanced formulas
- Smart Assist:
- Search to Insight brand-new user experience
- Smart Insights on tables
- Search to insight for BW & S/4 HANA Live Data Models
Additional Feature Updates:
- Administration & Infrastructure:
- User & team provisioning API improvements for user properties
- Add, remove, and reset folders & file permissions with inheritance
- Edit the sharing settings for samples
- Edit the default permissions that users & teams have on the Public folder
- Users’ API provisioning enhancements
- Two-legged OAuth Support
- Analytics Designer:
- Change cell values in your tables at runtime
- Copy and paste technical components
- Renaming enhancements
- Specify simple or advanced mode on your dialogue
- BPC planning sequence widget improvements
- Data Integration:
- Import larger volumes of transactional data from BPC
- Import data from Egnyte, Amazon S3, Dropbox and OneDrive
- Import data file size improvements
- Data export improvements
- Data Visualization:
- On-demand Loading of Inactive Values on Story and Page Filters
- Optimized performance for open-ended and dynamic date range filters
- Optimized Geo performance when Clustering is enabled
- Stacked bar chart without dimension axis
- Input controls for multiple cross calculations for tables
- Performance improvement for clustered geo map
- New default for story & page time range filters
- Add comments without saving your story
- Add comments to an embedded story
- Intelligent Enterprise:
- Sort measure values with two-structure analytic queries with live BW data connection models
- Performance improvements for BW
- Enable currency conversions during SAP BW remote connections
- Tuple filters for charts and tables when drilling down
- Mobile:
- Modelling:
- Planning:
- Create a Forecast or Rolling Forecast with the Builder Panel
- Empty cells are treated as unbooked cells during copy and paste
- Multiple date dimensions in planning models
- Booked mode enhancements
- Change calendar tasks to processes and vice versa
- Copy and paste in your tables with live BPC
- Enter data into empty cells while using advanced filters
- New keyboard shortcuts in Gantt charts
- Copy and paste enhancements for aggregation accounts
- Dynamically select leaves for a hierarchy
- Data locking task in Calendar mode
- Attribute function
- Performance enhancements in advanced formulas
- Visual formula enhancements
- Smart Assist:
Highlighted Feature Updates:
Administration & Infrastructure
Featured files on the home page
Free featured files feature finding its feet for future freedom from file finding. Say that fast three times! In other words, now you can access files from a featured files tile on the homepage for quick access, saving you time from looking through folders. Featured files will be dynamic based on sharing settings, so team members can edit who sees which file and each user will only see their accessible files on the homepage. Fantastic!

Administrators can audit changes made to files’ sharing settings
The Activities log is now updated to show details for any changes that are made to the Sharing Settings of files stored under Browse > Files.
These include:
- The name of the object whose permissions were changed
- The permissions that were granted/revoked and to which specific user/team
- The user who made the change
- The timestamp of the change
This will allow for the administrators to view their sharing settings history and ensure that their users never forget 2 + 2 = 5. #BigBrotherIsWatchingYou

Analytics Designer
Debug mode
We’ve now added the ability to debug scripts in the browser script debugger. Gone are the days of loading up other programs!

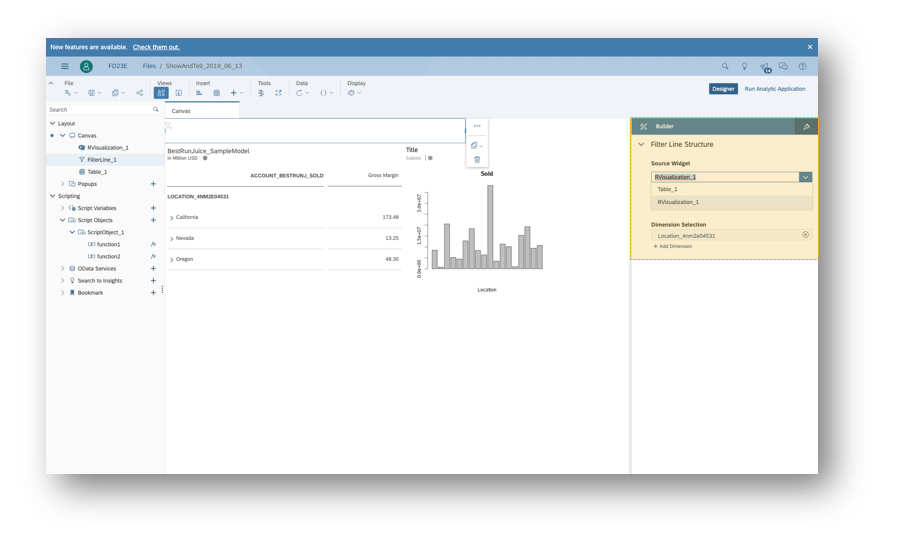
Define filter lines for different input data in R-visualization widgets<>
This new feature is fresher than the Price of Bel Air, so hang on because you Will be blown to Smithereens. When you use R-visualization widgets in Analytics Designer, you can now add filter lines directly to the widget without having to work around using hidden tables. Now if you’d like to take a minute, just sit right there, and enjoy all this extra time we gave you to spare!
Geo map widget enhancements
With this update, geo maps will work in Analytics Designer just like they do in Stories! The geo maps will support additional quick menu entries such as full screen, drilling in the Choropleth layer, and filters. We are also adding two new API calls with many more on the way! This should make several people very hAPI.

Set widget size and position according to application logic and canvas size
As an application designer, you’ll be able to allow application users to dynamically set a widget’s size and position according to application logic and canvas size using the layout-related APIs. Alternatively, users can change the widget width, height, and position statically using the Styling Panel. If only I could set my height this easily…

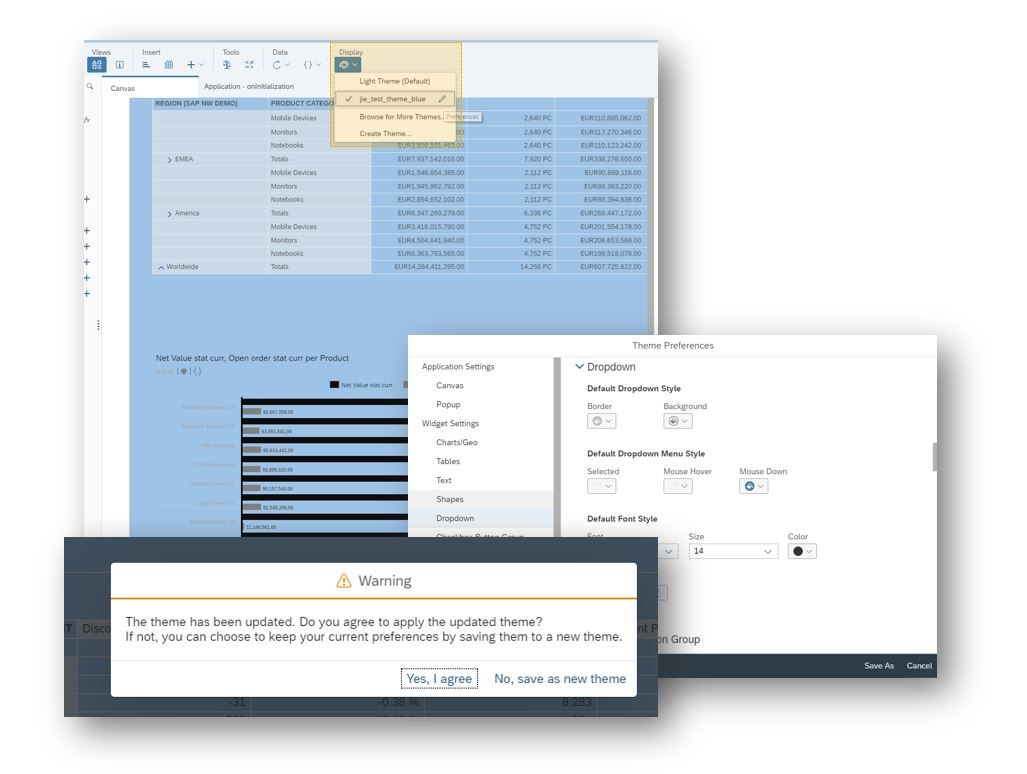
Define theme
Application designers can now define, load, or edit a theme at application design time, as well as store all the widget settings in a theme. The theme will be stored in the file repository and can be reused in any other analytical application, though owner permissions will be required to make any changes.
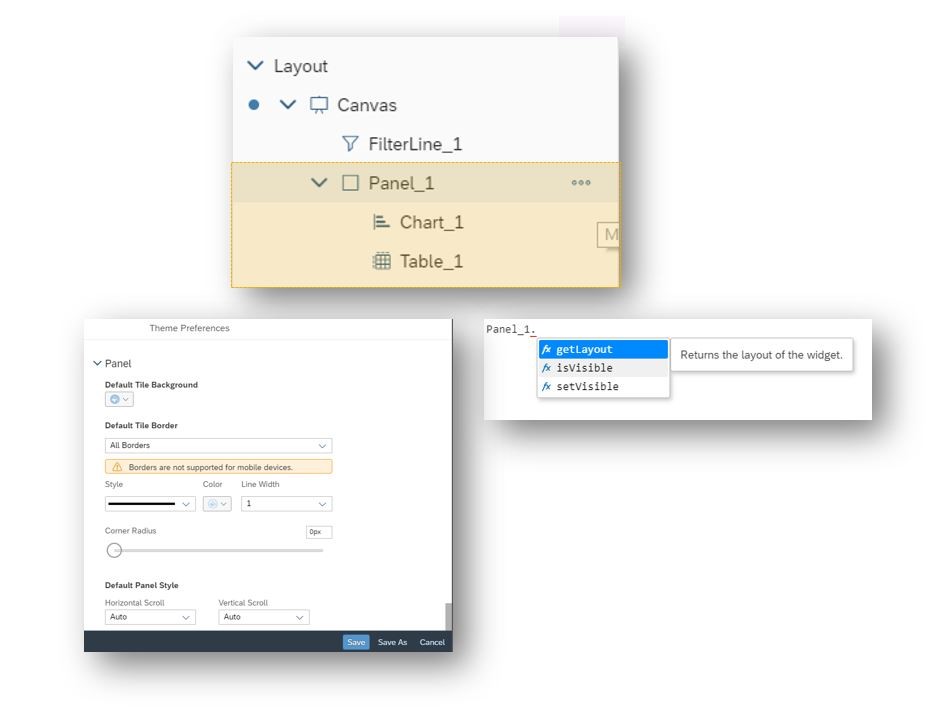
Panel widget
This update also brings panels to Analytics Designer, enabling you to create a container for grouping widgets together. This will help move multiple widgets around easier, instead of having to move them all individually. You can think of it like the Avengers, they’re good individually, but when you hear “Avengers assemble!” you know it’s about to get even better!
Data analyzer
The data analyzer is a predefined ready-to-run service for SAP BW queries. You can use the Builder panel and the Available Items area to navigate and analyze your data by adding and removing dimensions from the table, filtering for items, and changing its display and sort order.

Data Integration
SAP S/4HANA exports run in the background
The time has come, after more than 25 years we can finally tell Forrest that he gets to stop running. From this point onwards, SAC will do all the running in the background when it comes to exporting to S/4HANA, allowing you to focus on more important things such as thinking about life, and how it resembles a box of chocolates…

Maintain BW member order in Global Dimensions
Consistency is key. That’s why SAC now maintains member order when acquiring BW Global Dimension hierarchies, saving you time and keeping everything exactly where you left it. Because like I said: consistency is pivotal!

Replicating data from SAP HANA
You can now import data via the new SAP HANA driver, giving you more flexibility with SAP HANA sources so you can choose whether to import or use a live connection.
Key details:
- Data can be acquired from:
- All view types via the Query Builder
- All tables and procedures via Freehand SQL
- Supports single or multi-container
- Requires setup of SAP Cloud Agent and SCC

Data Visualizations
Export tables into Excel files
Are you a spreadhead and do you love spreadsheets? Even if you just like spreadsheets, now you can export tables in point-of-view scope into Excel, as well as to CSV. We also support export in Explorer mode too!

Prevent Viewers from removing Non-Modifiable Story Filters
Guess what we have in store-y for you! To increase the designer’s control, you now have the option to disable the ability for viewers to remove non-modifiable story filters. S(t)orry not s(t)orry!


Dynamic time filter workflow enhancements
Users can now create dynamic time filters and calculations faster than the Millennium Falcon escaping Hoth. These filters and calculations can also be adjusted for different levels of granularity (i.e. Periods) with fewer steps than before.
Period selections include:
- Current
- Previous
- Next
- Current & Previous
- Current & Next
- Wookie (Only available in the special Chewbacca edition of SAC)

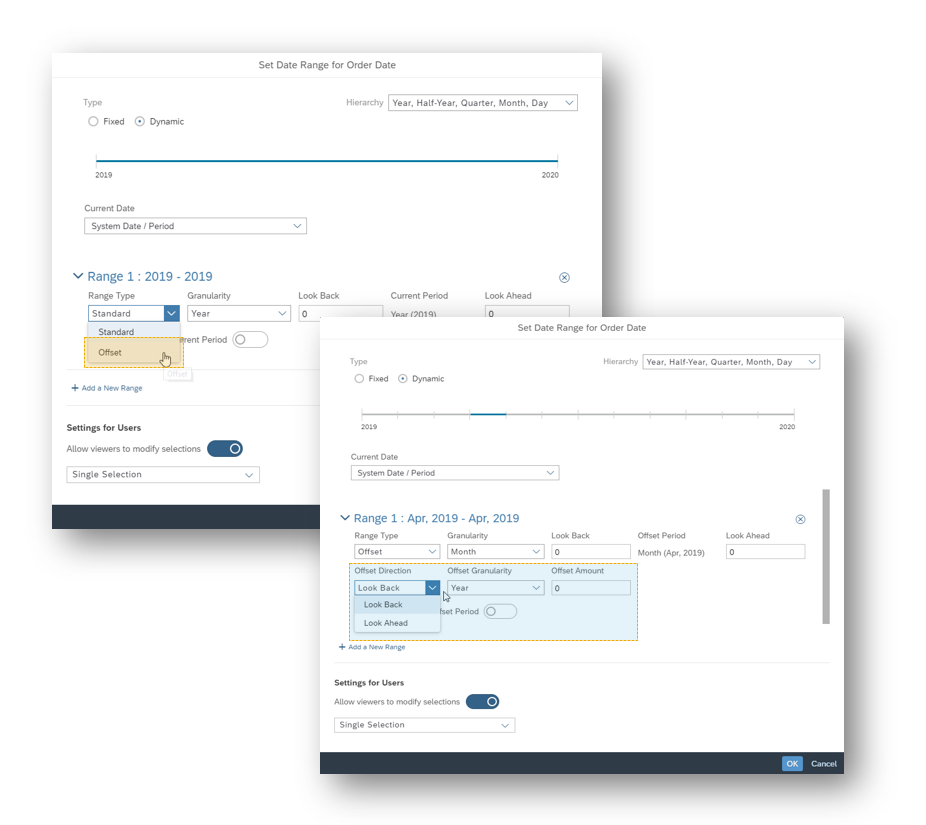
Dynamic time offset for page and story filters
We hope you’re ready to unleash your inner Marty McFly because SAC is going Back to the Future! Story designers can now create dynamic time filters with offsets for months and years to fine tune exactly which time periods you want on your dashboard. Has anyone seen my DeLorean?
Enhanced linked analysis
Where did you come from, where did you go? Now linked analysis has gotten more pro! A more intuitive design allows users to access linked analysis via the quick action bar, rather than the toolbar. And story designers have greater control and flexibility to select which widgets can be included in linked analysis. This enhancement allows more than one linked analysis group per page!

Cross calculations for currency conversion in charts
What’s the one currency Superman can’t hold? Kryptocurrency. Luckily though, he can convert it all to USD with SAC’s new currency conversion models in charts! This will allow story designers to create currency conversion calculations for each desired currency, making it even easier to interact with global currencies.

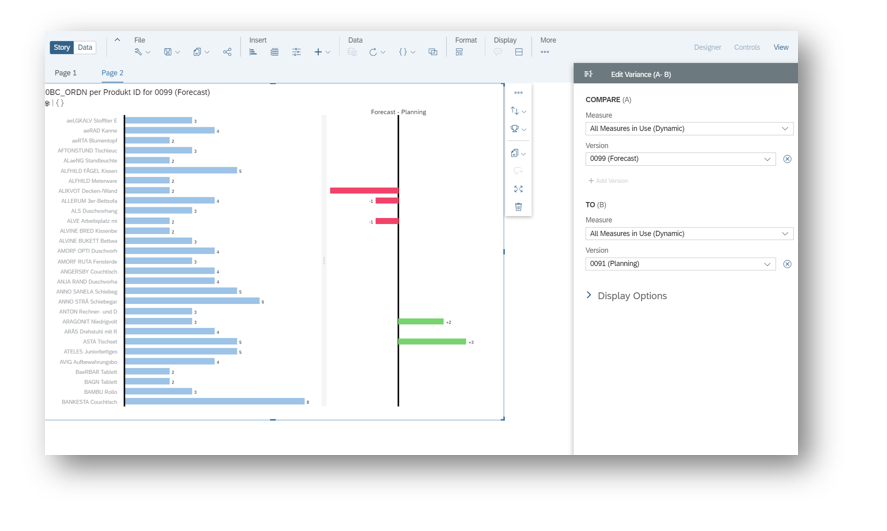
Variance as a Data label for line, radar, scatterplot, heatmap and more!
We’ve now enabled support for adding data labels to several charts, which is perfect for comparing performance between two data figures. Say, for example, you’re running a shipping company and want to see how two of your ships, the Olympia and Titanic, are doing. You can now show the variance as a data label directly in your scatterplot, letting you see more than just the tip of the iceberg. Now that’s what I call a monumental advancement, some might even call it Titanic… Too soon?

Display percentages or absolute values in Pie/Donut Charts
You can now easily toggle between percentage and absolute values to be displayed in your Donut or Pie Charts, and for the Donut Charts you can also choose to display the total aggregate amount in the center, making it easier to visualize your data. Oh, and don’t worry, these donuts are zero calorie, gluten free, free-range, organic, cruelty-free, non-lactose and biodegradable, so feel free to make as many as you wish!

Prioritize front bar data labels in layered bar charts
Story designers can now prioritize the bars in a visualization to show the front bar’s data labels only, making it easier to view your information. Now this is a change I can get behind, or in front?

Dynamic text for any dimension
This will give you the ability to create dynamic text from a Dimension rather than a single filter or input control. Dynamic text will also include the dimension member(s) selected when using linked analysis. For example, when applying a single member page filter in your story, you can build a report style dashboard that dynamically changes your text based on what’s being filtered and shown on screen.

Explorer in Embedded mode
Viewers can now access explorer mode in embedded view as long as the story designer enables the feature. This will make it easier for viewers to investigate data beyond existing charts.

General Updates
Multilingual content support
Bonj-ello!
You can now translate user-defined fields for a given story, with appropriate permissions. Make sure to first enable translation from your System configuration as an Administrator, then you can assign translation roles to any users in your organization. From here, these users can mark stories for translation, ensuring that they appear in the new Translation tab within the Browse menu. This Translation tab will hold all the XLF files for the marked stories, which can then be translated using third party translators to help speed up the process! There is also a new manual translation interface for small changes and edits after you’ve translated the XLF file. Now, users from across the world will be able to share and consume stories with ease!

Intelligent Enterprise
Extended support for live BW blending use cases
We now support extended use cases for blending with live SAP BW data. Our supported use cases extend to the following scenarios:
- Multiple live BW models from same/different BW systems
- Multiple model blending using imported data with live BW models
- Support live HANA SDI and browser blending
- Support BW as primary data source

Version to version variance & Waterfall chart support for SAP BW live data
Hey, how you doin’? You can now enable Joey’s powers to answer questions about how your business has changed with version to version variance and waterfall charts for SAP BW live data sources. Now that’s a real (Central) Perk!
Hierarchy geo map visualizations for SAP BW
The choropleth layer in geo maps can be used to visualize data as a hierarchy of geographical shapes with SAP BW. Lovers of drilling down rejoice!

When dynamic filters are created by a variable submission for a specific dataset, they will automatically be applied on all layers.

Planning
Turn calendar tasks into recurring tasks
You can now turn your calendar tasks into recurring tasks. It’s up to you to modify the series and you can still modify one occurrence independent of the whole series. The choice is yours. You can choose to create your recurrence hourly, daily and weekly. End your recurrences anytime you’d like – pick a specific date, after specified number of occurrences or never end it at all!

Default mass data entry
You can now enter mass data entry mode by default when making data entry changes in your table. This can be toggled on and off from the builder panel.

Calendar keyboard support
What’s better than relaxing on a beach in Maui with a Pina Colada and an all you can eat buffet, you ask? Two words: Keyboard. Shortcuts. And boy do we have some good ones for you! Check out the table below for all the great shortcuts that are now available:
| Action | Key (Windows) | Key (Mac) | Comment |
| Open copy dialog | Ctrl+C | CMD+C | Only works when no text is selected. Otherwise text is copied to clipboard. |
| Open delete dialog | Ctrl+D | CMD+D | Will open browser bookmark dialog when no calendar item is selected. |
| Update (and send) changes | Ctrl+S | CMD+S | Will open browser safe window if no pending changes exist. |
| Move to previous day/week/month | Page down | Page down | |
| Move to next day/week/month | Page up | Page up | |
| Toggle filter bar | Ctrl+Shift+F | CMD+Shift+F |
Enhanced visualization of child tasks within a process
This update brings new calendar visualizations, so you can see if processes are related to each other or if they just happen to start at the same time. This may not seem like much, but it’s like the difference between “It’s time to eat grandpa” and “It’s time to eat, grandpa”. Subtle, but important!

Context for calendar tasks and processes
With Calendar tasks you’ll now be able to set up a context that defines the first scope filter on dimensions of a specified model. This will boost productivity, making it easier to zero in on the data you need to work with.

Generate tasks or processes with the Calendar wizard
Yer a wizard Harry! You can now generate calendar tasks and processes along a driving dimension using a wizard. This should help save lots of time when creating batches of events, allowing you to go back to creating potions or playing Quidditch.

Parameters for data actions and advanced formulas
When you’re creating a data action, you can now create parameters and add them to any of the steps of your data action. You can use parameters to create prompts for users in stories or to quickly update a fixed member value or number in several different places throughout the data action.
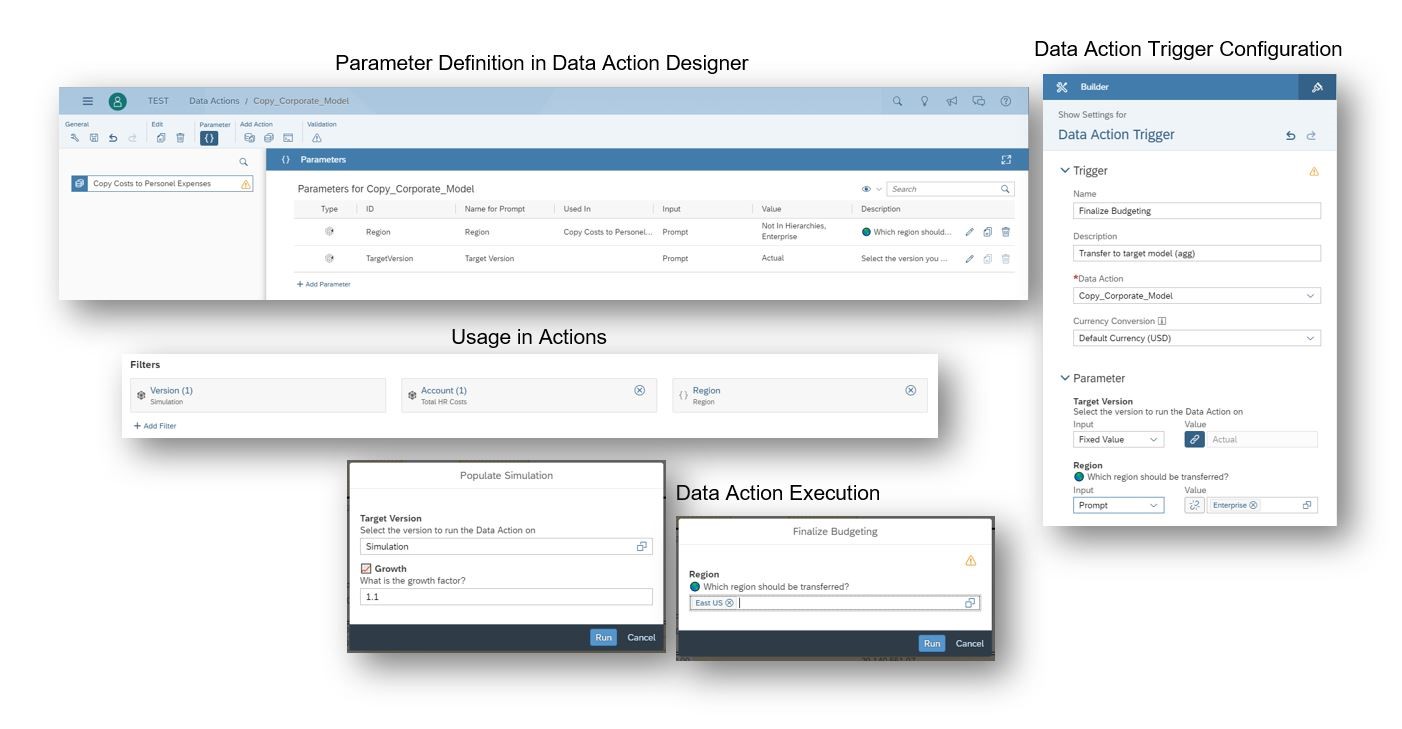
Once you’ve created a parameter in a data action, you can call the parameter in an advanced formula action. This works with creation via script and with the visual tool, increasing your speed and efficiency through automation.

Smart Assist
Search to Insight brand-new user experience
Smart Assist just got a whole lot smarter with an updated user experience.

Search to Insight can now be launched from a dedicated icon and offers new user-specific recommendations. Easily search by models or choose to view your insights by the measures and the dimensions in your models.


Smart Insights on tables
We have introduced a more intuitive design, right click on a cell instead of searching in the toolbar for the Smart Insights icon. This makes it easier to access the insights your company needs, and to keep all your goals in sight!

Search to Insight for BW & S/4 HANA Live Data Models
(To the tune of Bohemian Rhapsody)
Is this the real life?
Is this just fantasy?
Caught in BW Live
I’m now available in SAC
Open your eyes
Look up to the skies and see
I'm just an insight, I need visibility
Cuz’ I'll make you calm, make you know
Profits high, costs are low
Anywhere you need info, that really matters to SAC, to SAC…
Now you can use Search to Insight to create charts and find information with BW & S/4 HANA Live Data Models, administrators can also configure live model indexing. Check the help section within SAP Analytics Cloud for more information.

Additional Feature Updates:
Administration & Infrastructure
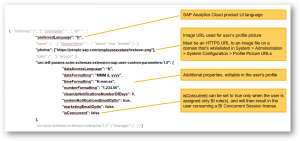
User & team provisioning API improvements for user properties
Synchronize your user accounts from other systems with default values for the following user preferences:
- SAP Analytics Cloud UI language
- Data access language
- Default date, time, and number formatting
- Email notification settings
- URL to a profile picture
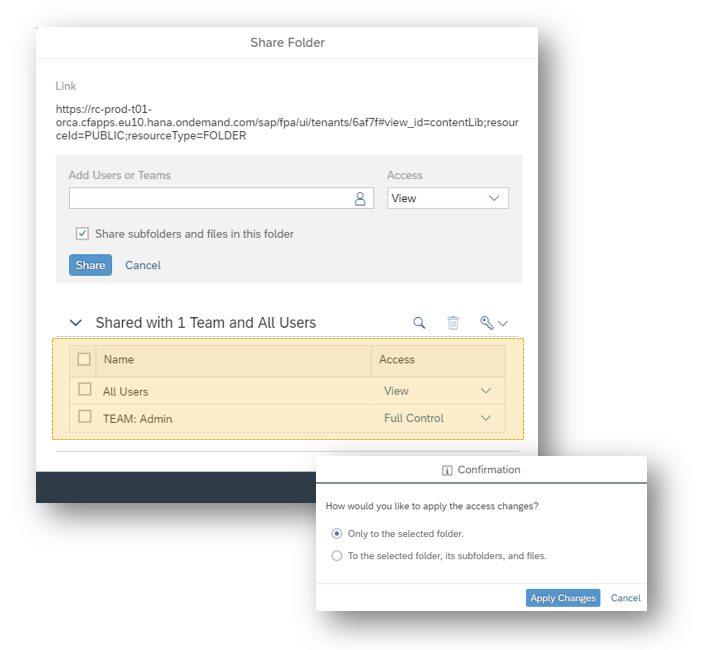
Add, remove and reset folders & file permissions with inheritance
We’ve simplified and improved the share dialog box for your convenience. Now you get visibility into the inheritance of permissions that users & teams are assigned on parent folders. You can choose to break the inheritance at any subfolder level or choose to re-establish inheritance from its parent. To make the dialog box more intuitive, the object owner is displayed, and we have prompting available for you to confirm whether a cascading effect is required. The control is entirely in your hands. You can choose to give specific access levels to multiple users and teams.

Edit the sharing settings for samples
Administrators can now change sharing settings on samples that are installed by default, making it easier to control access for samples.

Edit the default permissions that users & teams have on the Public folder
Administrators can now edit the default permissions for the Public folder through the “Share Folder” dialogue box. Previously, the Public folder was locked down and you had to change the permissions of each file individually. Now, you no longer need to go back and change users’ rights manually, just set it and forget it!
Users’ API Provisioning enhancements
You can now add filters to user GET requests made through the User and Team Provisioning API. This will support the Username and Email attributes.

Two-legged OAuth Support
Two-legged OAuth integration support for SAP Analytics Cloud instances running on non-SAP datacenters has been added, allowing seamless integration with S/4HANA and Intelligent Asset Management. And as Porky used to say, “Th-Th-The, Th-Th-The, Th-Th… That’s all, folks!”

Analytics Designer
Change cell values in your tables at run-time
We’ve added three new script commands to help you with…
- Fetching a planning object from the widget’s data source
- Writing data into a cell
- Submitting updated data
This should make changing data at run-time a little more enjoyable!

Copy and paste technical components
You can now duplicate Scripting objects from the context menu of the outline pane, as well as copy and paste technical components to and from external programs, helping to increase your efficiency! You can now duplicate Scripting objects from the context menu of the outline pane, as well as copy and paste technical components to and from external programs, helping to increase your efficiency! Whoops, my bad, got a little carried away there!

Renaming enhancements
As if this day couldn’t get any better, we’ve now taken the trouble of renaming variables away from you! When you go in to change a widget name in the Analytics Designer outline, the related scripting will automatically be changed for you, saving you time and effort.

Specify simple or advanced mode on your dialogue
When using Search to Insight in Application Designer, you can choose whether to search in advanced mode or simple mode, with the advanced mode giving you more search suggestions if you so desire. Is this a simple advancement or advancing simplicity?

BPC planning sequence widget improvements
A BPC planning sequence UI widget is now available in Analytics Designer along with two new APIs to set the widget’s visibility. The BPC Planning Sequence is now also supported by the BPC Live embedded model, continuing with our mission to bring you the greatest variety of data sources possible.

Data Integration
Import larger volumes of transaction data from BPC
With this new update you can now import much larger volumes of transactional data from BPC to SAC, allowing you to analyze more data than ever before.
Import data from Amazon S3, Egnyte, Dropbox, NetSuite, Microsoft Dynamics and OneDrive via Open Connectors on non-SAP tenants
This update brings access to 6 new sources which can be set up with SAP Cloud Platform’s Open Connector service found in the SAP Store. The SAP Analytics Cloud administrator will also have a global pause button available to manage usage. Let the information flow begin!
Please note that this feature is only for Cloud Foundry tenants as this feature is only supported for Amazon S3, Egnyte, Dropbox, NetSuite, Microsoft Dynamics and OneDrive via Open Connectors on non-SAP tenants.

Import data file size improvements
We now support CSV files up to 2GB and Excel files up to 200MB, giving you double the data import capability. Because when it comes to data and analytics, bigger is always better!

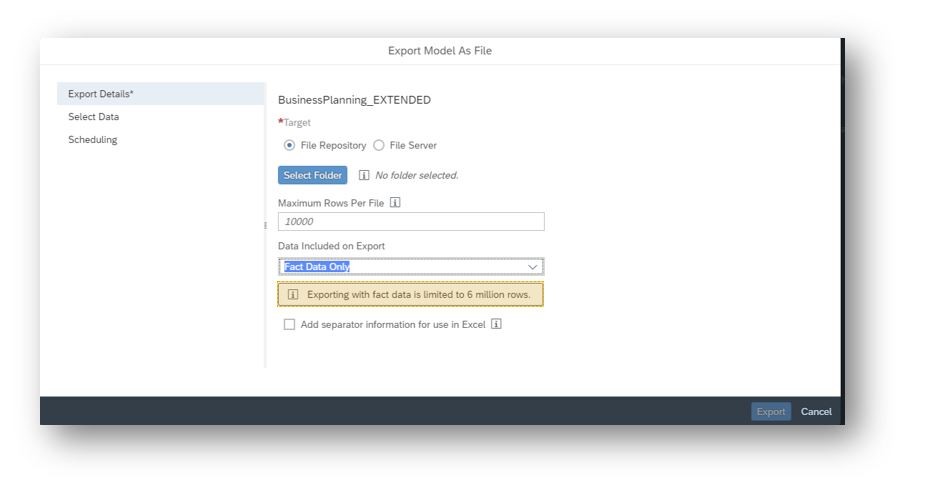
Data export improvements
With this feature, you’re getting two great updates for the price of one. Not only can you export up to 6 million rows of fact data, but the speed for exporting is even faster than when you could only export 1 million rows. You can also choose whether to export facts, calculations, or both, but calculations are still limited to 1 million. This almost sounds too good to be true!
Data Visualizations
On-demand Loading of Inactive Values on Story and Page Filters
Summer is coming and there’s no time to waste. That’s why we’ve changed the inactive values in story and page filters to load on-demand and made the story opening time faster than ever before!

Cross calculation input control in charts
Story designers can create cross calculation input controls in charts, providing more flexibility to end users by allowing them to select which currencies to display at any given time. If a region is unprofitable, just deselect it and make all your financial problems go away! (Wouldn’t that be nice…?)

Optimized performance for open-ended and dynamic date range filters
Meep, meep! Story opening times have been improved by delaying queries for dynamic or open-ended date range filters until after the story has loaded. Even the Roadrunner can’t keep up with these speeds!
Optimized Geo performance when Clustering is enabled
We’ve reduced the number of queries for bubble size and colour for the Bubble Geo Map legend from four, to one per layer. This will free up slots for other queries on the page allowing other charts to load faster than Usain Bolt riding a cheetah after three espresso shots.
*Disclaimer: No animals we harmed in the making of this blog post*
Stacked bar chart without dimension axis
No, the bar chart hasn’t started weightlifting, but it has given you the ability to show multiple measures all stacked without needing a dimension. That’s a measurable improvement!

Input controls for multiple cross calculations for tables
The new cross calculation input control supports single and multiple member selection in tables, giving you more precision to accurately view your data. This will create so many formulas we might be able to solve the remaining Millennium Prize Problems!

Performance improvement for clustered geo maps
Unnecessary legend information in clustered geo maps will no longer be displayed, allowing for load times faster than a race between two Concordes.

New default for Story & Page time range filters
To save you time, dynamic time is the new default option for Story & Page time range filters.

Add comments without saving your story
You can now add or delete comments without having to save your story since the comments will be added as soon as you post them. This more intuitive approach will make it easier to add comments and collaborate with your peers!

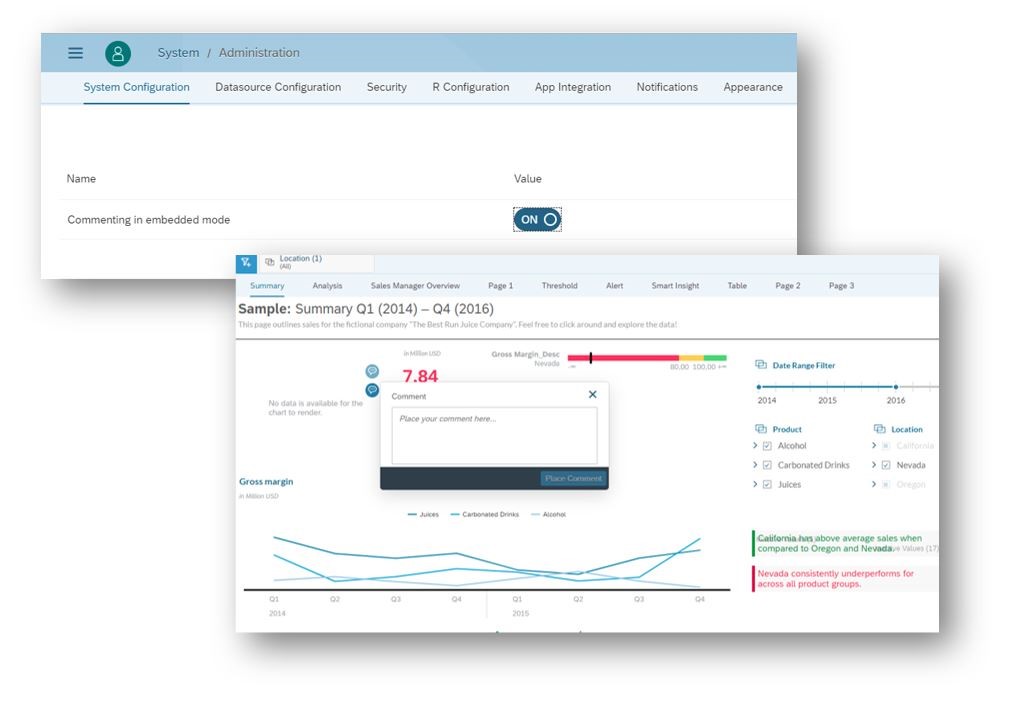
Add comments to an embedded story
Embedded stories will now support commenting, as long as the system administrator enables the feature under system configuration. Who needs social media anymore? Now you can like, comment, and share all through SAP Analytics Cloud!
Intelligent Enterprise
Sort measure values with two-structure queries with live BW models
When you have more than one dimension in the existing structure, you are now able to sort the measure values from lowest to highest and vice versa.

Performance improvements for BW
¡Ariba, Ariba! (pun intended) ¡Ándale, Ándale! With these new performance improvements for BW you’ll be running faster than Speedy Gonzales!
Date picker
Sorry, unfortunately this won’t help you pick a date location any faster for Saturday night, but it will allow you to select a date more efficiently for a BW characteristic value variable!

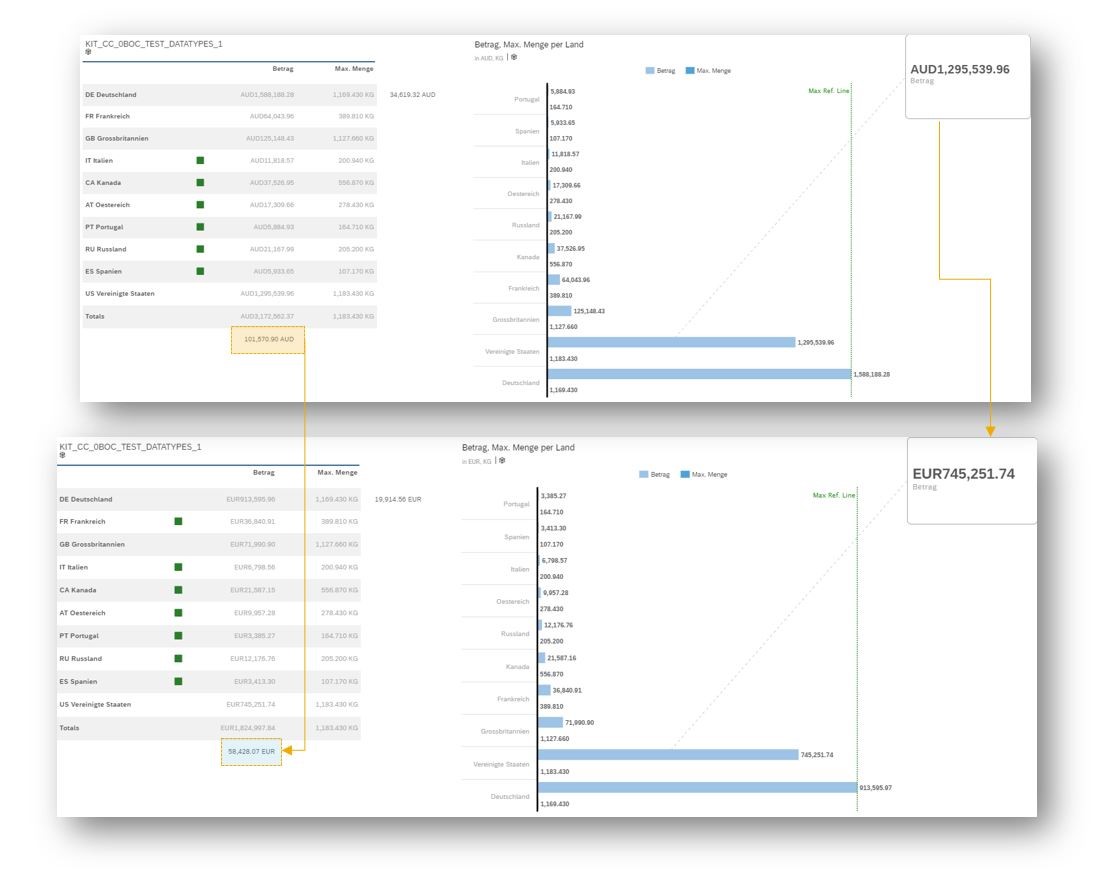
Enable currency conversions using SAP BW remote connections
You can now convert currencies using SAP BW remote connections, with the conversion types and rates defined in BW available in the SAP Analytics Cloud User Interface. That’s a feature I could go Won and Won about…
Tuple filters for charts and tables when drilling down
You can now use tuple filters for charts and tables when drilling down on dimensions ordered in hierarchies. Tuple filters can also be combined with linked analysis between different tables or charts, giving you more flexibility in how you want to view your data.

Mobile
Additional language support
Buna ziua! Ola! γεια σας! SAP Analytics Cloud mobile now supports 12 new languages! These include:
- Croatian
- Dutch
- Greek
- Finnish
- Hindi
- Indonesian
- Norwegian
- Portuguese
- Thai
- Turkish
- Ukrainian
- Romanian

Support for featured content
Featured stories and presentation can now be accessed from mobile, as well as being able to set featured content as a default filter when logging into the app. You won’t ever have to worry about missing critical information from your business again!

Modelling
Quartile exception aggregation type support
As with models based on acquired data, you can now define additional exception aggregations types based on SAP HANA Live models down to a T(-stat). These include First Quartile, Median and Third Quartile. This should help to normalize your distribution of time when working with SAP Analytics Cloud.

Planning
Create a Forecast or Rolling Forecast from the Builder Panel
Love to build? Easily create a Forecast or Rolling Forecast layout from the Builder Panel without having to use the restricted measures method. Now you can use time as a normal dimension, choose the version to use for look back and add additional look back and look ahead periods.

Empty cells are treated as unbooked cells during copy and paste
When you copy and paste your empty cells from your spreadsheets (or SAC grid) to your table, they are now treated as unbooked cells.

Multiple date dimensions in planning models
Need to keep track of several time metrics at once? Now you can add multiple date dimensions to your planning models! These dimensions will be supported by the Advanced Planning dialog patterns and can be consumed in Data Actions.

Booked mode enhancements
You can now add new members by right clicking on the header of an empty table and they will be added as unbooked data. You no longer need to see visible elements in a table before adding a new member, giving you more flexibility in how you want to use SAP Analytics Cloud!

Change calendar tasks to processes and vice versa & assignee roles for calendar process
You can now change your calendar tasks to processes or your processes to tasks with a simple click. You can also add assignees to a calendar process and they can distribute tasks to other assignees by transforming those tasks into processes and adding child tasks. Efficiency maximized!

Copy and paste in your tables with live BPC
When working with a table based on a live data connection to BPC Embedded you can now copy and paste values inside the table, between tables, and with external tables (such as an Excel file). Keep in mind that only values will be copied. Typing data manually is over and out.


Enter data into empty cells while using advanced filters
Now you can enter data into empty cells even when using advanced filters. This will help improve your efficiency, while giving you more control over your data.

New keyboard shortcuts in Gantt charts
Check out these brand-new shortcuts to help make your day a little easier!
| Action | Key (Windows) | Key (Mac) |
| Move time of element in Gantt | Shift + Arrow Keys (Left & Right) | Shift + Arrow Keys (Left & Right) |
| Navigate to next/previous calendar object in Gantt | Arrow keys (Up & Left for the previous object, Down and Right for next object) | Arrow keys (Up & Left for the previous object, Down and Right for next object) |
| Cancel / Revert (in builder Panel) | Esc | Esc |
Copy and paste enhancements for aggregation accounts
When copy-pasting in aggregation accounts, you will now be provided visual cues that will help define a valid target cell for your paste.
Dynamically select leaves for a hierarchy
For all non-account dimensions, you can now dynamically select to display only the leaves for the selected hierarchy.

Data locking task in Calendar mode
The Calendar mode will now enable the creation of a Data Locking Task to trigger an assignee to complete Data Locking. I was going to make a joke but there’s nothing funny about data privacy.

Attribute function
In advanced formulas you can now get the values of a numerical dimension attribute using the Attribute function and use it in a mathematical calculation. So, when you start getting a bunch of new information, you can attribute it to this new update ?.

Performance enhancements in advanced formulas
Advanced formulas need advanced performance, and that’s why we’ve optimized their overall response time by 46% on average. Are you getting tired of me telling you how much time you’re going to save? Good.

Visual Formula enhancements
In Advanced Formulas created using Visual Formulas, you can now choose to copy or read data from other models besides the default model of the Data Action. On top of that, in Advanced Formulas created using the Visual Formula editor, you can now add a “Delete” component to clear data facts within a defined data scope. Huzzah!


Smart Assist
Smart Insights on navigational attributes
When generating Smart Insights, navigational attributes are now considered and will help provide more detailed context to better enable your decision making! This will bring Smart Insights to a whole new dimension!

- SAP Managed Tags:
- SAP Analytics Cloud,
- Data and Analytics,
- SAP Business Technology Platform
Labels:
You must be a registered user to add a comment. If you've already registered, sign in. Otherwise, register and sign in.
Labels in this area
-
ABAP CDS Views - CDC (Change Data Capture)
2 -
AI
1 -
Analyze Workload Data
1 -
BTP
1 -
Business and IT Integration
2 -
Business application stu
1 -
Business Technology Platform
1 -
Business Trends
1,661 -
Business Trends
88 -
CAP
1 -
cf
1 -
Cloud Foundry
1 -
Confluent
1 -
Customer COE Basics and Fundamentals
1 -
Customer COE Latest and Greatest
3 -
Customer Data Browser app
1 -
Data Analysis Tool
1 -
data migration
1 -
data transfer
1 -
Datasphere
2 -
Event Information
1,400 -
Event Information
64 -
Expert
1 -
Expert Insights
178 -
Expert Insights
281 -
General
1 -
Google cloud
1 -
Google Next'24
1 -
Kafka
1 -
Life at SAP
784 -
Life at SAP
11 -
Migrate your Data App
1 -
MTA
1 -
Network Performance Analysis
1 -
NodeJS
1 -
PDF
1 -
POC
1 -
Product Updates
4,577 -
Product Updates
330 -
Replication Flow
1 -
RisewithSAP
1 -
SAP BTP
1 -
SAP BTP Cloud Foundry
1 -
SAP Cloud ALM
1 -
SAP Cloud Application Programming Model
1 -
SAP Datasphere
2 -
SAP S4HANA Cloud
1 -
SAP S4HANA Migration Cockpit
1 -
Technology Updates
6,886 -
Technology Updates
408 -
Workload Fluctuations
1
Related Content
- Migration and Upgrade from SAP SCM 7.0 EHP3 on Windows 2008 to SAP SCM 7.0 EHP4 on Windows 2019 in Technology Q&A
- Prerequisites and Post activities during In-place upgrade of windows 2012 to 2019. in Technology Q&A
- BEx Explorer(Analyzer) can't start in win 10 in Technology Q&A
- Redis on SAP BTP, Hyperscaler Option Now Available for Customers on BTP@China! in Technology Blogs by SAP
- BTP@China环境上的Redis on SAP BTP, Hyperscaler Option可面向客户提供! in Technology Blogs by SAP
Top kudoed authors
| User | Count |
|---|---|
| 13 | |
| 10 | |
| 10 | |
| 7 | |
| 6 | |
| 5 | |
| 5 | |
| 5 | |
| 5 | |
| 4 |