

Technology Blogs by SAP
Learn how to extend and personalize SAP applications. Follow the SAP technology blog for insights into SAP BTP, ABAP, SAP Analytics Cloud, SAP HANA, and more.
Turn on suggestions
Auto-suggest helps you quickly narrow down your search results by suggesting possible matches as you type.
Showing results for
former_member75
Participant
Options
- Subscribe to RSS Feed
- Mark as New
- Mark as Read
- Bookmark
- Subscribe
- Printer Friendly Page
- Report Inappropriate Content
11-17-2020
11:54 PM
This blog covers the new features and enhancements in the SAP Analytics Cloud and SAP Digital Boardroom Q3 2020 Release.
Please note that the SAP Analytics Cloud Help documentation is updated at the same time as the upgrade to this release, so the links here may not yet reflect what is described below until after the upgrade is complete.
Make sure to upgrade your SAP Analytics Cloud agent to the latest agent version 1.0.281 to take advantage of all the data acquisition types!
Requirements
These are the data acquisition minimum requirements:
- Version 1.0.99 for SAP ERP / SQL databases
- Version 1.0.235 for SAP HANA view
- Version 1.0.91 for SAP Universe (UNX)
- Version 1.0.233 for SAP Business Warehouse (BW)
- Version 1.0.75 for all other data source types
For more information, see the SAP Analytics Cloud System Requirements and Technical Prerequisites.
SAP Analytics Cloud fully supports Microsoft Edge and Google Chrome for all activities and areas of SAP Analytics Cloud including viewing, authoring and administration.
Highlighted Feature Updates
The features listed in the highlights section are the top feature enhancements in Q3 2020.
- Add-in for Microsoft Office:
- Administration and Infrastructure
- Analytics Designer:
- Select Multiple Widgets
- Create New Dimension Members Using Planning Model APIs
- Access an Analytic Application from a Calendar Task
- Export to PDF Scripting
- Application.showMessage() API
- DataSource APIs
- Create an Analytic Application Using Datasets of SAP Data Warehouse Cloud
- Create an Analytic Application Starting in SAP Data Warehouse Cloud
- Subscribe to an Application’s Top N Data Change Insights (Beta)
- Collaboration:
- Data Integration:
- Data Visualization:
- Growing Tables
- Dimension Member Display Configuration for Dimension Input Controls
- String Functions in Calculated Dimensions
- BW: Paste Filter Values in Story and Page Input Controls
- Mobile
- Planning:
- Build Value Driver Trees Within a Story
- The Planning Panel
- Data Actions with Automatic Publishing of Target Version
- Create Automatic Data Action Tasks in the Calendar
- Transforming a Legacy Value Driver Tree
- Smart Assist:
- Synonyms for Measures and Dimensions in Search to Insight Questions
- Dimension Specific Indexing Configuration for Live Models in Search to Insight
- Smart Predict:
Q3 2020 Feature Updates
Please refer below to learn about all the additional updates in detail. If you’re looking to get more information about these features, please visit the help documentation here.
- Administration & Infrastructure:
- Invite Specific Teams to a Discussion
- Support Microsoft Edge Browsers Based on the Chromium Engine
- Content Network
- Define Default Tab
- Analytics Designer:
- SetStyle API
- Optimize the Startup Performance of Analytic Applications
- Application.getInfo() API
- Set Variable Value for Hierarchy Node Variable
- APIs to Retrieve Additional Dimension Visible Properties
- Support for NULL Members and Totals Members
- Chart’s and Table’s Number Format
- Page Book Widget
- Variable Parameters to Open an Application URL
- New API openNavigationPanel()
- Shake and Long Press Gesture
- Save & Leave
- New API getVariableValues()
- New API getDimensionsFilters()
- Planning Model Extension
- System Runtime Messages
- Data Integration:
- Default Data Mappings Inherited from SQL Source
- Tunnel Connection Type
- Acquire Data from SAP HANA using an SSL Connection
- Data Visualization:
- Paste Filter Values in Story and Page Input Controls
- Remove Member Count Limitation for IC Based on Flat Dimensions in BW
- The TRIM Function in Story Formulas
- BW Input Controls: Starts/End with Search Improvements
- Facet Loading Configuration in Explorer
- Data Labels with Background Color and Opacity
- Display Values for Mixed Periods in Previous Period Time Calculations
- Mobile:
- Synonyms in Search to Insight on iOS
- Modeling:
- New Viewing Options
- Modeling:
- New Viewing Options
- Planning:
- The Datediff Function
- Define In-Cell Charts and Thresholds
- Apply Viewer Role to all Subtasks of a Calendar Process
- Use Three Dimensions to Define a Combination Rule
- Validation Warnings
- Work Files Handling Made Easy
- Platform Services:
- Schedule Story or Analytic Application based on SAP HANA 2.0 Live Data Connection
- Check Maximum Number of Publications per hour
- Copy an Instance of a Schedule
- Smart Assist:
- Predictive Forecast on a Planning Model at Y/H/Q/M Time Hierarchies
- Enriched Smart Insights for Formulas
- Smart Insights on a Data Point Calculated Using the MIN and MAX Aggregation Types
- Smart Insights on Data Points that Represent Account Dimensions
- Enhanced Dynamic Text on the Footer
- Improved Visibility of Leak Variables and Chart Details on Smart Discovery
- Smart Predict:
- Predictive Scenarios in Files Area
- Redesigned Settings Panel
Highlighted Feature Updates
Add-in for Microsoft Office
Microsoft Excel Integration
We are excited to announce that you can now integrate Microsoft Excel with SAP Analytics Cloud. With this new integration, we are combining the best of the Microsoft Excel interface with the planning and analytic benefits of SAP Analytics Cloud. This makes it even easier to analyze your plans, simulate future outcomes, and take effective business actions. Here are some of the exciting features you can utilize with this new integration:
- Report on SAP Analytics Cloud models and write back data into different versions: You can publish different versions of your data and revert them in case you would like to discard your changes.
- Pivoting and filter features: You can use pivoting and filter features within the highly interactive table to easily create your ad hoc reports.
- Add any calculations and use formulas to easily create added value.
- Return Subtotals in your database

If you want to use this integration, please ensure you meet the following prerequisites:
- Have an SAP Analytics Cloud tenant
- SAP Analytics Cloud deployment on Cloud Foundry
- Have a Data-acquired in SAP Analytics Cloud models
Administration & Infrastructure
Performance Statistics in SAP Analytics Cloud
Have you ever wanted to identify which of your SAP Analytics Cloud models have the highest impact on your connected backend systems? The new Performance Statics feature will do just that!
With this new update, you can get statistics of your highest performing models, which will be aggregated in a dashboard/story directly within SAP Analytics Cloud. You can easily identify Models and Stories that bring the highest load and processing to the backend system, so you can make improvements as needed. The dashboard will contain a variety information regarding Backend (Hana, BW) Runtime Statistics (and distributions), Query Types, most frequent Users, Models, Connections, and more.

Analytics Designer
Select Multiple Widgets
Exciting news! We’ve made some design time enhancements to improve your work efficiency when designing analytical applications. Now, you can select multiple widgets in which you can move the widgets around the canvas in unison.
You can also set common properties for the selected widgets, providing you with more flexibility when designing your analytical applications.

Create New Dimension Members Using Planning Model APIs
Did someone say more flexibility when designing planning interfaces? You heard right. We are now providing script APIs that will help you create, update, and delete dimension members on the fly.
Here are the new APIs that are offered:
- PlanningModel.getMember();
- PlanningModel.getMembers();
- PlanningModel.createMembers();
- PlanningModel.updateMembers();
- PlanningModel.deleteMembers();

Access an Analytic Application from a Calendar Task
You can now integrate your analytic application into the calendar task workflow. This impacts each task role as such:
- As a task owner, you can define your analytic application as a work file.
- As a task assignee, you can access the application from the calendar task and choose whether to submit, reject, review or set the progress of the task in the application.
- As a task reviewer, you can access the application from a calendar task in which you can accept or reject all actions in the application.

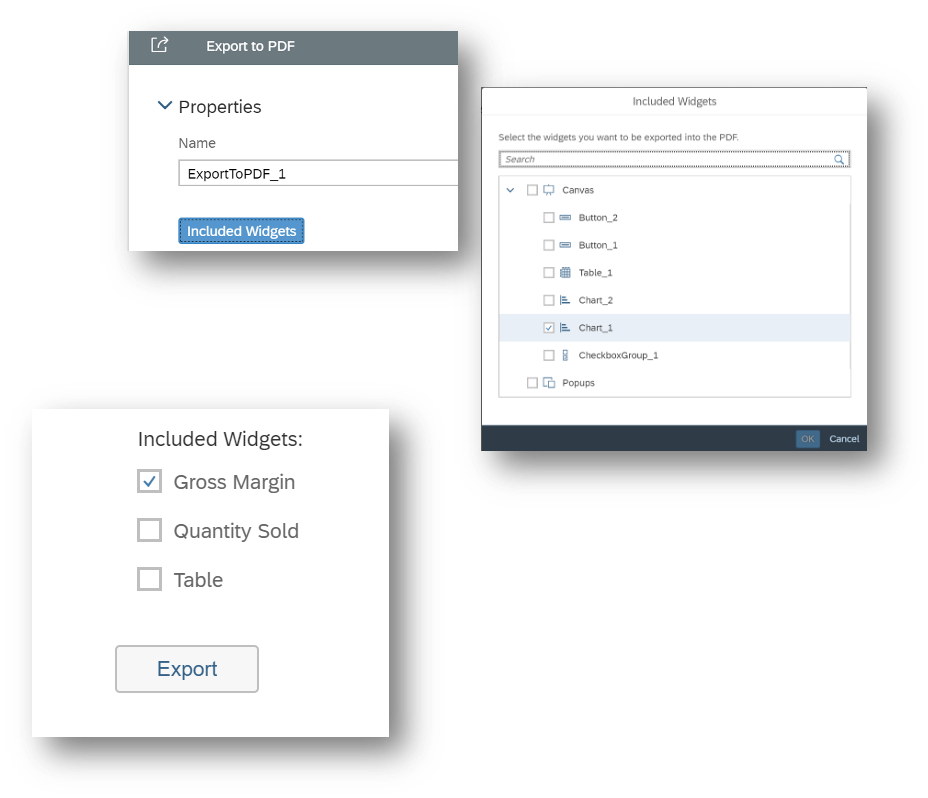
Export to PDF Scripting
End users can now define the specific widgets that they want to include or exclude in their exported PDF. This provides your end users with the ability to incorporate the most relevant widgets in their exported PDFs. This can be achieved through the Build panel or the following scripts:
- ExportToPDF.includeComponent()
- ExportToPDF.excludeComponent().
Application.showMessage() API
In SAP Analytics Cloud, flexibility and customization is at the top of our agendas when we are developing new enhancements. This next update provides analytic developers with the flexibility to customize your application messages in a way that is more digestible and relevant for your end users. You will be able to access this new capability by using the following APIs:
- Application.ShowMessage() API enables you to create custom messages
- Application.setMessageTypesToShow() API allows analytic developers to filter certain types of messages to manage what the end users can see. The different types of messages you can filter include Success, Info, Warning, and Error messages.

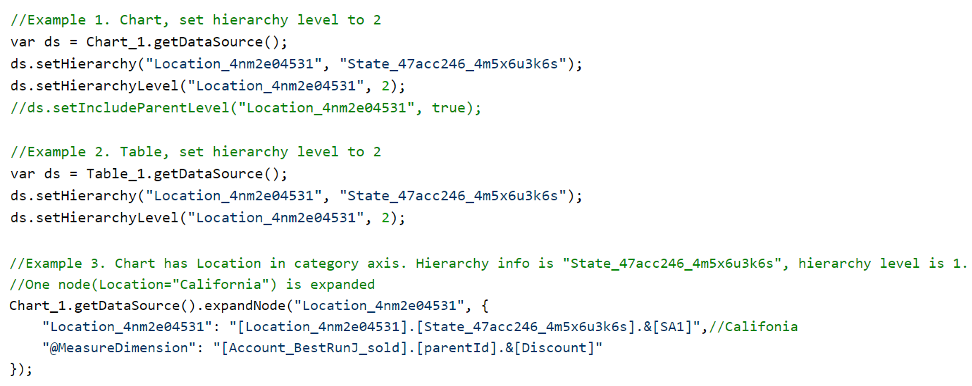
DataSource APIs
For all application developers out there, we have a handful of useful updates that will provide you more flexibility when using SAP Analytics Cloud.
As an application designer, you can now use the DataSource APIs(setHierarchyLevel(), getHierarchyLevel() ,expandNode() and collapseNode()) to set the hierarchy level of a dimension and to expand or collapse individual hierarchy nodes.
Example Codes:

Create an Analytic Application Using Datasets of SAP Data Warehouse Cloud
Within SAP Analytics Cloud, application designers can now create analytic applications by using datasets from SAP Data Warehouse Cloud. By using the “Select Model” dialog, the application designer can choose a configured connection, space, and dataset for the model-based widgets.
This new enhancement will increase the scope of the data you can utilize when designing your analytic applications.

Create an Analytic Application Starting in SAP Data Warehouse Cloud
Application designers will now also be able to create an analytic application directly in SAP Data Warehouse Cloud. There are two methods application designers can follow to create an analytic application in Data Warehouse Cloud:
- Select Data Warehouse space and then select Analytic Application
- Select Analytics Cloud space and then select Analytic application
Using either of these options, the application designer will then navigate to SAP Analytics Cloud, where you can choose a configured connection, space, and dataset for the model-based widgets. This new enhancement will increase the scope of the data you can utilize when creating your analytic applications.

Subscribe to an Application’s Top N Data Change Insights (Beta)
For analytic application users, you can now subscribe to an application’s top N data change insights either through notifications or your email. You can set the subscription to notify you by day or week depending on your SAP Analytics Cloud scheduling infrastructure. This new capability allows you to easily and quickly retrieve the most important and relevant insights on your data changes in your analytic application.
The data change insights will be delivered as a technical component with the corresponding script APIs:


Collaboration
Commenting Widget
It isn’t a well-kept secret that collaboration is key to any business’ success. This new collaboration feature was designed to help you and your teammates seamlessly collaborate when analyzing stories. The new Commenting widget allows you to contextually add comments based on a specific data model directly in your story page.
A highlight of this new widget is that you can add comments on different filter combinations in your story, providing other users with the most relevant comments regarding specific contexts.

Data Integration
New Data Preparation Experience
We understand that the data preparation process can be quite time-consuming and complex. This is why we are excited to introduce a new, smarter data preparation experience that was designed to add ease and flexibility when working with your data in SAP Analytics Cloud.
- Wrangling Public Datasets
You can now quickly analyze and visualize public datasets in stories. Features include:
- Cleanse public datasets
- Directly consume public datasets in stories: Analyzing data has never been easier! Simply upload the data in your Dataset and directly analyze it in a story. Datasets are entities that are ready to be analyzed from the get-go: The dataset creation step includes an automatic inference of which columns are dimensions and which are measures. Users can always adjust those by editing the Dataset.
Reminder: the upload thresholds for Datasets are 1B cells, 1000 columns, 5000 characters in a cell.
For the security measures on datasets:
- Object security of Datasets will be maintained in stories.
- If a user has view rights on the dataset, they can see the data, but not change it.
- Users with edit rights will be able to open a Dataset and use all of the wrangling capabilities.
- If a public dataset is used in a story, any user with at least view rights on the dataset will be able to see it in view mode directly in the story. This new feature provides users with the confidence when working with their data.

- Embedded Datasets in Stories
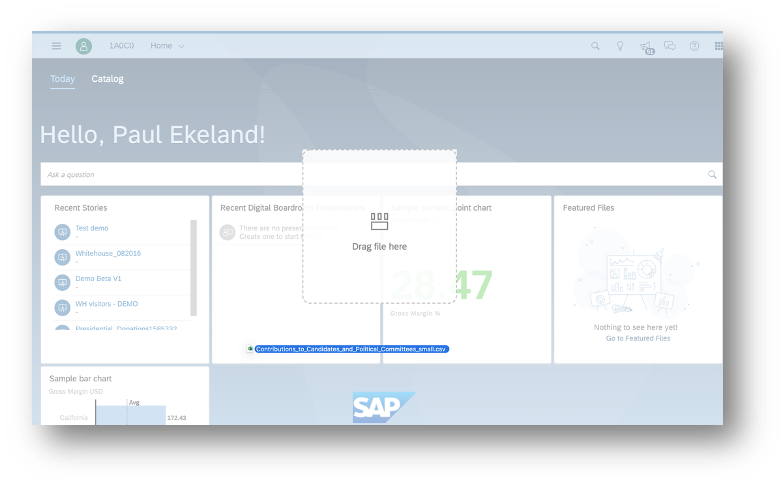
We are introducing a complete self-service analytical experience that will bring you closer to data manipulation and the augmented analytic capabilities of your stories. When loading data in a story, users will now create an embedded dataset.
The biggest benefit is the near-instant transition between the story layout and the wrangling area, making any adjustment to the data a simple click away.
For those fans who are a fan of Excel, you will also be able to drag and drop their data into the homepage to get start analyzing it right away. In case you are still looking for an environment you are still familiar with, there is an option to start wrangling with the basic data preparation experience.
- Model and Column Overview
Next, we have simplified the modeling experience by introducing a new right-hand side panel that will provide a summarize representation of your model including your dimensions, measures, and descriptions. Here are the actions that will be directly available from panel:
- Change from dimension to measure and vice-versa via the drag and drop or menu
- Rename and delete objects
- Shortcuts to geo-enrich dimensions
- Create hierarchies
- Check errors
There is also the ability to view all columns of the dataset, even those not part of the model, by switching to the column view. Note that if columns are not part of the model, they will simply not appear when selecting dimensions or measures to create charts, or any story widget.

- Data Types and Statistical Types
In SAP Analytics Cloud, there will be new data types in each column. If a value doesn’t match the data type, the value will be flagged and will not be visible in the story. However, these errors will not block the move to story view nor will delete rows. Here is a list of the different column types:
- Date
- Integer
- Number
- String
- Date and time
- Boolean
- Number
In addition, columns will also contain a statistical type, which can be edited.


- Working with a Sample
With this new experience, you are still working on a 2000 row sample when wrangling. You also have the option to validate all the data outside the sample. Warnings will be raised to the user:
- If the data in a column does not fit corresponding datatype
- If an ID has multiple descriptions
All errors are only warnings, meaning that users can always proceed to work with that dataset. In this case, cells with issues will be cleared but rows will not be deleted.

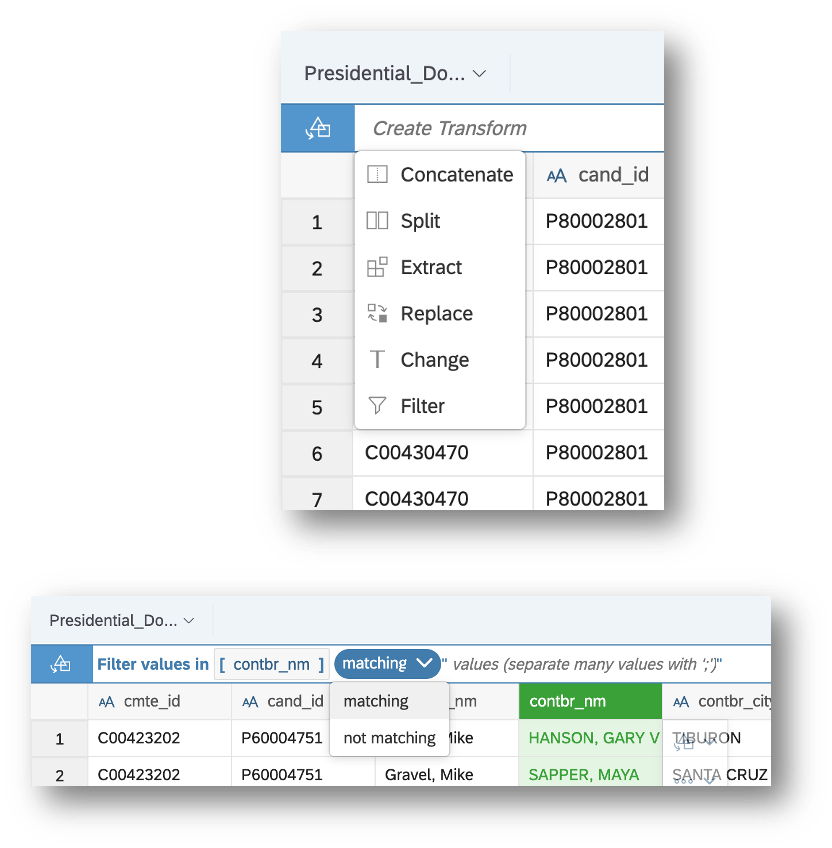
- Transformations, Unpivot
All existing transformations are available also on Datasets. These transformations include concatenate, split, extract, replace, change, and unpivot. In addition to these transformations, Filter is a new function that will be available as a transformation.
It will allow users to specify which values to filter out, even if they are not part of the sample.
Note that unpivot can only be run on a single column header, and if you want to be able to unpivot a dataset with multiple headers, you will have to move to the basic data preparation experience to have access to this functionality.
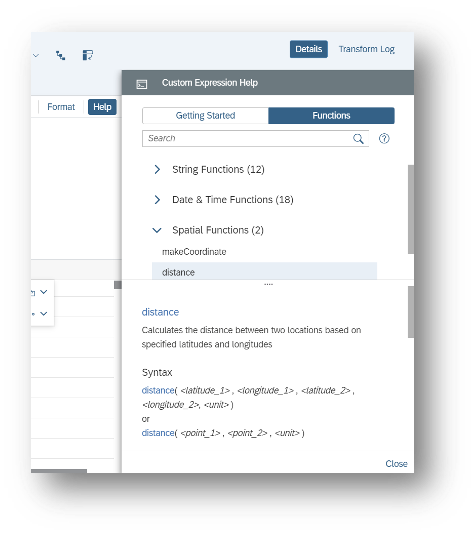
- Custom Transformations
Next, SAP Analytics Cloud will contain a variety of data manipulation functions enabling data analysts to write custom transformations. A particular focus was set on providing the best development experience when writing a new expression. Imagine being able to write the custom transformation without leaving the keyboard. That was the challenge and in order to address it, here are some of the features that were brought into the editor:
- Typeahead of column, function, keyword names
- Function stub automatically displayed
- Easy navigation across function arguments
- Copy/Paste of expressions
- Clear troubleshooting experience
Custom transformations are based on a new, powerful language, developed in-house:
- Functions are divided in the following categories: Numeric, String, Date and Time, Spatial, Others
- A total of 50 functions are available, further superseding existing capabilities. Notable additions: timeDiff(), Distance(), element() etc..
- Outputs are now named: [NewTown]=“Roma” creates a new column with “Roma” as constant value
If needed, transformations can be edited from the transform log for further adjustments, thus matching the realities of everyday developments.
- Semantic Enrichments
For the drilling experience in charts across dimensions, users can create level-based hierarchies. This means:
- Levels are defined by dimensions
- Hierarchies are declared objects in models
- Dimensions can only be used in one hierarchy
- Columns can be ordered together in the grid
To map data points, users can geo-enrich existing dimensions through a variety of entry points, such as the toolbar and dimension menu. A big improvement is that an associated hierarchy can be created in the model, which users can use to build charts. Locations that have errors will not be displayed but will also not prevent the enrichment nor delete rows in the dataset.

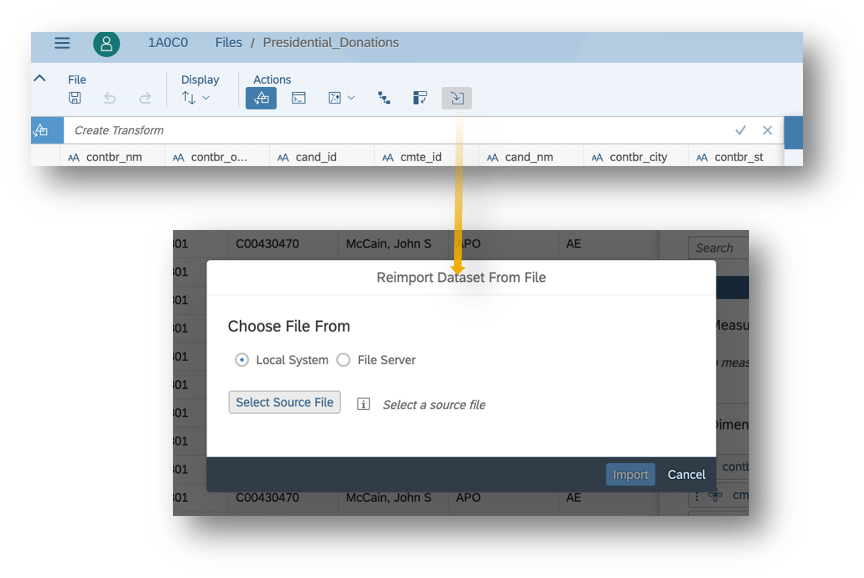
- Reimport Data for Dataset
This new feature introduces the ability for users to update data inside a dataset. For any local dataset, whether a public dataset or embedded dataset in a story, users can now re-acquire the data from the original source to fully replace the contents of the dataset.
The columns of the dataset will automatically be matched to the newly acquired ones. In cases where there are structural differences with the newly acquired data, the process will be cancelled.
Lastly, regarding files, users will need to specify the location of the new file in order for all other sources queries to be automatically re-executed.
- Invoking Basic Data Preparation Option
Lastly, users can now re-initialize the wrangling session in the classic workflow without having to re-acquire data. When doing this, a warning sign will inform the user that all work will be lost. Basic data preparation can only be opened when the column count of the Dataset is less than 100 columns and has less than 100m cells total for non-file sources.
Benefits of using the Basic Data Preparation includes be able to:
- Append data to an existing embedded dataset
- Map a new upload into an existing dataset
- Acquire data coming from Dow Jones
- Use multi-headers when doing unpivot
- Use Smart Insight on variance chart
- Build a parent-child hierarchy
- Support of cross-calculations on tables and charts (just like remote models, universal models)

Data Visualization
Growing Tables
For business reporting needs, it is essential to have a full picture of your dataset. That is why we integrated the new growing tables feature available in the Canvas. With this feature, you can now automatically resize the table vertically to view you canvas in full height. This simplifies your viewing experience as it allows you to get a full picture of your whole dataset without having to scroll too much.

Dimension Member Display Configuration for Dimension Input Controls
When you are dynamically analyzing your data, switching the selection within a dimension input control can be cumbersome when you have to constantly switch between description and ID. For example, you may want to view store names as a description, but it is added as an ID.
Now, when you are configuring a dimension input control, you will have the ability to specify on a per dimension basis whether you want your dimension member to be displayed as an ID or description.

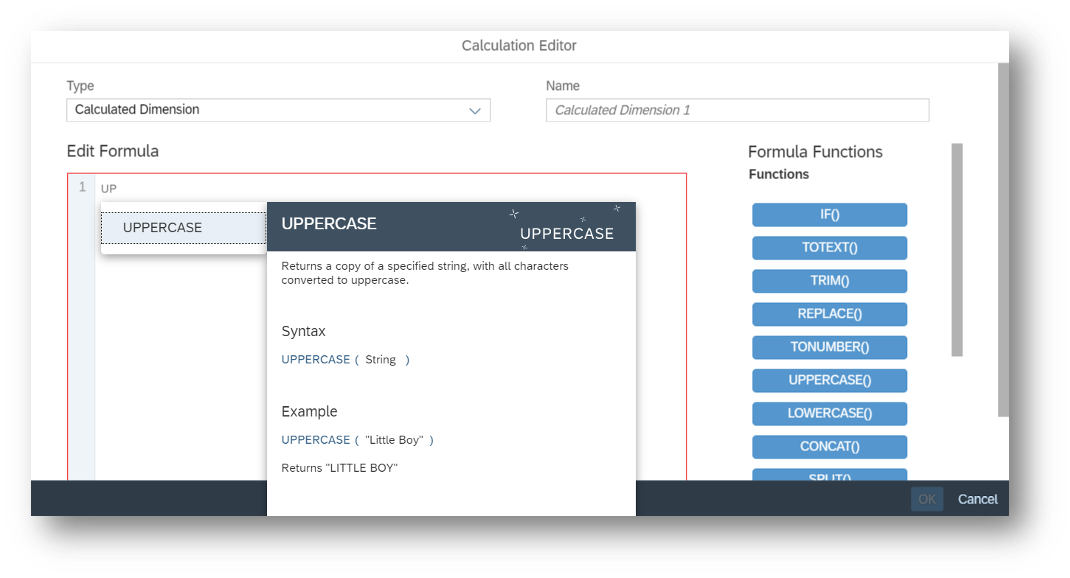
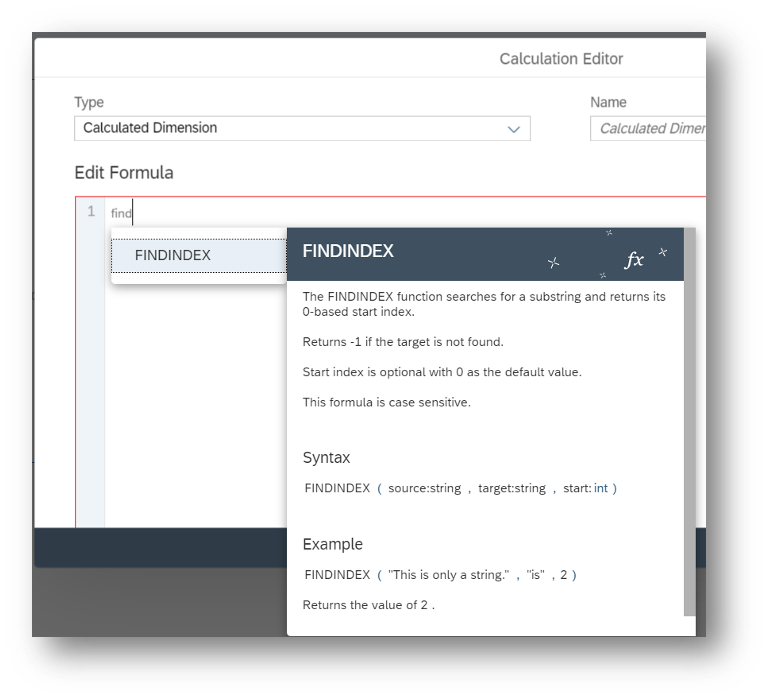
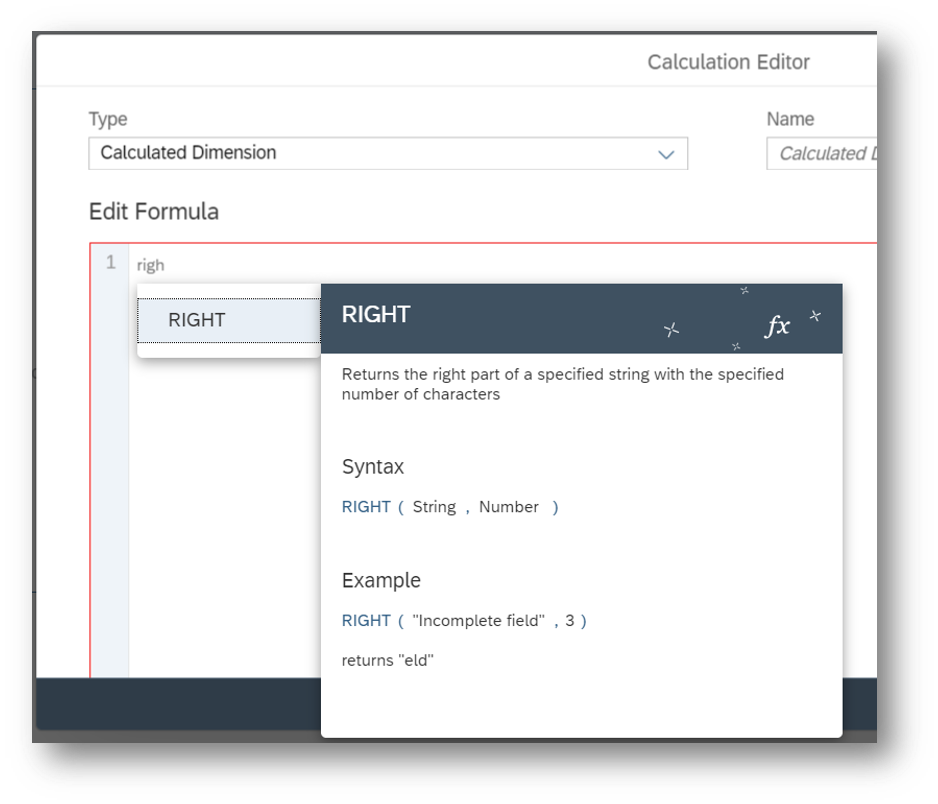
String Functions in Calculated Dimensions
Great news! We have introduced the following new functions in calculated dimensions to provide you with more flexibility to manipulate strings at the story level instead of planning to do the changes at the data source level. The functions specially help when you want to do ad-hoc analysis and analyze your data. Please note that these functions are only supported for models based on acquired or live HANA connections.
- CONCAT: You can now use the CONCAT function to combine two strings into one string dimension. An example would be if you wanted to combine the dimensions, first name and last name, into a single dimension.

- REPLACE: You can now use REPLACE function to replace characters specified by location in a given text string with another text string. For example, if you want to replace a certain country with a prescribed value, you can use the REPLACE function to achieve this.

- LOWERCASE and UPPERCASE: You can now use LOWERCASE and UPPERCASE functions to convert a text string to all LOWER and UPPER cases.
- SPLIT: You can now use the SPLIT function to return a substring from a string, using a delimiter character to divide the string into a sequence of tokens. An example would be if you want to split your customers’ first names and last names with a comma.

- FINDINDEX: The FINDINDEX function searches for substring and returns its start index with 0 as a default. The function will return -1 if the target is not found.
- ENDSWITH: The ENDSWITH function returns “True” if the given string ends with the user’s mentioned substring. This function does not ignore trailing white spaces.

- RIGHT and LEFT: The RIGHT function returns the specified number of characters from the end of the given string. The LEFT function returns the specified number of characters from the start of the given string.
BW: Paste Filter Values in Story and Page Input Controls
Both story viewers and designers can now make changes to story and page filter selections faster, especially when working with a large list of values. You can now simply copy and paste filter values into the input control to either overwrite or append the existing selection when working with BW models.

Data Labels with Background Color and Opacity
Have you ever created a chart and the data label was difficult to read? We have a new customization feature that will enhance the readability of your data labels. Now, you can choose the background color and opacity for your data labels. Please note that this feature does not support Cluster Bubbles, Bullet & Numeric Point Charts, and in conjunction with Web Fonts.

Display Values for Mixed Periods in Previous Period Time Calculations
We have made an enhancement to the Previous Period Time Calculation. Now, story designers have the flexibility to show all values in widgets containing different hierarchy levels such as year, quarter, and months in Previous Period Time Calculations.
This new capability can provide you with more holistic view when analyzing your data.

Mobile
Search to Insight on iOS for iPhone and iPad
Are you ready to find the answers you need no matter where or when you are working? You will now be able to extract insights with just a few taps using the new Search to Insight capability on the SAP Analytics Cloud Mobile iOS app available on iPhone and iPad. This new feature is supported for acquired and live models based on Prompts available for acquired/live SAP HANA, SAP S/4HANA, SAP BW.
Please Note: Currently, Search to Insight on Mobile does not support changing variable values and uses the default set model parameter values to run the query. If no variables are set with default values, then all results are returned. Setting chart level variables is also not supported.

Planning
Build Value Driver Trees Within a Story
You can now build Value Driver Trees in a story. Here are some exciting key highlights of this new feature:
- Choose any display time granularity: Now when building a Value Driver Tree, you can choose any display granularity you would like.
- Supports Story Calculations: You can use story calculations for your accounts or cross calculations, providing you with more control over your accounts.
- Supports Analytical Models: You can build a Value Driver Tree based on an analytical model. Note: You do not need a planning license.
- Independent Node Configuration: Each of your nodes can be configured independently, displaying its own versions, cross calculations, or filters.
- Default Node Configuration: You can now design Value Driver Trees even faster by providing a default mode configuration.
- Select Multiple Cross Calculations for One Node: Nodes can display any number of cross calculations.
- Collapse and Expand Nodes: You can collapse your subtrees to make your Value Driver Trees more compact.
- Drag & Drop Linking: Connect nodes through drag and drop.


The Planning Panel
The data entry process can be quite time-consuming and tedious, especially when you are working with complex planning scenarios that involve spreading, distributing, and assigning operations. It’s time to part ways with spending countless hours during the data entry stage because we have created a tool that will allow you to execute your planning scenarios with ease.
We are excited to introduce the Planning Panel in SAP Analytics Cloud!

The Planning Panel is an all-encompassing tool that enables you to quickly and effectively execute your ad hoc planning scenarios all in one united, consolidated platform. From providing recommendations for typical planning scenarios to distributing values along multiple dimensions at the same time, the Planning Panel has got you covered for all your planning needs.

Data Actions with Automatic Publishing of Target Version
You can now set a follow-up action for the execution of a data action so that the target version is automatically published upon successful execution.
This is available for:
- Data Action Triggers: Saving additional user interactions for publishing after a manually triggered execution has finished.
- Data Action Tasks in the Calendar: Supporting the automated planning process by publishing results.
Successful publishing and errors will be indicated to the user via notifications. Please note that this feature can only be applied for public target versions. For private target versions or versions of BPC Writeback models, the user needs to manually publish.
 Create Data Action Tasks in Calendar
We are introducing a new task type, which will allow you to schedule the execution of your Data Actions. You can also set this execution to occur on a regular interval.

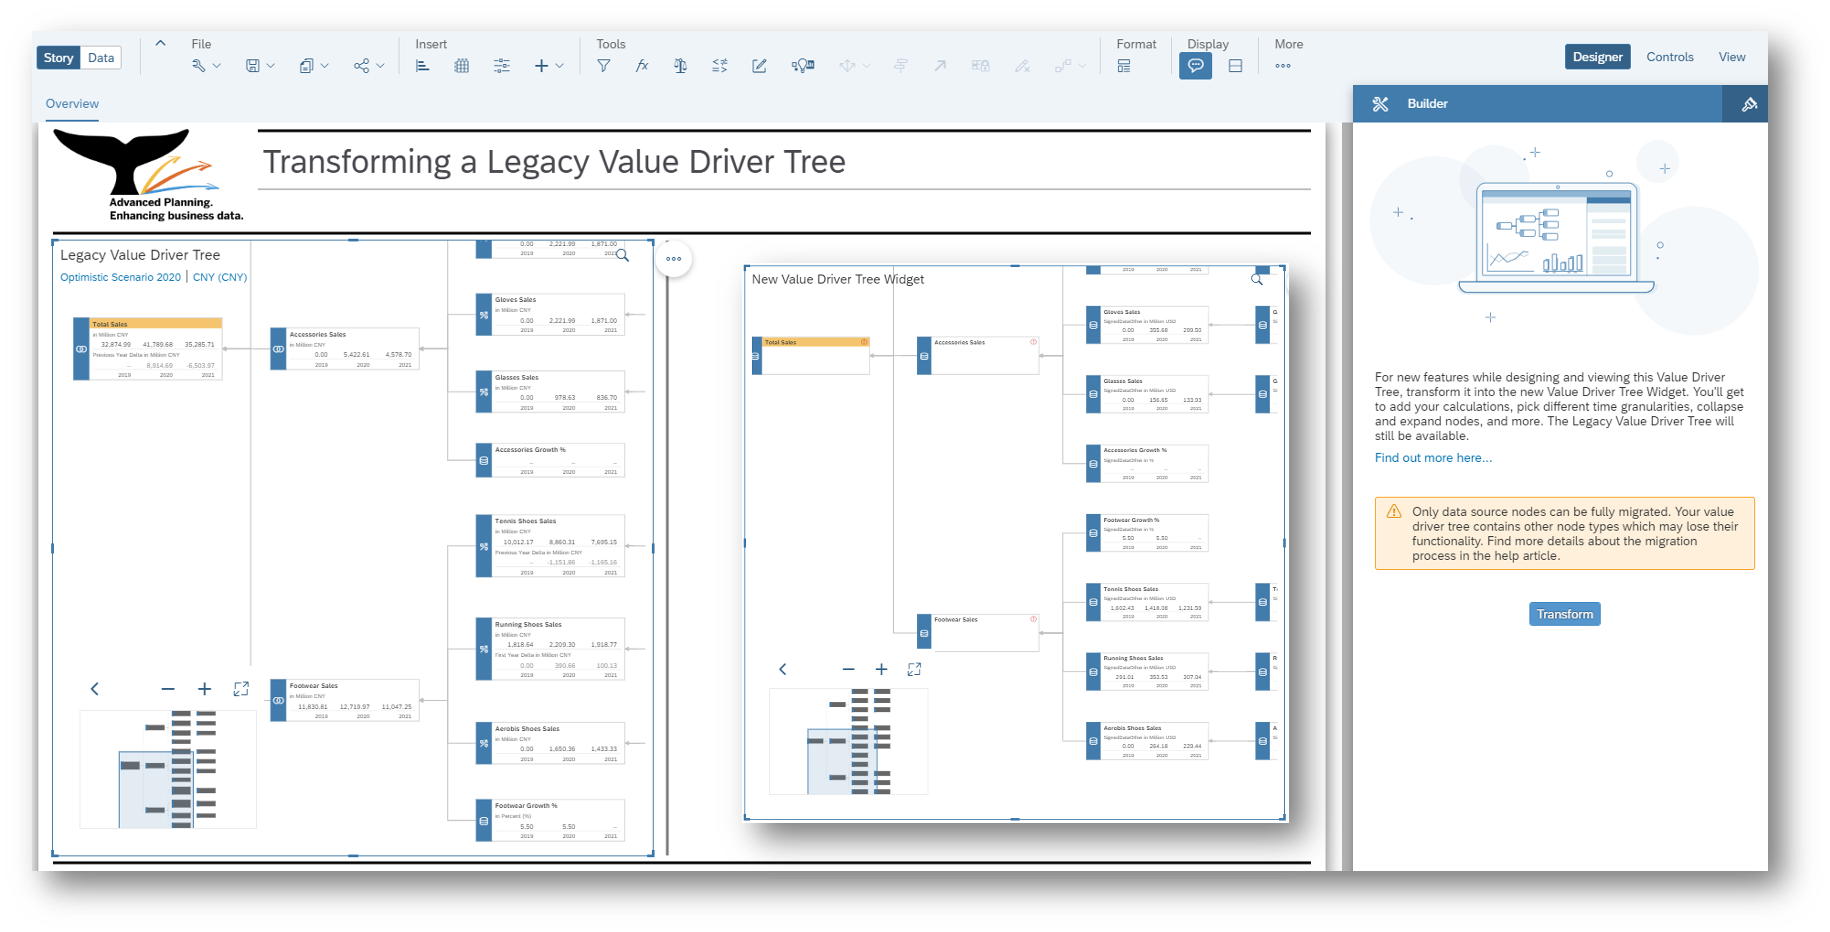
Transforming a Legacy Value Driver Tree
A few waves back, we announced the new Value Driver Tree widget that can be added directly into your stories. This widget contains many amazing capabilities such as the ability to leverage story calculations, to collapse and expand branches of the Value Driver Tree, to utilize more granular time scales, and several other capabilities.
With this release, we are now allowing you to easily transform your legacy Value Driver Trees into a Value Driver Tree widget. This feature will save you time and effort since you don’t need to completely remodel the Value Driver Trees to gain the benefits that the new story-based Vale Driver Trees provide.

Smart Assist
Synonyms for Measure and Dimensions in Search to Insight Questions
Power users can now define synonyms for measure and dimension names, which they can then easily search for in Search to Insight. The synonyms created will appear in the Search to Insight autosuggestions along with other measures and dimensions. Under System, you can access the synonyms dictionary, which lists all the definitions of synonyms used for dimension and measure names independent of a model.
This new enhancement will allow provide you with more customization when searching for your answers, allowing you to ask questions in a more business-like language.


Dimension Specific Indexing Configuration for Live Models in Search to Insight
The 5000-member indexing limit will be removed, allowing Search to Insight users to search for all dimension members even for high cardinality dimensions. At index time, it’s possible to exclude certain dimensions, such as sensitive or unwanted dimensions, in order to hide dimension members from Search to Insight.
This update empowers users to choose their desired level of hierarchies to index from, providing you with greater control over results in Search to Insights while increasing overall performance.

Smart Predict
Planning Models can now be used as Data Sources for Predictive Scenarios
The next feature revolves around integrating planning model data sources with Smart Predict to unify the Predictive, BI, and Planning experience in SAP Analytics Cloud. This means you will be able to create your predictive model from your planning models. You can then inject the predictive results directly into your planning models.
These predictive results can be broken down and segmented across multiple dimensions and members, facilitating automated and intelligent bottom-up forecasting at scale.

Further, planning users will be able to access the predictive reports, enabling them to see the quality of the debriefs and KPIs. Receiving these insights will empower users to make the most accurate and confident decisions for their business.
Additional Feature Updates
Administration & Infrastructure
Invite Specific Teams to a Discussion
You asked and we’ve listened! For this new release, you will now be able to invite specific teams to a discussion. Collaboration is essential when working on your analytic and planning scenarios and this new feature will make collaboration in SAP Analytics Cloud even more user-friendly.

Support Microsoft Edge Browsers Based on the Chromium Engine
For those who use Microsoft Edge, SAP Analytics Cloud now supports Microsoft Edge Browsers based on the Chromium Engine. This will provide you with a smoother and more enhanced user experience when working with SAP Analytics Cloud in your Microsoft Edge browser.
Content Network
From the Content Network, you can now import and export teams, team folders, and content in the “System” folder. This means, for administrators who are managing the lifecycle of content between tenants, you can now import and export team related content. This update provides you with greater control while managing the lifecycle of team content.

Define Default Tab
With SAP Analytics Cloud, one of our goals is to ensure you can easily access the content you need. This new feature will help you do just that. On the SAP Analytics Cloud home page, administrators can now define a default tab by going to System > Administration or by clicking the Edit Home Screen button. Your individual users can also navigate to the Edit Home Screen dialog and define their own default tab. Please note that if all tabs are disabled, then this option will be hidden in the Edit Home Screen dialog and disabled in the Default Appearance tab.
Analytics Designer
SetStyle API
Plain widgets were so last year! It’s time to add some style to your bland widgets. Now, as an application designer, you can use the setStyle API to dynamically customize the style of your widgets including font color, background color, shapes, and much more, all at run time. The widgets that are supported in the setStyle API are text, input field, text area, and shape widgets. This customization is particularly useful for when you are working with conditional formatting scenarios.
Optimize the Startup Performance of Analytic Applications
It’s time to speed things up a bit! You will now be able to automatically load all invisible widgets in the background either through the Analytic Application Setting Dialog or the Application URL parameter: loadInvisibleWidgets=inBackground. This new feature will not only improve the performance of your application but also speed up the initialization time.

Application.getInfo() API
You asked and we listened! Application designers will now be able to use the Application.getInfo() API to access information regarding your application including the ID, name, description, and URL. Now, you can find all your application information in one, central place.
Set Variable Value for Hierarchy Node Variable
Calling on all application developers. We have a handful of useful updates that will provide you more flexibility when using SAP Analytics Cloud.
First, you can now set a variable value for a BW and HANA hierarchy node variable. To achieve this, here are the following APIs:
- Single node: Table_1.getDataSource().setVariableValue(“0BC_CUST_NODE”, “0HIER_NODE!FRANKREICH”);
- Multiple nodes: Table_1.getDataSource().setVariableValue(“0BC_CUST_NODE”, { values: [“0HIER_NODE!CANADA”,”0HIER_NODE!DEUTSCHLAND”] });
- Not Assigned nodes: Table_1.getDataSource().setVariableValue(“0BC_CUST_NODE”, “1HIER_REST!REST_H”);
It’s important to note that excluding hierarchy nodes and range specifications (less, greaterOrEqual, from, to) are not supported.

APIs to Retrieve Additional Dimension Visible Properties
Get ready to build more interactive dashboards! As an application developer, you can now retrieve additional dimension visible properties. You can then display these properties in a dropdown box or as a text widget. This can be achieved by using the following APIs:
- First, use DataSource APIs getResultset() to retrieve all properties. Example code: Table_1.getDataSource().getResultSet();.
- Use getResultMember(0 to get dimension visible properties for a particular dimension member. Example code: Table_1.getDataSource().getResultMember(“0D_NW_PROD”,Table_1.getSelections()[0]);

Support for NULL Members and Totals Members
SAP Analytics Cloud will now support “NULL” members and “Totals” members to application design scripting APIs. This change enhances the Alias enumeration with two new literals: Alias.NullMember and Alias.TotalsMember. These literals should be used in scripts whenever a “NULL” or “Totals” member needs to be referenced.
The following DataSource APIs have been enhanced to handle or return NULL or Totals members correctly:
- getMembers(), setDimensionFilter(), setVariableValue(), getData(), getResultSet(), getDataSelections(), getResultMember()
- The following Table / Chart API has been enhanced: getSelections()
- The following Planning APIs have been enhanced: setUserInput(), DataLocking.getState
Chart’s and Table’s Number Format
You can say goodbye to manually having to set the scaling factor for each chart individually. Now, application designers can set the number format of charts and tables with the following APIs:
- setScaleUnit()
- setScaleFormat()
- setDecimalPlaces()
- setSignDisplay().

Page Book Widget
In your mobile device, you can now use the Page Book widget to group the application contents by different pages. You can use the swipe gesture to navigate from one page to another. The Page Book widget was designed to make it much easier to navigate through your analytic applications on your mobile device.

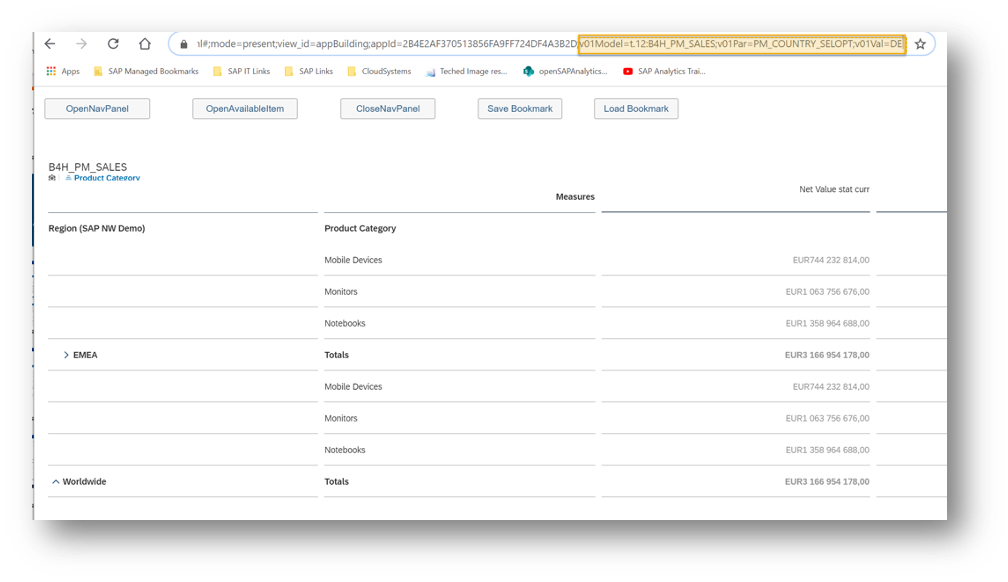
Variable Parameters to open an application URL
Let’s speed things up a bit! Let’s take a look at an enhancement that will accelerate your analytic application’s start up performance. Users can now set the variable value through the application URL parameters. For analytic applications, setting variables via the application URL parameter can avoid the double round trip of comparing setting variables in onInit event.
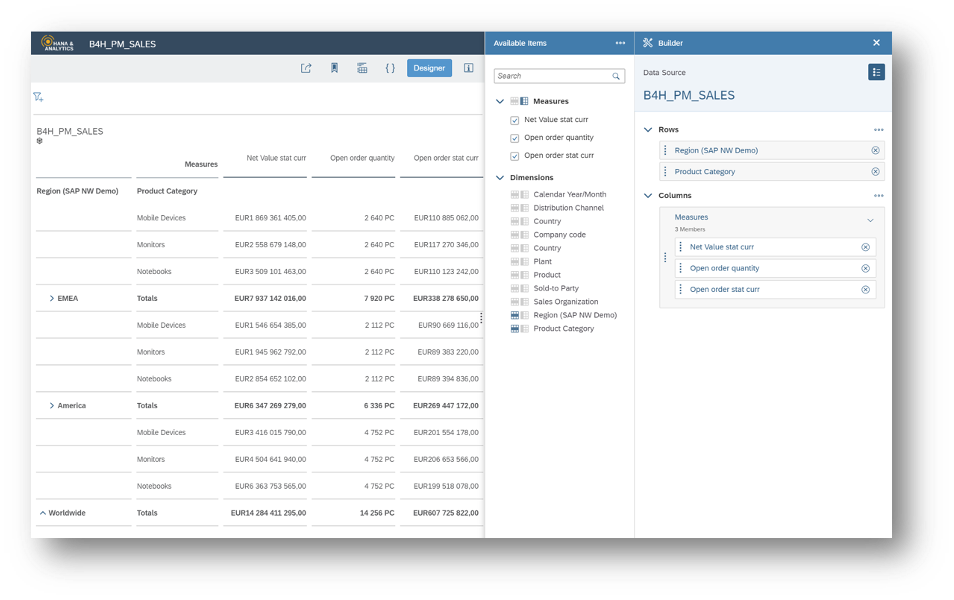
New API openNavigationPanel()
The Navigation Panel for tables is now available in the Analytics Designer. This enhancement provides users with a convenient way to analyze their underlying data models. With the Navigation Panel, users can perform the following actions at application runtime:
- Add/remove dimensions and measures
- Swap axis /Arrange Totals
- Display dimensions in key/text representation
- Select Hierarchies/Properties
- Compact Display/Suppress Zeros (for BW)
To open or close this panel, you can use the following new APIs:
- openNavigationPanel()
- closeNavigationPanel()
- Available items panel can be opened via the optional parameter.
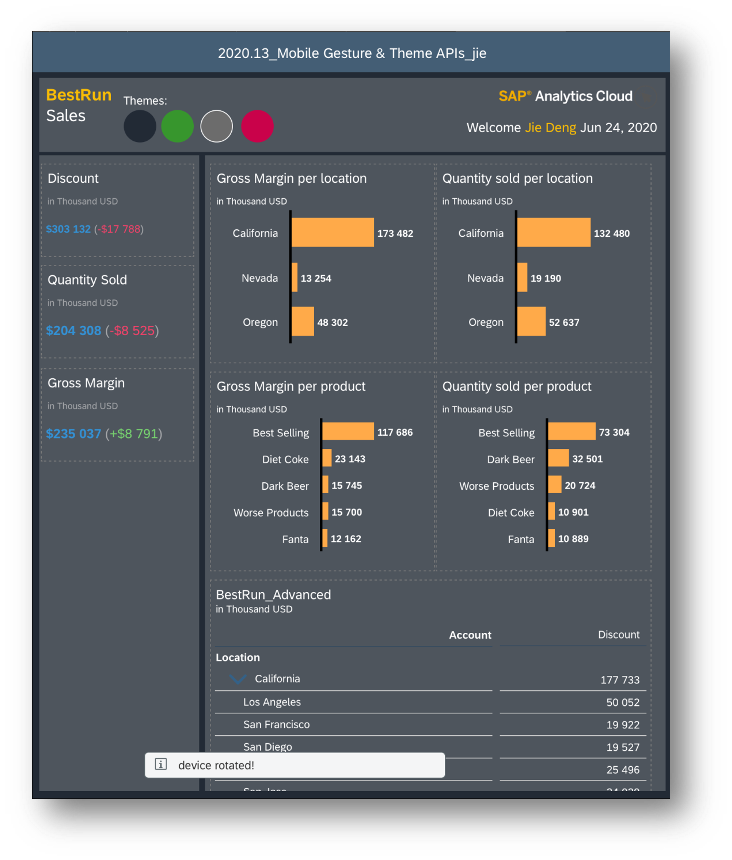
Shake and Long Press Gesture
We have an exciting enhancement that will provide a more mobile user-friendly way to consume analytic applications on your iPad device. We are introducing the following mobile specific gestures for analytic applications running on a native safari browser on the iPad:
- Shake event
- LongPress event for Button, Shape, and Image widgets
- onOrientationChange event
Save & Leave
When exiting an analytic application that has not been saved, there will now be a new “Save & Leave” dialog. This dialog will ask you whether you want to save your progress before exiting. This ensures you don’t accidentally exit and lose all your unsaved changes that you have made to your application.

New API getVariableValues()
You can now use the new API getVariableValues() to return an array of the current values of a specified variable. With this new API, you can transfer those returned variable values to other widgets, applications and stories, providing you with more flexibility to add interactivity between widgets or within your applications and stories.


New API getDimensionFilters()
You can now use the new API getDimensionFilters() to return an array of the current filter values of a specific dimension, also providing you with more flexibility when adding interactivity between widgets or within applications and stories. This new API supports single filter values, multi filter values, and range values.


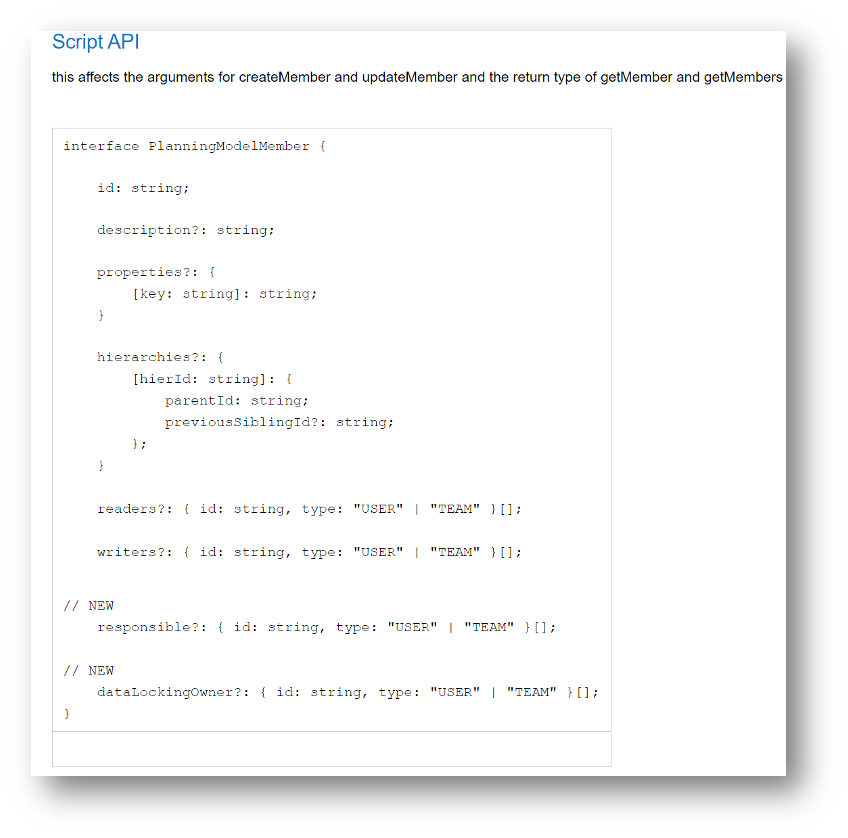
Planning Model Extension
Did someone say more flexibility when designing planning interfaces? You heard right. The Planning Model API has been extended, meaning you can now read and change a dimension member‘s data locking owner and responsible person.
System Runtime Messages
Have you ever gotten a system runtime error message but didn’t understand why? To provide more clarification, Analytic Application users will now be able to receive more details about system runtime messages for failures and error messages. This information will be displayed in the calendar for a scheduling tasks regarding the following scenarios:
- Export to PDF technical component is missing
- Variable input dialog is open for user input and blocks the workflow
- The script execution failed due to an error
- Error occurs during the export of a pdf
- The selected bookmark doesn’t exist anymore
- Error occurs during processing Data Change Insights
- When an applications developer forgets to use the Scheduling.publish() script when scheduling in manual mode

Data Integration
Default Data Mapping Inherited from SQL Source
When acquiring SQL data, default data mappings are now inherited from the source. The data type definition is directly passed through from the SQL source, and not inferred. This feature saves you from having to recreate the metadata in the wrangling view, saving you time and reducing any possible errors.

Tunnel Connection Type
Would you like to be able to share your business findings and insights with your external stakeholders, without giving them VPN rights? SAP Analytics Cloud administrators will now be able to create connections using the Tunnel connection type.
This connection type will allow users outside your corporate network to connect live to your data, without giving them VPN rights. The Tunnel connection can be created to an on-premise remote source through the SAP Cloud Connector. These sources include HANA, BW, and S4HANA.

Acquire Data from SAP HANA Using an SSL Connection
With SAP Analytics Cloud, security is at the top of our agendas. We are introducing a new option to configure an SSL connection when connecting to SAP HANA from SAP Analytics Cloud. This adds a higher level of security when you’re connecting to SAP HANA on-premise.

Data Visualization
Paste Filter Values in Story and Page Input Controls
Both story viewers and designers can now make changes to story and page filter selections faster, especially when working with a large list of values. Simply copy and paste filter values into the input control to either overwrite or append the existing selection when working with Acquired and HANA live Models.
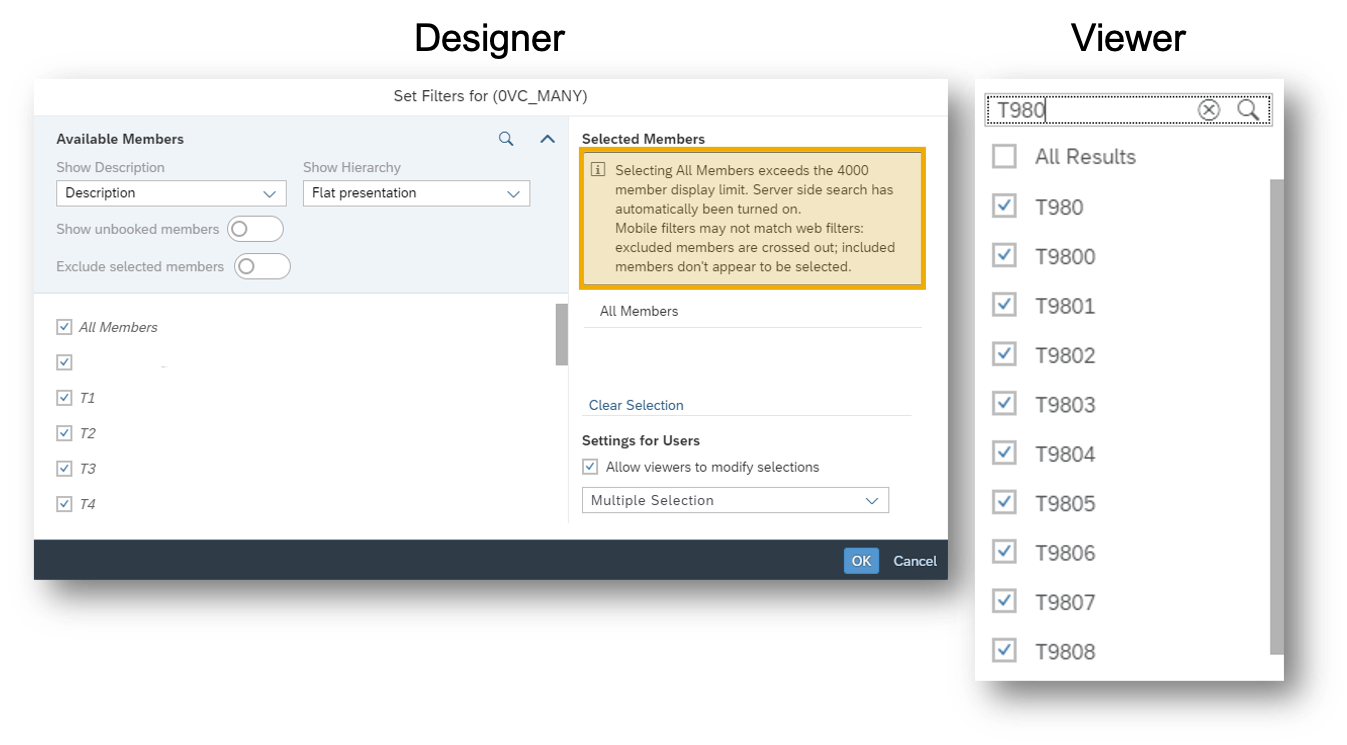
Remove Member Count Limitation for Input Controls Based on Flat Dimensions in BW
Story Designers can now create story, page, and Digital Boardroom topic filters with more than 4,000 members with BW live Models and other data sources on flat dimensions. This means that you can now access all of your input control members without any limitations, allowing you to easily access all the information you need.
The TRIM Function in Story Formulas
Story creators can now use the TRIM function in story formulas. This means you will now have the flexibility to trim string spaces in the story calculations rather than relying on backend data source calculation layers, overall reducing the turnaround times when creating and editing stories. This function is specifically useful when doing calculations on data from flat file uploads. TRIM is supported only for models based on Acquired or Live HANA connections.

BW Input Controls: Starts/Ends with Search Improvements
In SAP Analytics Cloud, you can now search for members with a certain pattern in input controls. This means, when searching in story and page filters, you can now specify “starts with” (a*) or “ends with” (*a) search terms. Please note that this is not a wildcard filter, meaning this only encompasses searches for existing members of the dimension. New members will not be automatically reselected. Also, it is important to note that this feature is only supported for Story and Page filters and not supported for Hierarchies.


Facet Loading Configuration in Explorer
When enabling Explorer views for visualizations in Stories, Story Designers can configure measures and dimensions to be included in the view. To improve performance when opening the Exploration View, by default, only dimensions used in the chart will be loaded as facets in Explorer. To see other configured dimensions, the viewer will need to select desired dimensions.
Story designers can disable the default for all configured dimensions to be loaded upon opening of Explorer View.

Mobile
Synonyms in Search to Insight on iOS
Quickly find the answers to your business questions right at your fingertips. iOS Mobile users can now view and define synonyms for measure and dimension names, which they can then easily search for in Search to Insight. The synonyms created will appear in the Search to Insight autosuggestions along with other measures and dimensions.
This new enhancement will provide more customization that is tailored to your business when searching for your answers on your mobile device.

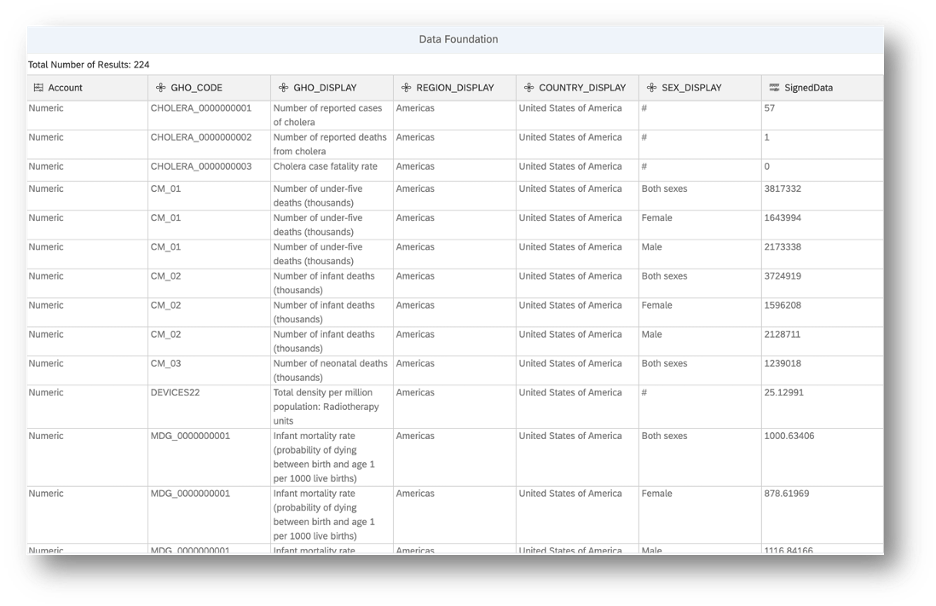
Modeling
New Viewing Options
For every organization, it’s essential to get the full picture of your data to make the most effective and meaningful business decisions. This is why we are introducing two new viewing options in SAP Analytics Cloud:

- “Structure View”: Will allow you to easily look at your models in a star schema style view, providing you a graphical, diagram-based modeling experience. This view works for account-based models.

- “Data Foundation View”: Will allow you to see the underlying fact data of your model from the “Model” tab. This view is synchronized with “List” and “Structure” views.
Planning
The Datediff Function
The Datediff function is now available for advanced formula steps in Data Actions. With this function, you can easily calculate the difference between two dates at a specified granularity.

Define In-Cell Charts and Thresholds
For BW queries, you can now define in-cell charts and thresholds for the second structure. In other words, you can now define both of your dimensions as a number definition dimension. This helps ease the setup of in-cell charts and thresholds for tables on BW queries in SAP Analytics Cloud.

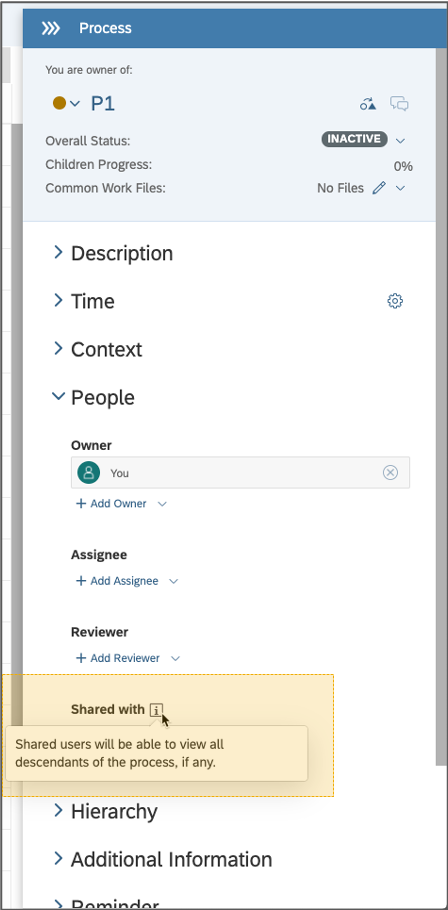
Apply Viewer Role to all Subtasks of a Calendar Process
By selecting the new “Shared with” icon in the Process panel, you can now simultaneously add a viewer to all child tasks of a Calendar process. As a viewer, you will be able to see all the descendants of a process that has been shared with you.
Use Three Dimensions to Define Dimension Combination Rule
In planning models, you can now create a maximum of three validation rules in one model and three dimensions per rule to define allowed member combinations across dimensions. This will add ease during the data entry process and will be useful when you are planning on more complex member combinations.

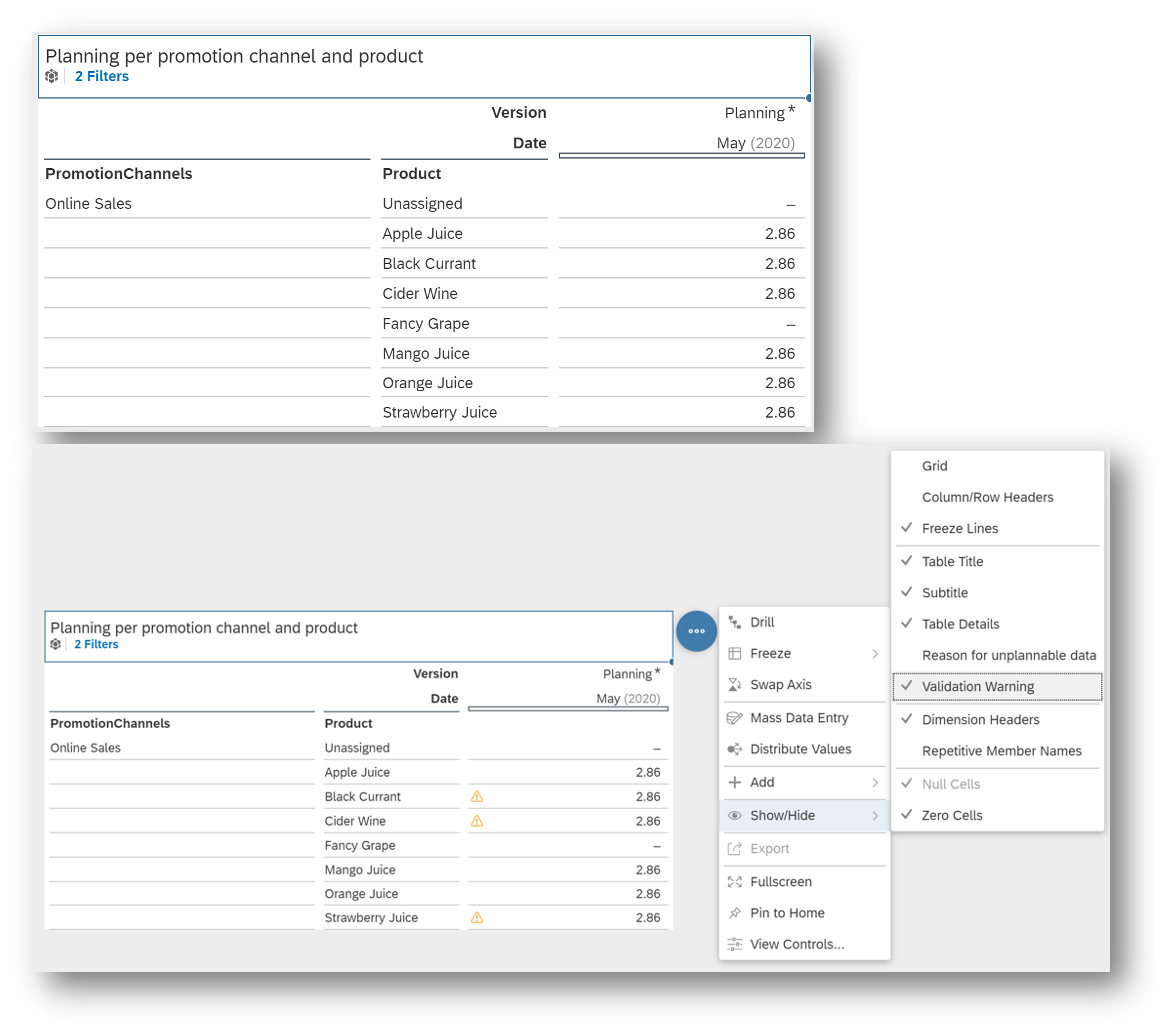
Validation Warnings
As a planner, you’ll now see validation warnings in your table, enabling you to quickly identify which values are invalid for data entry due to dimension combination rules. You can delete the value in these cells, but data changes will be reverted when you publish your version. These visual cues will help reduce errors and streamline the plan entry for users by highlighting valid dimensional combinations in-line during the data entry process.
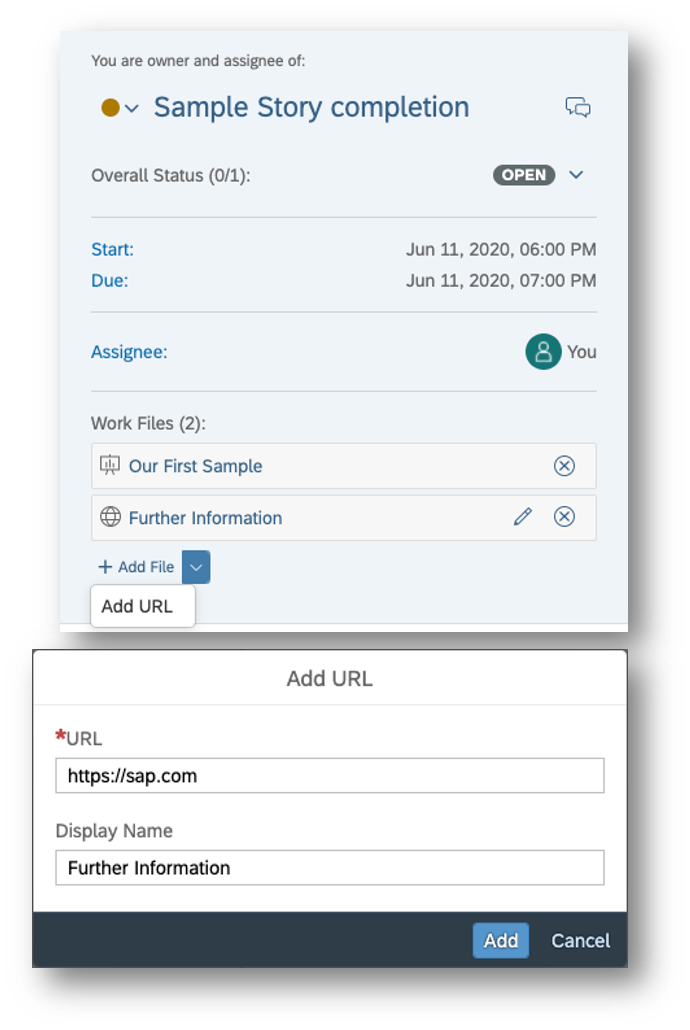
Work File Handling Made Easy for Calendar Tasks and Processes
For calendar tasks and processes, we have redesigned the header section in the Builder panel to provide a streamlined experience for accessing all relevant information. This update includes:
- Work files: A huge part of this redesign is that you can now find all the work files of a task or process in the header section, which are displayed as separate tokens.
- Add URL links as work files to your tasks: In addition to stories and analytic applications, you can add URL links as work files to your tasks or processes.
- Links that will instantly take you to a desired section in the Builder panel: Here, you can view relevant information in greater detail.
Platform Services
Schedule Story or Analytic Application based on SAP HANA 2.0 Live Data Connection
For those who are using a HANA 2.0 live data connection, we have a fantastic update for you. You can now schedule a Story or Analytic Application based on SAP HANA 2.0 live data connections, increasing the scope for sharing your stories and analytic applications with your teams and stakeholders. When creating or editing a Schedule Publication for your stories based on SAP HANA 2.0 Live Models, you will also be able to define and edit prompt values.
Check Maximum Number of Publications per hour
In SAP Analytics Cloud, you can now check the maximum number of scheduled publications per hour based on your license under System > Monitor > Overview > Maximum number of Publications every one hour.
Copy an Instance of a Schedule
It’s time to simplify your workload with this new enhancement. You can now copy an instance of an existing schedule from the calendar and reuse it with new date and time. By default, the existing values of the scheduling parameters are available and can be modified after copying the schedule. This feature will help simplify your workflow, particularly when you want to copy and rerun a failed schedule with the same parameter or copy a schedule and modify some of the parameters.
Smart Assist
Predictive Forecast on a Planning Model at Y/H/Q/M Time Hierarchies
Currently, SAP Analytics Cloud allows you to run a predictive forecast on a monthly, quarterly, half-year, and yearly basis. With SAP Analytics Cloud Planning, you will now be able to run a predictive forecast on a planning model at Y/H/Q/M time hierarchies, even when the lowest level granularity of your model is “Day.” This provides you with more flexibility when you are working with predictive forecasts for planning models with different time granularities.

Enriched Smart Insights for Formulas
We’ve enhanced Smart Insights for formulas! First, you can now hover over a measure to quickly see its corresponding values. The second exciting enhancement is that you can now trigger Smart Insights from Measures in the Smart Insights Panel. These insights are automatically generated, which helps you and your business increase efficiency when working with formulas.

Smart Insights on a Data Point Calculated Using the MIN and MAX Aggregation Types
You will now be able to get Smart Insights on a data point that was calculated using the MIN and MAX aggregation types. With this enhancement, you can access useful insights for more calculation types.

Smart Insights on Data Points that Represent Account Dimensions
Currently, SAP Analytics Cloud supports Smart Insights on data points representing account dimensions which have Income (INC) and Expense (EXP) as financial account types. We are extending this support as you will now be able to receive Smart Insights on data points that represent account dimensions which have Liabilities & Equities (LEQ) and Assets (AST) as financial account types.
With this enhancement, Planners can access valuable insights for more financial account types.

Enhanced Dynamic Text on the Footer
We’ve added a visibility enhancement for dynamic text on a chart footer. When you add Smart Insights as a footer on your chart, the enhanced dynamic text will now call out the highest contributor to your chart and make reference to all Smart Insights that are available in the Smart Insights panel.

Improved Visibility of Leak Variables and Chart Details on Smart Discovery
In Smart Discovery, we’ve improved visibility of leak variables and chart details information.

Smart Predict
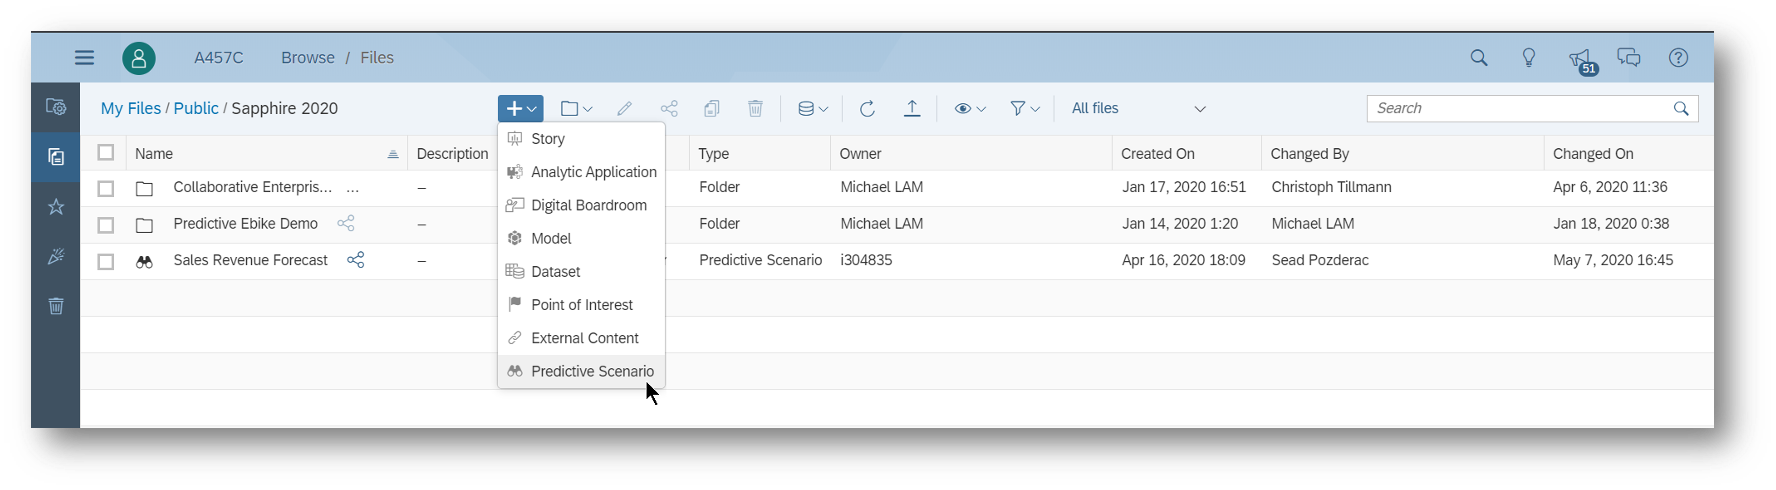
Predictive Scenarios in Files Area
In SAP Analytics Cloud, predictive scenarios will now be created and stored in the “Files” area. Here, you can also store your predictive scenarios alongside your favorite models, stories and other files. This update provides you with a layer of security when working with your predictive scenarios as you can decide which scenarios are visible to your teammates or to specific users.
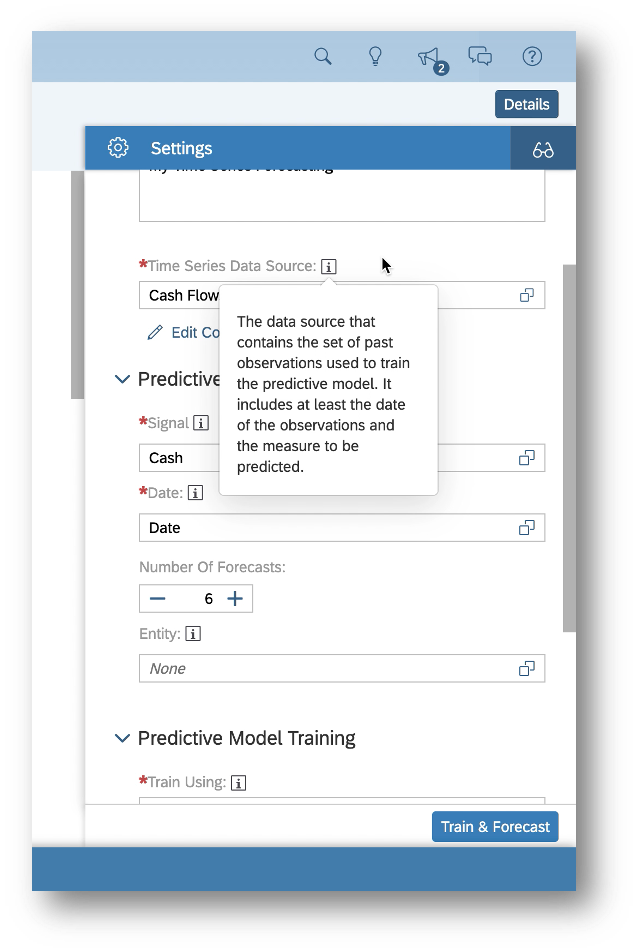
Redesigned Settings Panel in Predictive Models
Did someone say more improvements? Yes, you heard right because we have made improvements to the Settings Panel, providing you with a smoother user experience when creating and editing predictive models. The new enhancements for the Settings Panel include:
- On-demand contextual “Help” for entry fields with the associated information (i) icon.
- Click the (i) to display the “Help” dialog, which provides an explanation of the entry requirement for the specific field.
- We’ve made key terminology changes to make complex predictive concepts more understandable.
- Predictive modeling parameters and options have been regrouped to facilitate predictive model creation. This will make it easier to define your predictive goal.
- New messages inform and guide users when a selected parameter or option isn’t available in the data source, along with default placeholder values in fields.
Moving Predictive Scenarios to Files Area
In SAP Analytics Cloud, predictive scenarios can now be moved from the Browse Predictive Scenarios area to the “Files” area into a selected public folder. The Predictive Scenario Migration feature supports single filter values, multi filter values, and range values.
This update provides you with a layer of security when working with your predictive scenarios as you can decide which scenarios are visible to your teammates or to specific users.
- SAP Managed Tags:
- SAP Analytics Cloud,
- Data and Analytics,
- SAP Business Technology Platform
Labels:
You must be a registered user to add a comment. If you've already registered, sign in. Otherwise, register and sign in.
Labels in this area
-
ABAP CDS Views - CDC (Change Data Capture)
2 -
AI
1 -
Analyze Workload Data
1 -
BTP
1 -
Business and IT Integration
2 -
Business application stu
1 -
Business Technology Platform
1 -
Business Trends
1,661 -
Business Trends
87 -
CAP
1 -
cf
1 -
Cloud Foundry
1 -
Confluent
1 -
Customer COE Basics and Fundamentals
1 -
Customer COE Latest and Greatest
3 -
Customer Data Browser app
1 -
Data Analysis Tool
1 -
data migration
1 -
data transfer
1 -
Datasphere
2 -
Event Information
1,400 -
Event Information
64 -
Expert
1 -
Expert Insights
178 -
Expert Insights
273 -
General
1 -
Google cloud
1 -
Google Next'24
1 -
Kafka
1 -
Life at SAP
784 -
Life at SAP
11 -
Migrate your Data App
1 -
MTA
1 -
Network Performance Analysis
1 -
NodeJS
1 -
PDF
1 -
POC
1 -
Product Updates
4,577 -
Product Updates
324 -
Replication Flow
1 -
RisewithSAP
1 -
SAP BTP
1 -
SAP BTP Cloud Foundry
1 -
SAP Cloud ALM
1 -
SAP Cloud Application Programming Model
1 -
SAP Datasphere
2 -
SAP S4HANA Cloud
1 -
SAP S4HANA Migration Cockpit
1 -
Technology Updates
6,886 -
Technology Updates
401 -
Workload Fluctuations
1
Related Content
- SAP Enable Now setup in Technology Blogs by Members
- Best practice how to deal with action parameters in RAP service in Technology Q&A
- S/4HANA 2023 FPS00 Upgrade in Technology Blogs by Members
- 演示模式:Digital Boardroom 核心功能在优化故事体验中的替代 in Technology Blogs by SAP
- The requests received by the Report Processing Server have the format of an old version in Technology Q&A
Top kudoed authors
| User | Count |
|---|---|
| 11 | |
| 10 | |
| 9 | |
| 9 | |
| 7 | |
| 7 | |
| 7 | |
| 6 | |
| 6 | |
| 5 |