Technology Blogs by SAP
Learn how to extend and personalize SAP applications. Follow the SAP technology blog for insights into SAP BTP, ABAP, SAP Analytics Cloud, SAP HANA, and more.
Turn on suggestions
Auto-suggest helps you quickly narrow down your search results by suggesting possible matches as you type.
Showing results for
former_member75
Participant
Options
- Subscribe to RSS Feed
- Mark as New
- Mark as Read
- Bookmark
- Subscribe
- Printer Friendly Page
- Report Inappropriate Content
11-17-2020
11:49 PM
This blog covers the new features and enhancements in the SAP Analytics Cloud and SAP Digital Boardroom Q2 2020 Release.
Please note that the SAP Analytics Cloud Help documentation is updated at the same time as the upgrade to this release, so the links here may not yet reflect what is described below until after the upgrade is complete.
Make sure to Upgrade your SAP Analytics Cloud agent to the latest agent version 1.0.271 to take advantage of all the data acquisition types!
Requirements
These are the data acquisition minimum requirements:
- Version 1.0.99 for SAP ERP / SQL databases
- Version 1.0.235 for SAP HANA view
- Version 1.0.91 for SAP Universe (UNX)
- Version 1.0.233 for SAP Business Warehouse (BW)
- Version 1.0.75 for all other data source types
For more information, see the SAP Analytics Cloud System Requirements and Technical Prerequisites.
SAP Analytics Cloud fully supports Microsoft Edge and Google Chrome for all activities and areas of SAP Analytics Cloud including viewing, authoring and administration.
Highlighted Feature Updates
The features listed in the highlights section are the top feature enhancements in Q2 2020.
- Administration & Infrastructure:
- Support for Safari
- Analytics Catalog
- Manage Team-specific Folders
- Quicker Access to Content from the Home Page
- Data Visualization:
- Custom Hierarchies/Groups for BW Live
- Export Story Content to Power Point
- User-defined hierarchies with custom shape files in the geo choropleth layer on SAP BW
- Custom sort for dimension members in SAP BW
- Input Controls Search Improvements
- Restricted Measures with Constant Selection on a Subset of Dimensions
- Smart Assist:
- Live Universe Connection in Search to Insights
- Story Filter in Search to Insight
- Enhanced Simulation View
Additional Feature Updates
- Administration & Infrastructure:
- Self-service IdP maintenance
- View Recent Files
- Publish Content for All Users
- Create URLs to Share Content
- Analytics Designer:
- OData Services on more SAP systems
- Referenced custom widgets in exported archives
- New APIs
- Improved Adding Widget Menu
- Restore the latest deleted widget
- Error count on Analytic Application
- Edit Button
- onBeforeExecute event
- Copy Widgets Across Browser Tabs
- Enhanced Tabs in Builder Panel
- Data Locks
- New API to send a notification
- New APIs to move widgets
- New API to apply bookmarks at run time
- API DataSource.setDimensionFilter() supports range filters and exclude filters
- New APIs for SAP BW models
- New API to improve the existing read access to OData services
- Data Integration
- Export blank values as the specified value
- Import from SAP HANA views based on XS Advanced
- Support for more Open Connectors data sources
- Live Data Connection to SAP Data Warehouse Cloud
- Data Visualization
- Widget Filters on Dynamic Time Using a Custom Current Date
- Favorite Story and Boardroom in View Time
- Choose between ID and Description Display of Member Input Controls
- Disable Data Label Rounding in Charts
- Responsive Layout as Preferred Page Type
- Show/Hide Data Markers On Line Charts And Combined Line Charts
- Display Measure Values in the Bubble Layer of a Geo Map
- Enhanced Number Format Capabilities for Geo Maps
- Search and viewing enhancements for widget filters and input controls
- Mobile:
- Easier navigation
- Support for story metadata
- Access specified content
- Query time in Search to Insight
- Query Live Data Models in Search to Insight
- Single-sign-on experience
- Support for Xcode-11
- Home Tab on Android
- Language Enhancements on Android
- Planning:
- Export data from SAP Analytics Cloud to S/4HANA Activity Type Plan Cost Rates
- Return the current Coordinated Universal Time in Advanced Formulas
- Set Completion Options to Ignore
- Enhanced Table experience
- Reference another time dimension for time functions NEXT/PREVIOUS
- Show Units and Scale in cell
- Open the data locking editor from a Data Locking Task
- Platform Services:
- Defining Prompt Value while scheduling a story
- Permissions to discuss and comment
- Multi-Lingual Support
- Smart Assist:
- Histograms in Search to Insight
- Smart Insights in Explorer and Digital Boardroom
- Enriched Smart Insights for calculations
- Search using number abbreviations In Search to Insight
Highlighted Feature Updates
Administration & Infrastructure
Support for Safari
SAP Analytics Cloud now supports the Safari browser for the following use cases:
- Consuming applications created by Analytics Designer on iPad in embed mode.
- Viewing Canvas/Responsive stories on Mac for all embedded scenarios with different solutions like SAP S/4 and Success Factors.

Analytics Catalog
With the Analytics Catalog, a new Home Page tab is provided where Stories, Analytic Applications, Digital Boardrooms and other external content can be published to help make them easily discoverable for SAP Analytics Cloud end users.
The ability to add enhanced meta-data and filters can help end users find and learn more about the content.

To get started, you’ll need to do a bit of administrative planning/setup in SAP Analytics Cloud. Check out our blog for an overview.
The catalog is initially turned off, so once you have setup who can publish to the catalog, you will then need to turn it on. As an administrator, go to System > Administration and click the Catalog tab. In the Home screen, the Visible Tabs section is where you can turn on the catalog.
Manage Team-specific Folders
You can now manage team-specific folders the same way you can manage other folders. This addition gives admins more control over the Team folders, including being able to rename and delete them, improving file repository organization.

Quicker Access to Content from the Home Page
The Home page now includes the following features to let users and teams quickly discover and access important content:
- A Favorites tab dedicated to all the content you have designated as "Favorites"
- A Shared with Me tab listing all the content that has been shared with you by other users
Note that this feature is disabled by default, and tenant admins can turn it on via the administration settings.

Analytics Designer
Support for SAP Data Warehouse Cloud
An application creator can now create an analytic application based on an SAP Data Warehouse Cloud space in SAP Analytics Cloud. This increases the scope of the data you can choose from when designing analytical applications.

Copy widget to Analytic Application
Users can now copy widgets from a story to analytic applications at design time within the same browser page. Copying can be achieved via ctrl +c and ctrl + v, or via the copy feature on the quick menu. All the property capabilities on the widget itself will be copied over.
Supported features: State of the widgets (calculated measures, features created by the building and styling panel), copying widgets to container or a popup, copying grouping widgets (without group information), chart in smart insight panel, etc.
Not supported features: Value Driver Tree, Input Control, linked analysis, story filter, geo polygon filter, etc. In a word, the properties that are saved within the entire story.

Data Integration
Remove Duplicate Rows
Duplicate rows in the dataset can be removed while creating a public model. You can find the option "Remove duplicate rows" in the Actions tab. Initially, the duplicates are removed from the sample. Once the "Create Model" button is clicked, the duplicate rows are removed from the entire dataset.
This helps you keep your dataset lean and clean.

Expanded Limits for Acquiring Data
Great news! We have increased the data acquisition limits for handling large amounts of customer data for models and datasets. This will be available for sources such as Business Warehouse, Business Objects Enterprises, HANA, SQL, and BigQuery.
- Data acquisition will now have a cell limit of 100 million cells and 100 columns per load.
- Datasets will now have a cell limit of 1 billion cells and 1000 columns per load.
Data Visualization
Custom Hierarchies/Groups for BW Live
Story designers want to organize members of different dimension groups. When working on a story, you can define custom hierarchies on BW dimensions. These hierarchies can be used in charts, tables and even input controls and filters. The definition of a new hierarchy always starts from the flat dimension. Changing the Variables will reset all custom hierarchies.
Please note that this new feature requires BW 7.5 SP16 and notes 2865887, 2865929.

Export Story Content to PowerPoint
We’ve released the ability to export a story to Microsoft PowerPoint, allowing users to easily include stories in their presentations and streamline their workflow. Each exported story page will be one image on a PowerPoint slide.
This feature has the same capabilities and limitations as exporting stories to PDF or Google Slides.

User-defined hierarchies with custom shape files in the geo choropleth layer on SAP BW
For SAP BW, you can now consume user-defined hierarchies with custom shape files in the geo choropleth layer. It allows you to drill down to a specific level. For example, you can access level two with one click.

Custom sort for dimension members in SAP BW
You can now set up a custom sort for dimension members in tables, visualizations and Explorer. Flat list and Hierarchy are sorted only within the same hierarchy level and Characteristic Structures.
This can be shared between the same model within the same story.

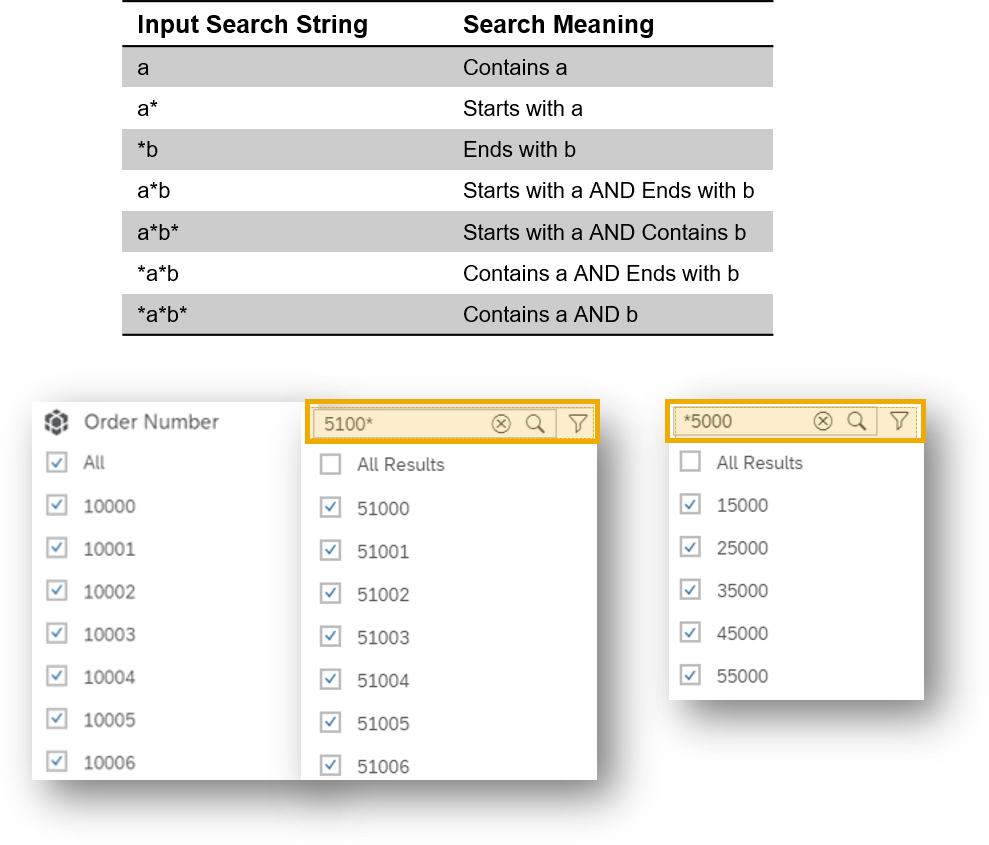
Input Controls Search Improvements
You can now search for members with certain patterns in input controls. Note that this feature works only for searches of existing members of the dimension. New members are not automatically reselected. It is available for Acquired and HANA Live models only, and not supported for Hierarchies.
Restricted Measures with Constant Selection on a Subset of Dimensions
We have made improvements to Restricted Measures as you can now create restricted measures that allow you to select dimension(s) that you want to hold constant or fixed. What this means is you now have the flexibility to bypass conflicting filters and breakdowns for a selected subset.
An example of where this would be useful is for creating complex comparison calculations between members of the same dimension, allowing you to effectively compare your data in analysis.

General
SAP Analytics Cloud, add-in for Microsoft
We are excited to introduce the SAP Analytics Cloud add-in for Microsoft Office! We are combining the best of the Excel 365 interface with the planning and analytic benefits of SAP Analytics Cloud. Here are some of the highlights for this new add-in:
- Connect: Engage with colleagues on plans using any laptop at work, home, and on the road.
- Plan: Plan, analyze, and simulate with the familiar Microsoft Office user experience.
- Explore: Use built-in formulas and easily generate ad hoc reports.
You can download the add-in for free from the Microsoft Office store. All you need is your SAP Analytics Cloud license to get started.


Available on Android
To all Android users, the SAP Analytics Cloud Mobile App is now available for you! You can discover mobile-enabled Stories by using the global search or navigating through the content folders. From now on, you can view and work on stories via your phone anywhere, anytime.

Create validation rules to define valid ranges of data
In planning models, you can now create validation rules to establish relationships of members across different dimensions to restrict planned data entry. For example, you may want to restrict planning to only a few products in a given geography. With this capability, you can set relationships based on attributes to enforce this type of restriction.

Calendar Integration for Reviewer in Story
When you're reviewing a story that's part of a calendar task, you can access it through the new status bar, which is located on the top of the task-connected story. It also shows calendar information when hovered over, together with Submit, Reject, and Details buttons.
This update saves you unnecessary clicks to switch back and forth between the Calendar and the story.

Platform Services
Schedule Publications
Scheduling publications on stories and analytical applications will allow you to create a schedule with recurring patterns and allow you to distribute the content as a PDF over email. With the same story, you can customize the publications using bookmarks to send more relevant information to your colleagues and even to external audiences.
This new feature greatly improves the distribution of your stories and analytical applications. Auditors and business managers rejoice! With this new feature, you’ll be able to maintain historical data from your content at any pre-defined frequency.
SAP BW and HANA Prompt Variables are supported. On the Calendar, you are able to see the status of your scheduling job. Please note that scheduling is only available on Cloud Foundry.

Smart Assist
Live Universe Connection in Search to Insight
Search to Insight can be used on Live Universe Connections. The model needs to be indexed in the Model Settings and requires Live Universe 2.3. This will help your end-users quickly ask questions of their data from the live universe connection.

Story Filter in Search to Insight
When you open Search to Insight from a story, all story filters are automatically applied in the question you ask. Only filters affecting the specific chart get displayed. This update makes it easier for you to dig deeper into the filtered data, simplifies your workflow and makes the experience with Search to Insight more seamless.

Enhanced Simulation View
For your business, it’s really important to answer the question “What would happen if…? To better help you answer that question for all your new stories, our impact simulator replaces the original waterfall chart.
This will better explain your simulation results, help you forecast possible scenarios and make smart business decisions.

Additional Feature Updates
Administration & Infrastructure
Self-service IdP maintenance
You can now use the Identity Provider Administration tool to manage the custom identity provider configured with SAP Analytics Cloud. This can be used to recover your IdP configuration in case of unexpected interruption. For example, you can upload new metadata for the current custom identity provider or revert to using the default identity provider.

View Recent Files
You can now open recently accessed files on the Recent Files widget located on the Home Page. This update saves you time navigating to your recent work and opening the files you use most often. You need to turn this feature on in the administration panel as it is turned off by default.

Publish Content for All Users
The ability to publish to “All Users” has been added to the Publish To Catalog dialogue box. This allows you to publish content to all current and future users of an SAP Analytics Cloud system.

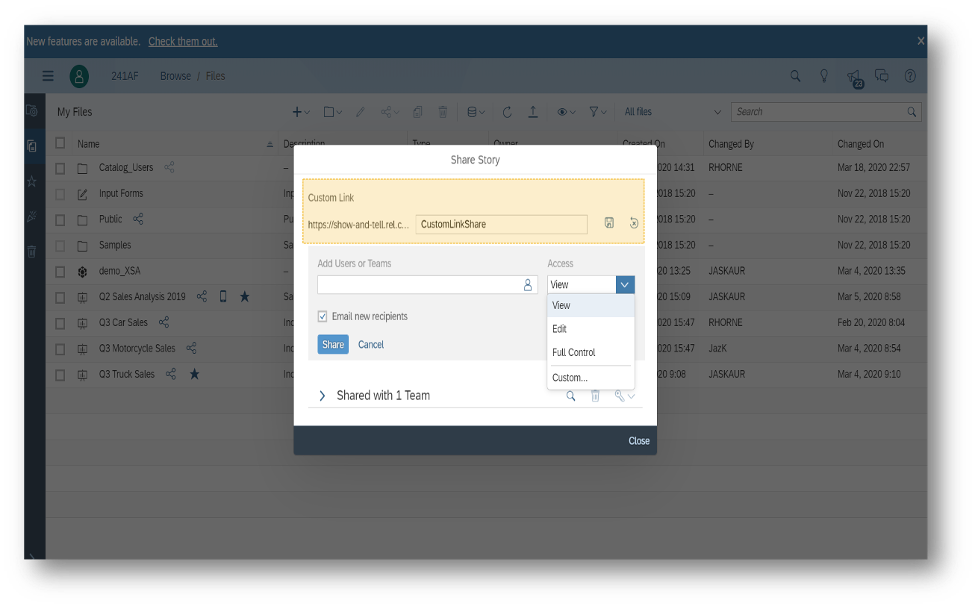
Create URLs to Share Content
When sharing content, the default link can be quite lengthy and nonspecific. You will now be able to customize your URL when sharing content. This way, you can make your links more understandable and sharable for your teammates and other users.
Analytics Designer
OData Services on more SAP systems
In addition to SAP S/4HANA live connections, you can now define OData Services in analytics designer based on SAP BW systems, SAP HANA systems, and SAP Business Planning and Consolidation (BPC) systems. Additional back-end support is added, so you can trigger Odata actions on data from more SAP systems.

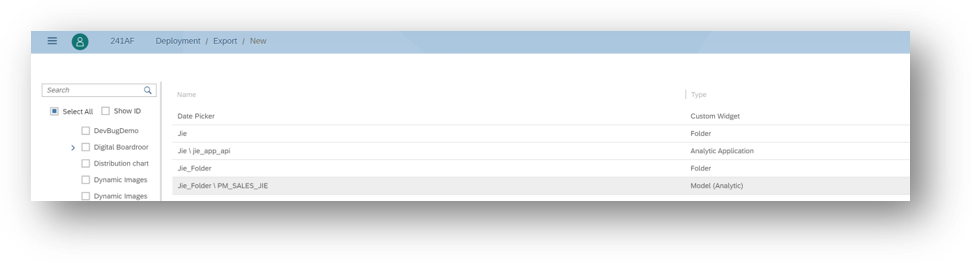
Referenced custom widgets in exported archives
Custom widgets enable you to create your own visualizations. With this new enhancement, you can export analytic applications that contain all referenced custom widgets by default. This will guarantee you access to all custom widgets, saving you time and trouble.
New APIs
There are two new scripting APIs for BW and HANA Live connections:
- removeVariableValue()
- copyVariableValueFrom()
You can set, remove or copy the variables values when editing your script for analytical applications. In the story or application, the variables are merged by default, which means any changes you made on the variables will affect all tables and charts the variables are used.
You can choose to set Table Variables to let the variables be unmerged on the widget, meaning that only a particular chart will be affected if you make any changes. Have fun with the extra scripting capabilities from this update!

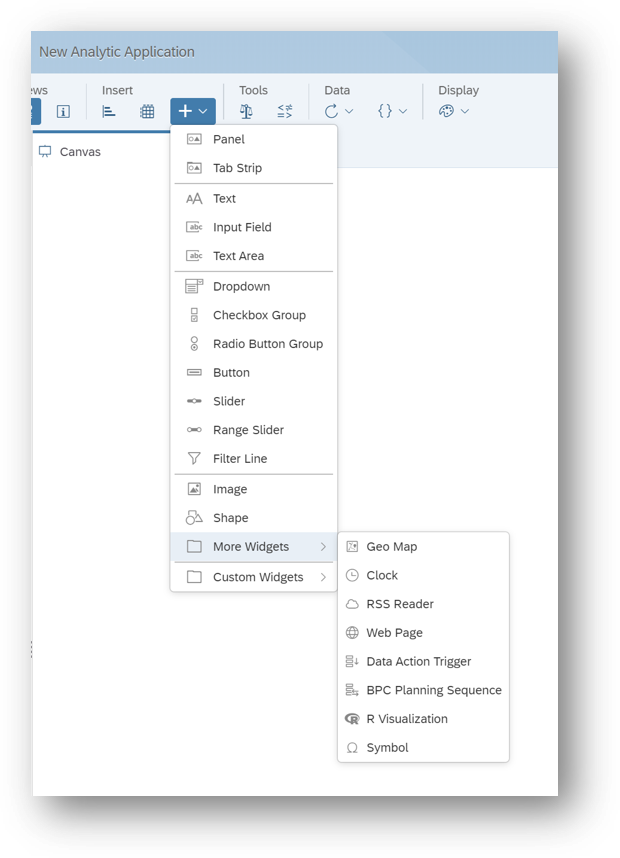
Improved Adding Widget Menu
The adding widget menu gets longer with each new widget added, so we have enhanced it by regrouping some widgets. Widgets that are not used frequently are regrouped in “More Widgets”. Custom widget is also separated on the widget menu. New groupings give developers easier navigation to work on their widgets.
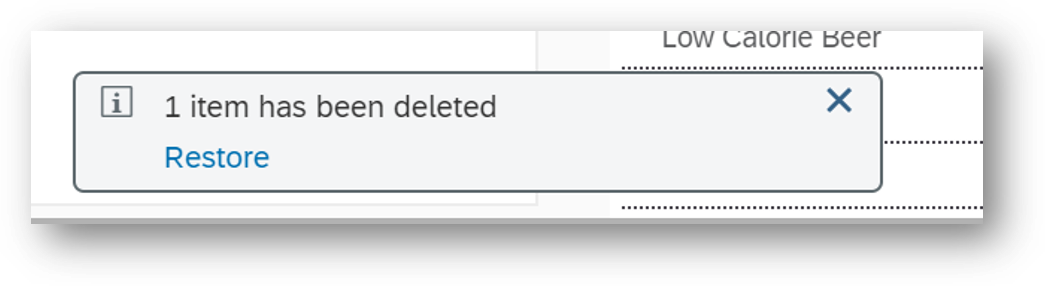
Restore the latest deleted widget
Accidentally deleted a widget when working on Analytic Designer? Don’t worry. With this update, you can restore the deleted widget or technical component within the ten seconds after you deleted it. The restored item will keep the previous state so you can easily pick up where you left off.
Error count on Analytic Application
We now show the error count on the information panel toolbar’s icon of your analytic application. This will help inform the application developer instantly when the application has an error.

Edit Button
When you’re running Analytic Applications, you can now use the Edit button in the toolbar of an executed application to enter edit mode. The Edit button is not available in Microsoft Internet Explorer and is only displayed for application users with corresponding permissions.
Quickly switching from run time to design time increases your efficiency when designing an Analytic Application.

onBeforeExecute event
As an application designer, you can now use the onBeforeExecute event for the Data Action Trigger and the BPC Planning Sequence.
You can use this event to add any scripts that should be executed before the data action trigger/Planning is executed.
So now you have more flexibility and room for creativity when designing applications.

Copy Widgets Across Browser Tabs
You can now copy widgets from story to analytic applications and application to application at design time across different browser tabs.

Enhanced Tabs in Builder Panel
Application developers can now rename and reorder tabs in the Builder Panel. The name and order of the tabs within a Tabstrip in Builder Panel is synchronized with the outline. In the outline, application developers can reorder the tabs within the same Tabstrip via drag and drop. New scripting APIs for the tabs are also provided.
Your capability to organize the Tabstrips of your applications is enhanced, making it easier for your viewers to consume the information.

Data Locks
When working on a planning application, the developer can now use the menu entry Data Locks at design time to display locked cells in the table. Now the Data Locking display is available at both design and run time.

New API to send a notification
Application developers can now use the Application.sendNotification() API to send a notification when an analytic application is running on the backend, i.e. scheduling. You can use scripting capabilities to configure the notification.
Users can receive the notification via email or the notification panel. A maximum of three notifications can be sent per scheduling job.

New APIs to move widgets
Application developers can now decide to move widgets or containers dynamically to other containers at application runtime to cover dynamic layout scenarios.
Supported container widgets are canvas, panel or tab strip.
Provided scripting APIs:
- Application.moveWidget();
- Tabstrip.moveWidget();
- Panel.moveWidget()

New API to apply bookmarks at run time
Application developers can now use the BookmarkSet.apply() API to load/apply bookmarks at run time. This scripting API needs to be related to the technical component of a bookmark, Bookmark Set. This new feature lets designers load bookmarks more conveniently.
The included widgets within the bookmark definition will be reloaded. The status of non-included widgets within the bookmark definition will be kept.

API DataSource.setDimensionFilter() supports range filters and exclude filters
Application developers can now use the scripting API DataSource.setDimensionFilter() to support:
- Range filters
- Excluding members with single and multiple filter values

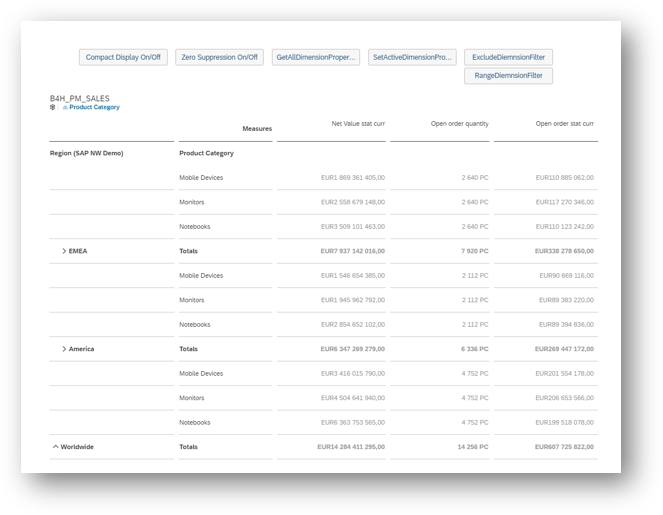
New APIs for SAP BW models
Application developers can use the following scripting APIs for SAP BW models in the table widget:
- Table.setCompactDisplayEnabled()
- Table.isCompactDisplayEnabled()
- Table.setZeroSuppression()
- Table.isZeroSuppressionEnabled() table axis.
- DataSource.getDimensionProperties()
- Table.setActiveDimensionProperties()
- Table.getActiveDimensionProperties()
This allows application designers to customize the table design. For example, when a user wants to open a chart in a popup / fullscreen container, the application developer can move the table to that popup / fullscreen container directly – with all the interaction states kept.
New API to improve the existing read access to OData services
You can now use the API getEntitiesCountFromEntitySet to improve the existing read access to OData services by enabling the OData system query options for “filter”, “orderby”, “select”, “count”, “top”, and “skip”.
The new API works like the getEntitiesFromEntitySet API but returns the count instead of an entity list.

Data Integration
Export blank values as the specified value
When exporting data using an SAP Analytics Cloud property for the target member ID, users can now export members with blank property values. Member values acquired from BW system are sometimes empty, and users using SAP Analytics Cloud for planning purposes may want to export them as empty or replace them with a default value.
This new functionality helps ensure the completion of data throughout the analyzing process.

Import from SAP HANA views based on XS Advanced
This feature enhances existing on-premise data acquisition from HANA to support XSA based HANA Views.

Support for more Open Connectors data sources
We now support more data sources via SAP Open Connectors: Autotask CRM, Close, ConnectWise CRM, Infusionsoft CRM, Insightly, and Box. Users can acquire data from one of these sources and create a model based on imported data. Note that the users must be on a Cloud Foundry tenant and have the Open Connectors account.

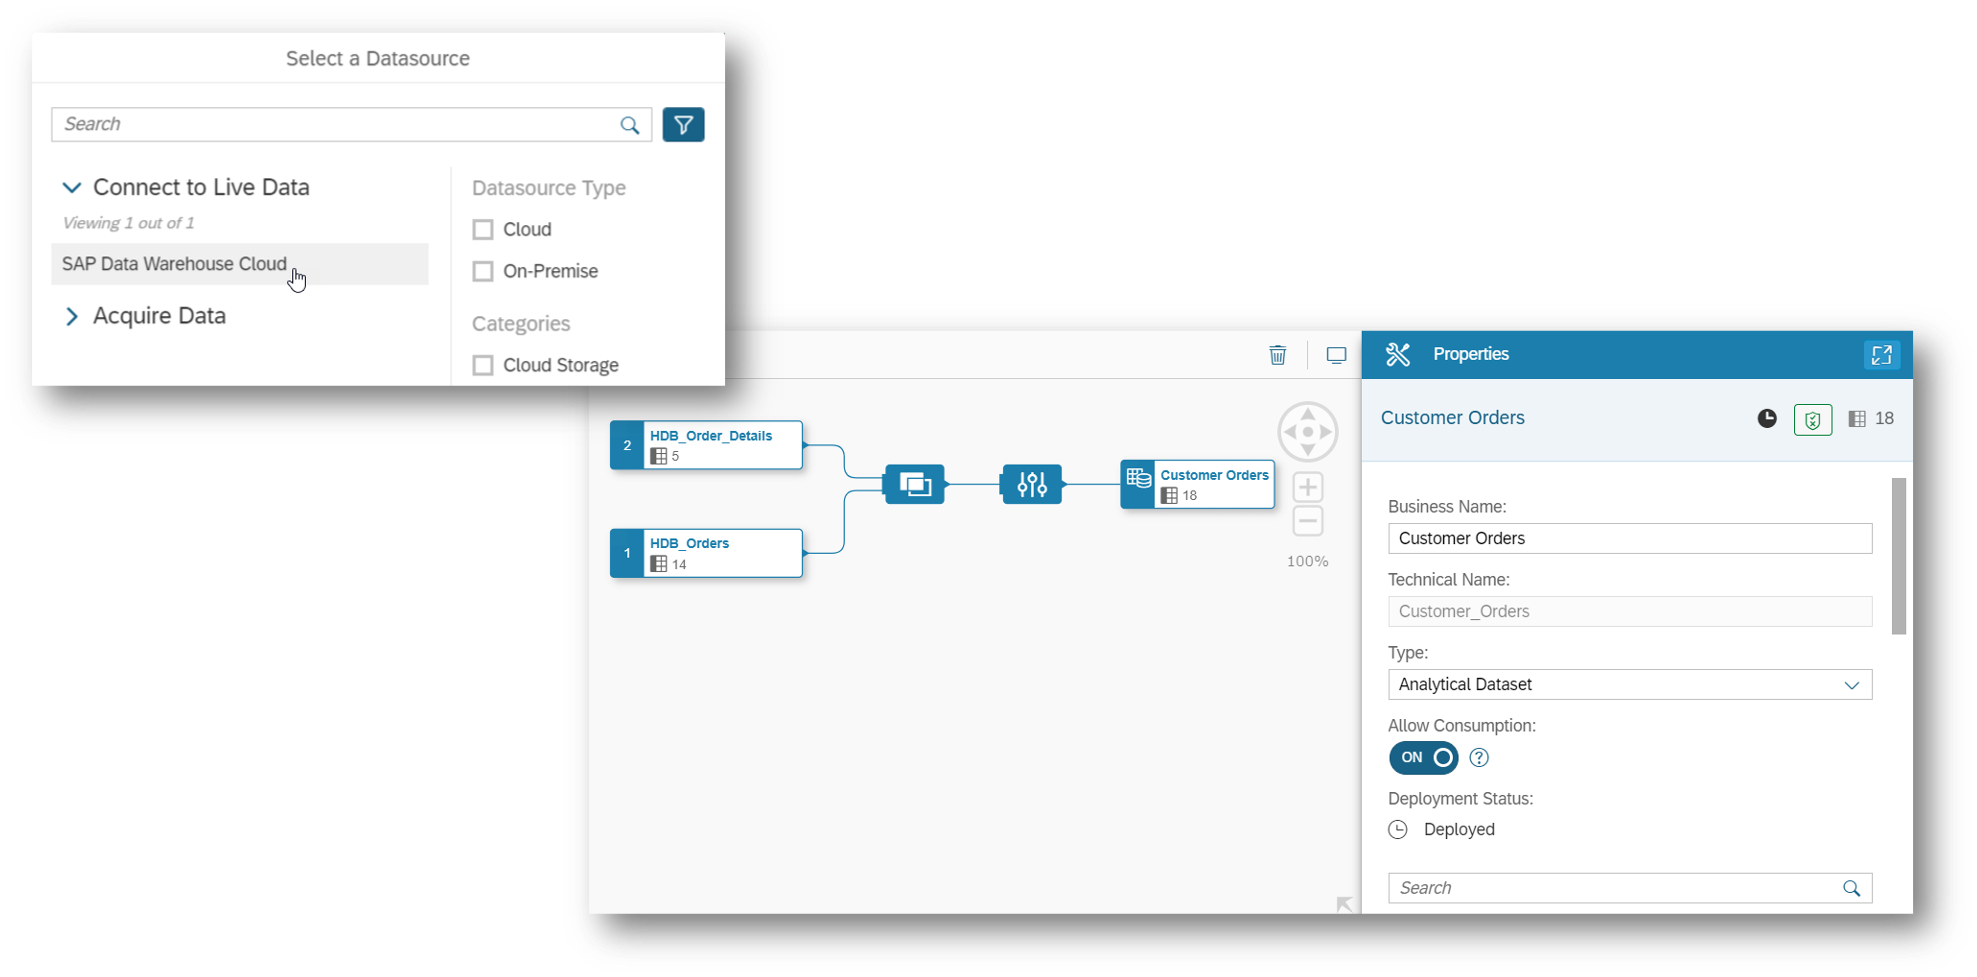
Live Data Connection to SAP Data Warehouse Cloud
For all of you SAP Data Warehouse Cloud users out there, we have some exciting news! You can now leverage and combine the data management and modeling capabilities of SAP Data Warehouse Cloud with SAP Analytics Cloud. By creating a live connection in the Connections area to your SAP Data Warehouse Cloud tenant, content creators can build stories with the data that is modeled in SAP Data Warehouse Cloud.
It’s time to start visualizing your analytical datasets and design compelling stories with this new integration.
Data Visualization
Widget Filters on Dynamic Time Using a Custom Current Date
Now you have the ability to create widget filters with dynamic time ranges based on a “custom current date”. Viewers can control the current date used for the dynamic time range, so they can have more options when it comes to working with data in different timelines. Note there is only one custom current date input control, which is located in the filter bar.
This feature is currently not supported on Geo Maps.

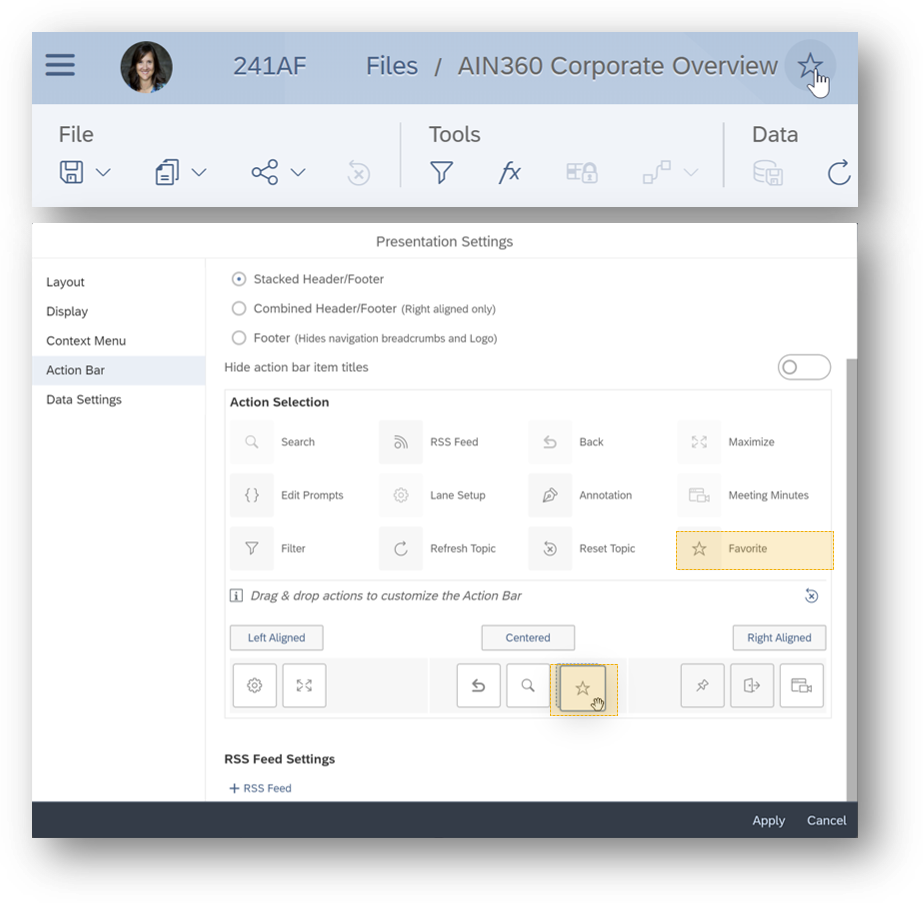
Favorite Story and Boardroom in View Time
You can mark your story or boardroom as “favorite” during view time, making it easier and faster to open and pick up where you left at a later time. In all new boardrooms, you can find “favorite” in the action bar; as for the existing ones, you can add them through settings.
Choose between ID and Description Display of Member Input Controls
Users can select whether to display ID, description, or both in an input control, to better select members in a filter. Searching for members is based on the display settings. The selection can be changed during view time and is persisted in bookmarks.

Disable Data Label Rounding in Charts
Some chart types round the data labels in favor of a cleaner visualization. Although Data Label Rounding remains the default, you can disable it by unchecking “Round Data Label Values”. Chart types supported include: Bar/Column, Combined Column and Line, Stacked Bar, Waterfall, Heat Map, Tree Map, Marimekko, Bubble.

Responsive Layout as Preferred Page Type
The use of responsive pages is being encouraged through small UI changes, so your stories can automatically resize to fit on different devices or screen sizes.
When creating a new page, Responsive Layout is suggested first, and stories created by Data Exploration use responsive pages by default.

Show/Hide Data Markers On Line Charts And Combined Line Charts
Show/hide data markers on line charts and combined line charts are now available. When you choose to hide data markers, thresholds will also be hidden. This update simplifies your visualization and increases the readability of your charts.

Display Measure Values in the Bubble Layer of a Geo Map
Now you have the ability to show measure values in the bubble layer of a Geo Map. You can choose to display the color, size, or measure values.

Enhanced Number Format Capabilities for Geo Maps
We have enhanced our number formatting styling capabilities, so you can adjust the scale, scale format, and decimals when working on geo maps. All values also update in tooltips, even when they’re hidden.

Search and viewing enhancements for widget filters and input controls
When viewing a story page, you can now choose whether to display (and search) the ID, Description, or ID and Description for widget filters and input controls. This action can be done through the “more actions” menu or the right-click menu.

Mobile
Easier navigation
Mobile users can now easily navigate to their desired content through the following:
- A new Home tab containing favorite and featured content, as well as recently viewed items.
- A new Files tab to view all the folders and files containing stories and presentations enabled for mobile.
- Settings are now available under the Profile icon.
- Global search on both the Home and Files tabs for accelerated content discovery.

Support for story metadata
The SAP Analytics Cloud Mobile App now supports translated, user-defined story metadata based on acquired data connections. Multilingual communication will offer a competitive advantage to companies in the wave of globalization.

Access specified content
Now when a user creates a link to share a story with others on the Mobile Application, it will include specified filters, page indexes, and prompts, so the receiver of the link can access the specified content with ease. This feature greatly improves the shareability of stories on the Analytics Mobile Application.

Query time in Search to Insight
Search to Insight on Mobile now supports time-related keywords such as “… by Year”, “… by Quarter”, etc. to offer more contextual information based on different time inquiries. This update provides you with more concise search results at your fingertips.

Query Live Data Models in Search to Insight
You can query models based on live data (SAP HANA, SAP BW, SAP S/4 HANA) when working with Search to Insight on iPhones. Now you can enjoy the benefits of our conversational artificial intelligence to visualize and analyze live data on your iPhone.

Single-sign-on experience
You can now use a simplified single-sign-on experience when using the mobile App to connect to your live SAP BW, SAP HANA, or SAP S/4HANA data using SAP Cloud Connector. This gives end-users seamless access to their data without worrying about entering credentials, saving you time and trouble.
This feature can be enabled on existing connections by supplying the right configurations details.

Support for Xcode-11
The SAP Analytics Mobile App and SDK now support Xcode 11. This means that the new App is now built with Xcode 11 and deprecating older iOS versions.
The Mobile SDK requires Xcode 11.3 to be able to build an IPA file and deploy it in internal App Stores.
Home Tab on Android
For all of you Android users, the “Home” page will now be available in SAP Analytics Cloud Mobile. Now when you log into the application, you will be directed to the “Home” page where you can quickly access your favorites, featured files, and most recent files. Accessing and discovering your most important content has never been quicker and easier.

Language Enhancements on Android
The SAP Analytics Cloud Mobile for Android will now support most languages across the application. The menus, buttons, messages, and other elements will now be translated based on your language settings. That’s not all! The Android Mobile App will also support translated, user-defined story metadata based on acquired data connections.
With these language enhancements, Analytics can be consumed by a wider audience within your organization, which is especially useful for international organizations.

Modeling
Shareable Full Control access
If you share a model with Full Control access, other users are now able to export jobs. This update improves team collaboration and makes it easier for the appropriate users to make exports as necessary.

Planning
Export data from SAP Analytics Cloud to S/4HANA Activity Type Plan Cost Rates
We have expanded our capabilities to push plan information from SAP Analytics Cloud to specific components within S/4HANA. With this release, you can now export data from SAP Analytics Cloud to S/4HANA Activity Type Plan Cost Rates (ACCOSTRATE). Configuration for this export is consistent with the current export to S/4HANA capabilities (i.e. ACDOCP).

Return the current Coordinated Universal Time in Advanced Formulas
A new function TODAY is now available within Advanced Formulas which returns the current system date in Coordinated Universal Time (UTC) in the format YYYYMMDD. This function can be modified to return local time based on the configuration setting CONFIG.TIME_ZONE_OFFSET

Set Completion Options to Ignore
When copying data across different models, there is a new completion option, “Ignore”, to help you include only data that is relevant for the specific copy action.
By setting the “Ignore” option, any source members that were not automatically mapped to a target member are excluded from the copy. This can improve overall cross model copy performance and simplifies and streamlines the overall cross model copy mapping experience.

Enhanced Table experience
We’ve improved the table experience with the following updates:
- Smooth scrolling bar appears when your cursor hovers over the table and saves you from clicking
- Improved performance of in-cell charts and thresholds
- Ability to specify exact row height or use the predefined Fiori heights (Default, Condensed, Cozy)
- Ability to specify exact column width for non-responsive tables
- Deselect linked analysis members with “Esc” on keyboard
This should make your experience feel more familiar and intuitive.

Reference another time dimension for time functions NEXT/PREVIOUS
For planning models with multiple time dimensions, you can now reference a secondary time dimension within the Advanced Formula functions Next and Previous.
One of the more typical use-cases for this are scenarios that require amortization of revenue recognition. For example, in the insurance industry, premiums are paid upfront for the duration of the contract. However, these payments cannot be recognized as revenue immediately, but rather need to be spread over the contract duration.
By introducing the ability to reference a secondary time dimension in the Next/Previous functions, it becomes easier to define relative time offsets to the initial payment period to amortize the specific revenues or expenses.

Show Units and Scale in cell
Using the styling panel, story designers can decide where units and scale should be shown in the table. You can format it at the cell level to increase visibility. You can choose to display units and scale in:
- Default
- Row
- Column
- Cell

Open the data locking editor from a Data Locking Task
You can now easily open the Data Locking editor in read-only mode from a Data Locking Task. The context of the task is applied to the editor as driving dimensions so you can see the current lock state for your task.

Platform Services
Defining Prompt Value while scheduling a story
When creating or editing a “Schedule Publication” for stories based on SAP BW and HANA data models, you can now define prompt values. In this way, you can share different views with different prompt values for your story with the same or a new set of recipients, increasing the shareability.

Permissions to discuss and comment
Companies may have very specific rules around which applications should be used to allow the direct user to user collaboration. You can now manage permissions to start a discussion or view and contribute to it through a new application privilege managed in the role definitions.
The same application privilege is also available for managing commenting. Thus, effective team communication can be achieved while data security is ensured!

Multi-Lingual Support
SAP Analytics Cloud now supports the following languages:
- Catalan
- UK English
- Mexican Spanish
- Canadian French
- Swedish
- Welsh
- German Swiss
Smart Assist
Histograms in Search to Insight
Users can use histogram as chart type in Search to Insight by specifying “as histogram”. For example, type “Show me Employee by Salary for 2019 as histogram” in Search to Insight, instantly the results will be visualized with a histogram.

Smart Insights in Explorer and Digital Boardroom
You can now use Smart Insights in Explorer and Digital Boardroom, allowing users to get contextual insights in more scenarios.

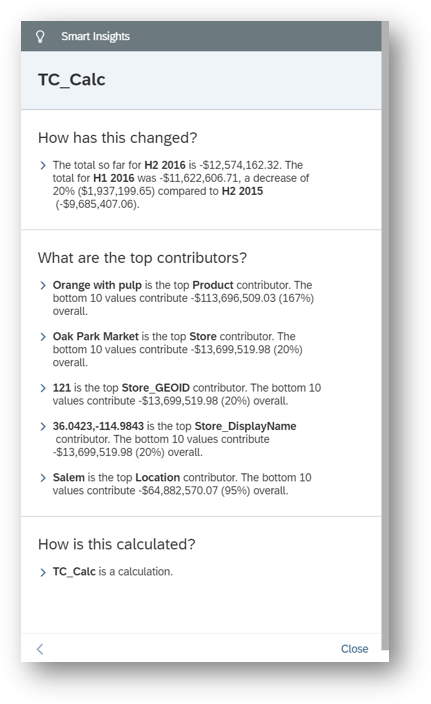
Enriched Smart Insights for calculations
Smart Insights for calculations can now show you their top contributors and how they change over time. It lets you see more information about calculations on a particular data point or variance in your visualization or table, and understand which factors are making the biggest impact on them.
Search using number abbreviations In Search to Insight
You can now search data using number abbreviations allowing you to search in a more natural & intuitive way. For example
- Numeric decimal values, such as “2.4 B”.
- Expressions in English, such as “a million” or “a half million”.
- Words for fractions, such as “half a million”.

- SAP Managed Tags:
- SAP Analytics Cloud,
- Data and Analytics,
- SAP Business Technology Platform
Labels:
You must be a registered user to add a comment. If you've already registered, sign in. Otherwise, register and sign in.
Labels in this area
-
ABAP CDS Views - CDC (Change Data Capture)
2 -
AI
1 -
Analyze Workload Data
1 -
BTP
1 -
Business and IT Integration
2 -
Business application stu
1 -
Business Technology Platform
1 -
Business Trends
1,658 -
Business Trends
91 -
CAP
1 -
cf
1 -
Cloud Foundry
1 -
Confluent
1 -
Customer COE Basics and Fundamentals
1 -
Customer COE Latest and Greatest
3 -
Customer Data Browser app
1 -
Data Analysis Tool
1 -
data migration
1 -
data transfer
1 -
Datasphere
2 -
Event Information
1,400 -
Event Information
66 -
Expert
1 -
Expert Insights
177 -
Expert Insights
293 -
General
1 -
Google cloud
1 -
Google Next'24
1 -
Kafka
1 -
Life at SAP
780 -
Life at SAP
12 -
Migrate your Data App
1 -
MTA
1 -
Network Performance Analysis
1 -
NodeJS
1 -
PDF
1 -
POC
1 -
Product Updates
4,577 -
Product Updates
340 -
Replication Flow
1 -
RisewithSAP
1 -
SAP BTP
1 -
SAP BTP Cloud Foundry
1 -
SAP Cloud ALM
1 -
SAP Cloud Application Programming Model
1 -
SAP Datasphere
2 -
SAP S4HANA Cloud
1 -
SAP S4HANA Migration Cockpit
1 -
Technology Updates
6,873 -
Technology Updates
417 -
Workload Fluctuations
1
Related Content
- FAQ for C4C Certificate Renewal in Technology Blogs by SAP
- Switch on gCTS (for existing packages) in Technology Blogs by SAP
- SAP Enable Now setup in Technology Blogs by Members
- Best practice how to deal with action parameters in RAP service in Technology Q&A
- S/4HANA 2023 FPS00 Upgrade in Technology Blogs by Members
Popular Blog Posts
| Subject | Kudos |
|---|---|
|
|
|
|
|
|
|
|
|
|
|
|
|
|
|
|
|
|
|
Top kudoed authors
| User | Count |
|---|---|
| 34 | |
| 25 | |
| 12 | |
| 7 | |
| 7 | |
| 6 | |
| 6 | |
| 6 | |
| 5 | |
| 4 |