


- SAP Community
- Products and Technology
- Technology
- Technology Blogs by Members
- Broadcast CPI errors to Azure Monitor via SCP Aler...
Technology Blogs by Members
Explore a vibrant mix of technical expertise, industry insights, and tech buzz in member blogs covering SAP products, technology, and events. Get in the mix!
Turn on suggestions
Auto-suggest helps you quickly narrow down your search results by suggesting possible matches as you type.
Showing results for
Martin-Pankraz
Active Contributor
Options
- Subscribe to RSS Feed
- Mark as New
- Mark as Read
- Bookmark
- Subscribe
- Printer Friendly Page
- Report Inappropriate Content
11-11-2020
3:42 PM
Update History: 03 May 21: Enhanced Azure Workbook to work with multiple CPI instances out of the box, introduced region identifier mapping (eu20 -> west eu Azure), groovy scripting enhanced to send region and cpi domain to distinguish multiple cpi instances. 03 Mar 21: Added iFlow for direct connection to Azure Log Analytics without SAP Alert Notification Service in the middle. |
Dear community,
Have you been using the E-Mail Adapter to notice any problems with your iFlows before and flooded your inbox in doing so? I certainly have 😄 let’s do better than that!
Some thoughts on the context and alternatives
Out of the box CPI gives you detailed logs, tracing capabilities and a nice UI to troubleshoot integration errors of all sorts with the cloud-based admin-ui. To avoid checking it regularly you need means to notify your CloudOps team. E-Mail seems straight forward and is used very often. However, E-Mails become very impractical soon. In case of a target system outage during a batch load, you might get emails in the magnitudes of hundreds/thousands within minutes depending on your setup and message frequency. That even threatens your email server to flag them as an email-bomb attack and eventually blocking the sender?.
Great monitoring systems aggregate problems, give you an audit-able history, the capability to slice and dice your issues on a high level and to spin up automation based on your metrics. At the end of this blog, you will have exactly that with tight integration between SAP CPI and Azure Monitor (filter messages from your Azure Monitor Workbook on CPI). See below the overall architecture and example screenshot.

Fig.1 Architecture overview to monitor alerts from SAP CPI in Azure Monitor

Fig.2 Screenshot from Azure Monitor workbook
My presented solution will be using mostly Azure Monitor Workbooks together with SCP Alert Notification Service (ANS) but it is not limited to that. As always there are multiple ways to achieve monitoring/alerting for your iFlows. Especially with public APIs you can connect many systems nowadays. Find below some other alternatives for you to explore:
| Already mentioned plain simple CPI Admin UI with email adapter |
|
| SAP Analytics Cloud CPI Story (as of SAC innovation release 17) |
I borrowed this picture from holger.himmelmann2 from CBS, because it seems not to be available on my SAC trial account. |
| SAP Solution Manager | https://support.sap.com/en/alm/solution-manager/expert-portal/public-cloud-operations/sap-cloud-plat... |
| SAP Cloud Application Lifecycle Management (ALM) | https://support.sap.com/en/alm/sap-cloud-alm/operations/expert-portal/integration-monitoring/calm-cp... |
| SAP Application Interface Framework (AIF) to feedback into your SAP backend |
I borrowed this picture from holger.himmelmann2 from CBS. Find a starting point for AIF in the community here. This is great for end-to-end monitoring for SAP specific protocols for but lacks a little the scope outside of the SAP ecosystem. |
| Custom integration with any REST endpoint via HTTP or SAP OpenConnector Adapter | Use the adapter on your iFlow to call you desired endpoint. You need to handle authorization and specific header setup yourself though. Sometimes you even need multiple http calls to obtain CSRF-Token or Bearer tokens etc. before you can POST your actual payload. The OpenConnector tries to lift that burden for a given set of targets. You can have a look here. |
| SAP Cloud Platform Integration API | Find the relevant API reference on the API Hub here. With that API you can pull the CPI logs and create you own monitoring. This happens on tenant level in contrast to the adapters on iFlow level, which can push information to their target directly.
|
Table1 Overview of possible CPI monitoring solutions
Find the SAP CPI webinar on CPI messaging from where the two borrowed screenshots from holger.himmelmann2 originate here.
Poll vs. Push
For all monitoring integration scenarios with SAP CPI you can either send directly from your iFlow or use the last mentioned API to check on a timely poll-based basis for new message logs. Sending metrics directly (pushing) lifts the burden of checking if you already notified your target of that specific data item. But it also adds complexity to your iFlows. It is best practice to consolidate the actual sending in a separate iFlow and connect it via a ProcessDirect Adapter or use at least an exception sub-process on source-iFlow level.
For the SAP Cloud Platform Alert Notification Service there is even a standard integration package provided by SAP on the API Business Hub making use of the poll-based CPI API.

Fig.3 Screenshot of standard integration package for SCP ANS
This is great because you can immediately start using it. The config guide is straight forward and SAP makes sure the interfaces are maintained with each update of the involved systems. However, there is also a trade-off: You cannot make any changes to that iFlow. Otherwise, you will lose the capability to receive updates from SAP. Usually, I advise to make a copy of that iFlow and make your changes there. The original is not deployed and serves only as indicator for updates (SAP’s changelog tells you also what they changed) and as master copy so you can research the changes to merge manually. I have done local text/object compare in the past. You can try to get more sophisticated with Git repos and DevOps methodologies. Find my latest post on that matter here.

Fig.4 Screenshot of standard iFlow for SCP ANS
The SAP standard iFlow calculates time windows and stores them on the tenant to ensure it “knows” which logs were already sent. This addresses the “poll-burden” I mentioned before. With that timeframe it asks the API for all failed iFlow messages and maps the response to a JSON structure, which is then send to your configured Alert Notification Service instance. See below a snippet from the groovy script that constructs the payload. Have a closer look at the "severity" attribute of the Event object.
Event toNotification(String flowId, def messages, Message message) {


	String flowName = messages[0].IntegrationArtifact.Name.toString()

	String flowType = messages[0].IntegrationArtifact.Type.toString()

	String currentTimeFrameStart = getStringHeader(message, CURRENT_TIME_FRAME_START_HEADER_NAME)

	String currentTimeFrameEnd = getStringHeader(message, CURRENT_TIME_FRAME_END_HEADER_NAME)


	return new Event(

			eventType: "CPIIntegrationFlowExecutionFailure",

			resource: new Resource(

					resourceName: flowName,

					resourceType: flowType

			),

			severity: "INFO",

			category: "NOTIFICATION",

			subject: "CPI Integration Flow '${flowName}': Execution Failure",

			body: "There were '${messages.size()}' failures for the '${flowName}' integration flow within the time frame starting from '${currentTimeFrameStart}' and ending at '${currentTimeFrameEnd}'. ",

			tags: [

					'cpi:IntegrationArtifact.Id': flowId

			]

	)

}
This groovy script and iFlow shipped by SAP focus on filtering by failed messages and aggregating their numbers, which is great if you want to send emails or create Microsoft Teams notifications. But unfortunately, this will limit our ability to get a fully blown monitoring on Azure Monitor. For instance, you won’t be able to create metrics on failed messages vs. completed messages or the likes. To overcome this limitation, I copied the standard iFlow and dropped the OData filter on the status:

Fig.5 Screenshot from OData settings for MPL of standard SAP iFlow for ANS
In addition to that I altered the groovy to create an event for every single message rather than grouping them to count upfront how many occurred during the time frame like the standard implementation does.
flowIdToMessageProcessingLog.each { String key, def value ->

	logMessage.append("Mapping '${value.size()}' failed messages for integration flow with id '${key}' to service notification\n")

	value.each { myMessage ->

	        //skip logging service itself except if it failed

	        def status = myMessage.Status.toString()

            if(key != "Send_notifications_for_failed_Message_Processing_Logs" || (key == "Send_notifications_for_failed_Message_Processing_Logs" && status == "FAILED")){

	            events.add(toNotification(key, myMessage, message))

            }

	}

}
Furthermore, I am modifying the notification severity (INFO or ERROR) on the event depending on the iFlow message status (COMPLETED or anything else).
def myStatus = "INFO";

if(flowStatus != "COMPLETED"){

    myStatus= "ERROR";

}


return new Event(

	eventType: "CPIIntegrationFlowExecutionFailure",

	resource: new Resource(

		resourceName: flowName,

		resourceType: flowType

	),

		//eventTimestamp: logEnd,

		severity: myStatus,

		category: "NOTIFICATION",

		subject: "CPI Integration Flow '${flowName}': Execution Failure",

		body: "Message '${messageID}' for the '${flowName}' integration flow failed within the time frame starting from '${currentTimeFrameStart}' and ending at '${currentTimeFrameEnd}'. ",

		tags: [

		'cpi:IntegrationArtifact.Id': flowId

		]

)
Now, let’s take a closer look at the ANS.
SCP Alert Notification Service (ANS)
An actual alert on ANS is setup using three modelling objects. A condition to act upon if met, the actual action to take and a subscription to combine the condition with a set of actions. You can model all this manually or do an import from my GitHub repos.
SAP’s blogs on ANS setup for E-Mail or Microsoft Teams might be interesting too.
Be aware that the blogs refer to the NEO environment. You need to change the endpoint for ANS on the iFlow configuration to “/cf/producer/v1/resource-events”. You can find the reference here.
For the standard integration package on CPI you need to configure only one condition. The same is true for my modified version. You can skip this, when you import from my provided JSON.

Fig.5 Screenshot from SCP ANS config
On the actions piece you can choose from the pre-configured options provided by SAP:
- E-Mail or E-Mail with custom SMTP server
- Microsoft Teams
- SCP Automation Pilot
- ServiceNow Case / Incident
- Slack / Slack threaded
- Alert Notification Service Store
- VictorOps or
- Plain vanilla webhooks with authentication flows like OAuth/Basic Auth etc.
For Azure Monitor I chose a simple webhook, because I used the shared access signature instead of any credentials. If you consider that not secure enough you can also go for OAuth and register the app with Azure AD.
Be aware that you currently need to access the Alert Notifications Service in trial from the same target URL as the subaccount and your CPI region. I had problems at first because my subaccount was in US but my web-ui defaults to EU due to my location. I just altered my URL manually from cockpit.eu10.hana.ondemand.com/<target> to cockpit.us10.hana.ondemand.com/<target> while accessing the web-ui.
The moving parts to make it happen

Fig.6 Architecture overview to monitor alerts from SAP CPI in Azure Monitor
Azure Log Analytics has a REST API that can be used directly. You can find the reference here. Since the webhook action configuration capabilities on the ANS are limited, I put a LogicApp in between, which exposes the needed webhook.
The LogicApp has a built-in connector to call LogAnalytics workspaces in an integrated low-code manner. You just need to specify your Log Analytics workspace, the log name (in my case CPIFailure) and optional additional attributes like the Time-generated-field. Once you save it, it generates your http web hook. You will need that to configure the ANS action. I left a placeholder (YOURPATH) for you to replace on the JSON template for ANS.

Fig.7 Screenshot from LogicApp in Azure
I can simply forward the payload from ANS, because Log Analytics expects key-value pairs. It will parse it automatically without any transformation needed.
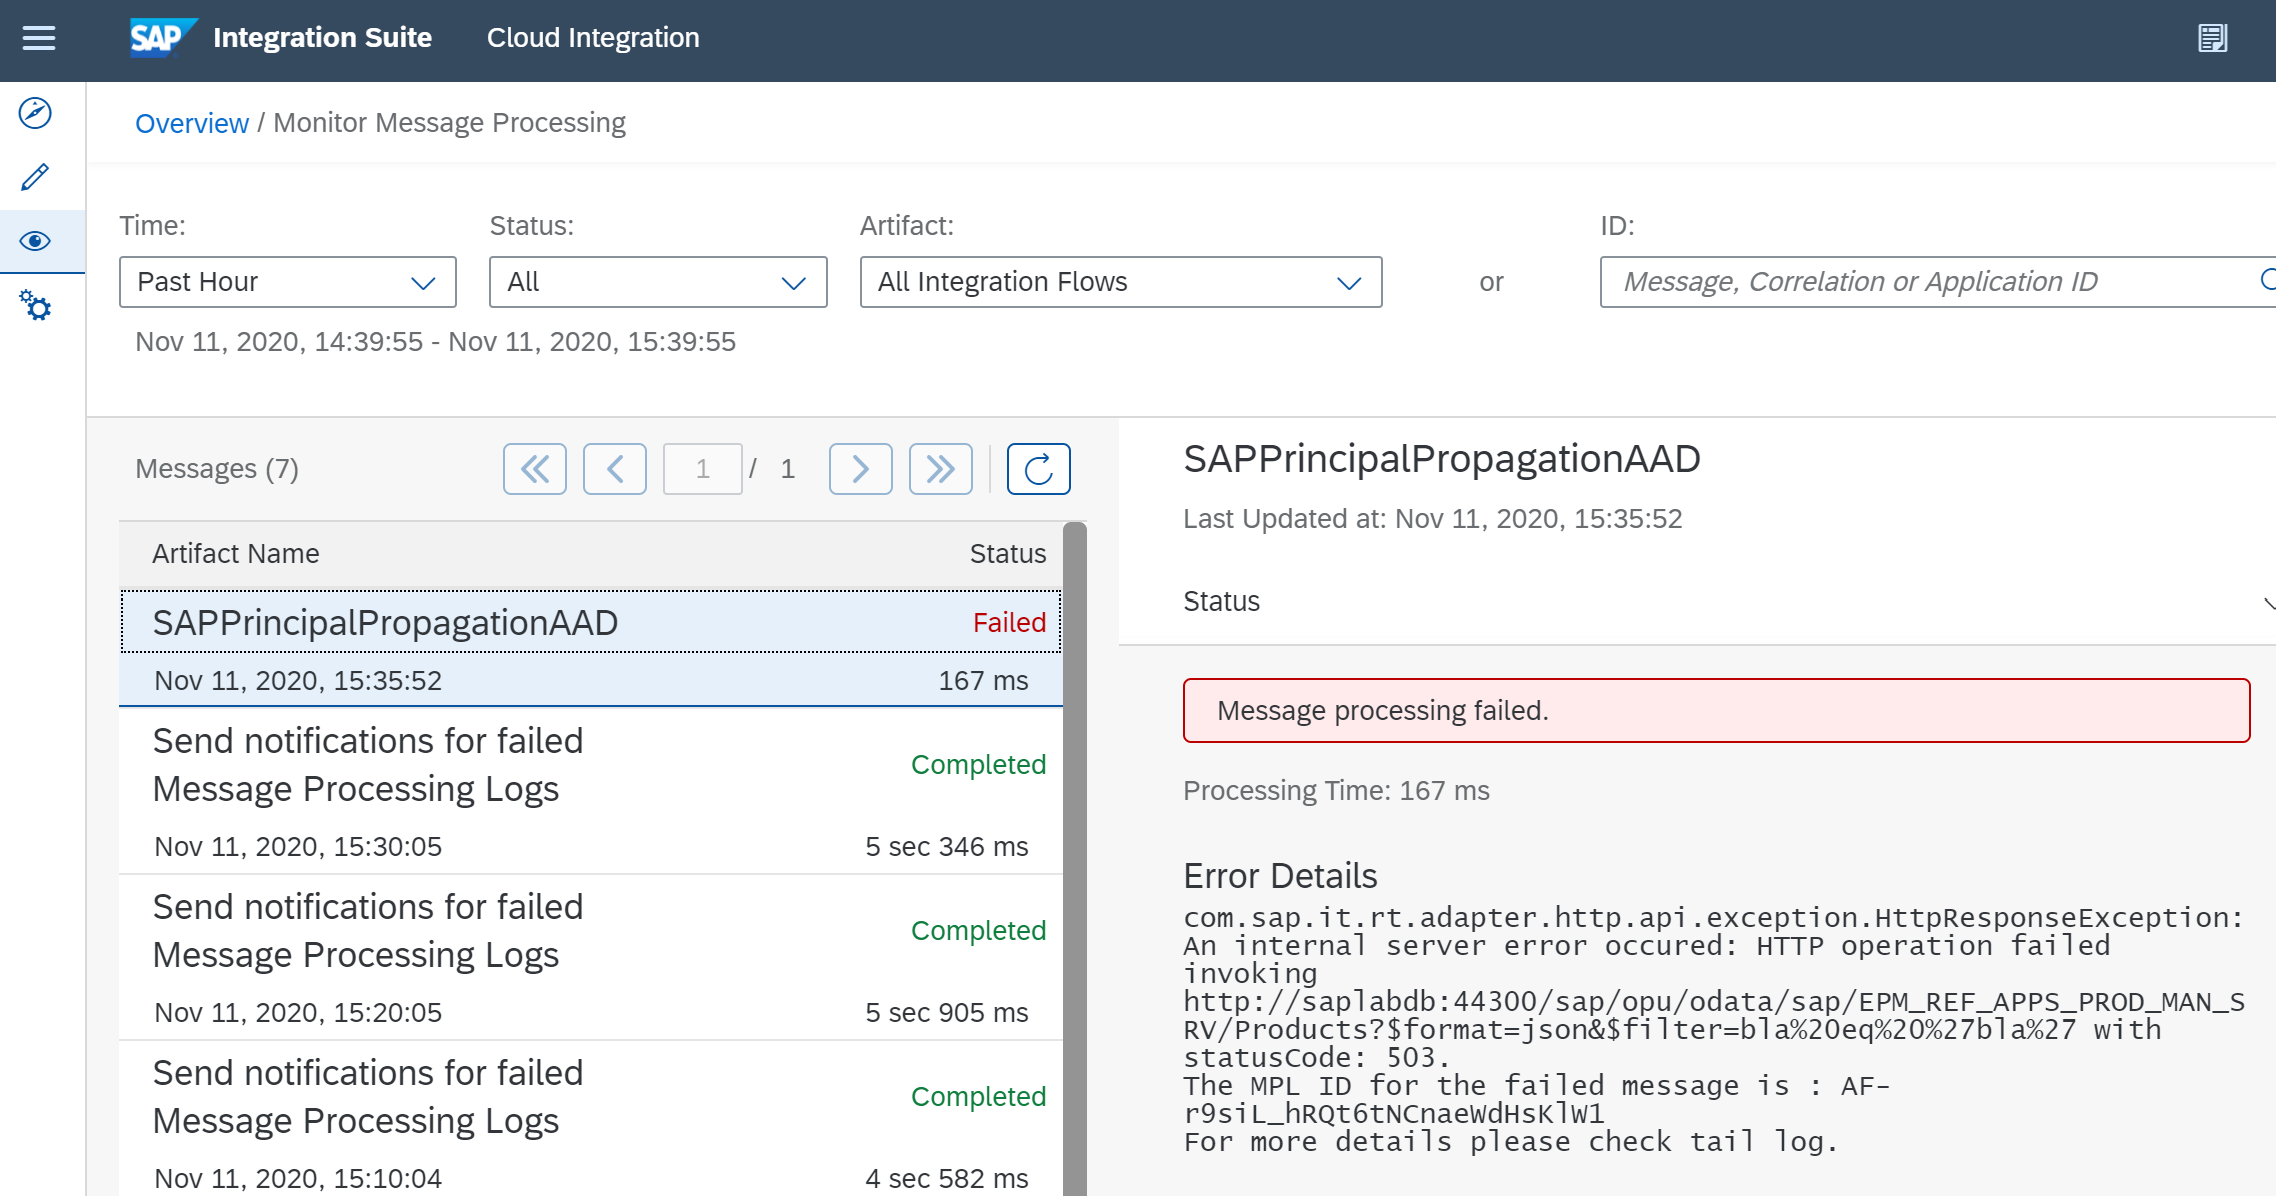
After firing an iFlow, that I setup to fail you get the following output.

Fig.8 Screenshot from Log Analytics custom log for CPI notifications
Remember the poll is being done by another iFlow on a timely basis. Mine is set to 5 minutes. Once you run a query the custom log will show the first data entries and parsed key-value pairs.

Fig.9 Screenshot from expanded notification on Log Analytics Workspace
Now we can unleash the power of the Kusto Query Language (KQL) upon those data sets and orchestrate that in an Azure Monitor workbook. I have prepared a template for you to plug & play here. Go to Azure Monitor on the portal and navigate to workbooks from the navigation pane. There are other examples for you to get inspired from on that screen if you like.
Simply upload the json by clicking edit on a new workbook (Empty), click the advanced editor button (</>), copy my json into the view and finish by clicking apply.

Fig.10 Screenshot from Workbook import
Next, click edit on the workbook to adjust to your own CPI environment.
- Change the generic Admin UI link

- You need to fill the parameters for the subsequent visuals:

The workspace parameter is used as input for the integrated Alert wizard to pre-fill your resources (click the percentages under "Failure Rate").
The base URL for CPI is used for the inline links on the iFlows to jump to the CPI Admin UI with the iFlow pre-filtered. This way I implemented tight integration between the workbook and CPI Admin UI.

Fig.11 Short overview of workbook for CPI monitoring
Ok, now we are talking! Gradual colour coding for suspiciously often failing iFlows, notification trends evolving over time and configurable charts to look at the data from different angles.
The table rows act as interactive filters for the Message Log.
Like I said before: the iFlow Id is also a hyperlink to targets SAP CPI Monitor with that id pre-filtered and the status pre-set to “FAILED”.

What about notifying the CloudOps team? Azure Portal allows you to create alerts based on many metrics. In our case a certain number of failed iFlow messages per iFlow would make sense. To get there you can click the percentage number on the column “Failure Rate” or do it plain vanilla from the Azure Portal view for Alerts.

Fig.12 Create Alert Rule from failure rate on workbook chart
I configured an hourly check on the last hour of monitored iFlow messages.
CPIFailure_CL | where TimeGenerated > ago(1h) and severity_s == "ERROR" | summarize count()On the action group you can do similar things compared to what SCP ANS offers for its targets. There is native integration for Azure Automation Runbooks, Functions, LogicApps and ITSM (ServiceNow etc.). The difference here is the ability to slice and dice the data the way you need it.

Fig.13 Screenshot from Action Group creation
You guessed correctly. I configured my E-Mail as alert action again 😄 but this time it is only contacting me based on a customizable threshold of failed messages from a portal where I monitor all my Cloud resources including on-premise or even AWS workloads. Have a look at Azure ARC if you want to dig deeper.
Alternatively calling Azure Log Analytics directly
Above architecture has it merits when you want to manage your SCP notifications for all services in one place and be able to react differently based on the event attributes. In case your focus is on Azure services you might prefer doing it directly from your iFlows. Here is how you do it:

Fig. 14 Architecture overview with direct send to Azure Log Analytics
To make that work we adapt again the SAP standard iFlow "Send notifications for failed Message Processing Logs". The Azure Log Analytics REST API requires us to authenticate using an http header containing specific properties encoded with the HMAC-SHA256 algorithm. We got past that with the ANS approach, because the LogicApp masks the complexity of the authentication.
You can find more details on the Log Analytics REST API here. Luckily CPI already ships all the required libraries with their groovy runtime to create the call from our iFlow. Here is an excerpt of my groovy scripting for the authentication piece:
static String createAuthorization(String workspaceId, String key, int contentLength, String rfc1123Date) {

    try {

        // Documentation: https://docs.microsoft.com/en-us/rest/api/loganalytics/create-request

        String signature = String.format("POST\n%d\napplication/json\nx-ms-date:%s\n/api/logs", contentLength, rfc1123Date);

        Mac mac = Mac.getInstance("HmacSHA256");

        mac.init(new SecretKeySpec(DatatypeConverter.parseBase64Binary(key), "HmacSHA256"));

        String hmac = DatatypeConverter.printBase64Binary(mac.doFinal(signature.getBytes(Charset.forName("UTF-8"))));

        return String.format("SharedKey %s:%s", workspaceId, hmac);

    } catch (NoSuchAlgorithmException | InvalidKeyException e) {

        throw new RuntimeException(e);

    }

}
The complete iFlow is part of the CPI package shared on my GitHub repos. So, it is up to you decide if you want to use ANS in between or call Azure directly.
By the way the mechnism to construct the authentication header (or often called Shared-Access-Signature) is adaptable to other Azure service REST APIs like for the Azure Service Bus for instance.
Thoughts on production readiness
- More sophisticated dashboarding on the Azure Monitor Workbook: I think its purpose is not to replace the Admin UI of CPI. You will still go there for actual tracing, replicating issues and chasing down logs. The proposed approach serves more to give your CloudOps team configurable reports, access to Azure Data tooling and to consolidate your Cloud monitoring in a single place, where you probably monitor all your other Azure workloads too. With Azure ARC even cross-hyperscalers (AWS, GCP, etc.). That is a topic for another day though.
- Authentication: It would be worth to elevate the ANS configuration of the service key from BasicAuth to OAuth. The access signature of the LogicApp is secure as long only admins have access to the ANS setup. If not, I mentioned already that you could swap to a webhook with OAuth and register ANS as an application with Azure AD. The same is true for the direct call to Azure Log Analytics. In order to use Azure AD you would need to register your CPI tenant with AAD. However, that is material for another post on high-security authentication from BTP to Azure services 🙂
- Sending only aggregated error messages to Azure Monitor: Reduces the cost but limits the analysis capabilities tremendously because you cannot create metrics for completed vs. failed messages and even the aggregated number of messages is “hidden” on plain text on the notification body.
 Parsing it from there would be possible on the LogicApp for instance. But even then, you have only one event registered although you might have 10 mentioned on the body. Therefore, I proposed a modified version of the standard iFlow.
 - Enhancing the standard iFlow for ANS: The standard integration content sends always alerts with severity info. It might be worth to extend that and flag certain source iFlows differently. You might consider a synchronization flow failure (e.g. employee synch from SuccessFactors to S4) more critical than a GET request for some master data from C4C. For such scenarios you could come up with a logic that changes the severity level, based on the source iFlow. The mapping could be maintained in a CPI Value Mapping artifact. This way it would be configurable outside of the groovy code. Another approach could be based on the error code. Maybe http 404 is different to 500? For my implementation I evaluate only the message status for now (Completed vs. Error,Retry etc.).
- Direct Azure LogAnalytics call vs. ANS: The proposed solution uses the SCP Alert Notification Service to showcase the interoperability and possibility to build upon your existing SCP strategy. Of course, technology-wise you could bypass it altogether and directly send the event to Azure Log Analytics via its API. ANS has it merits when you want to manage your SCP notifications for all services in one place and be able to react differently based on the event attributes. One use case could be: sending all messages to Azure Log Analytics but add the ServiceNow action for very critical errors. For that it would be possible to add another condition to the ANS configuration and modify the code on the iFlow to fill the eventType based on your custom logic to identify critical issues.

Given that many CPI customers, that I saw, use the E-Mail adapter for productive scenarios, I would consider my prototype in its simplest form without any changes to the SAP CPI integration content production ready even today. What do you think?
Final Words
I showed you today how to enhance your CPI monitoring and alerting with Azure Monitor. To do that we reused the existing standard integration content for SAP Cloud Platform Alert Notification Services (ANS), adapted it slightly to send all messages (not only failed) and dropped the aggregation, configured it for CloudFoundry endpoints, configured ANS to send notifications via a webhook to Azure, create visualisations on the log data with Azure Monitor workbooks and finally created an alert rule to notify us based on failure thresholds. Not too bad, right?
Find the adapted iFlow on my GitHub repos and the workbook on the official Azure Monitor Community.
Find the setup guide for SCP Alert Notification Service here.
As always feel free to leave or ask lots of follow-up questions.
Best Regards
Martin
You must be a registered user to add a comment. If you've already registered, sign in. Otherwise, register and sign in.
Labels in this area
-
"automatische backups"
1 -
"regelmäßige sicherung"
1 -
505 Technology Updates 53
1 -
ABAP
14 -
ABAP API
1 -
ABAP CDS Views
2 -
ABAP CDS Views - BW Extraction
1 -
ABAP CDS Views - CDC (Change Data Capture)
1 -
ABAP class
2 -
ABAP Cloud
2 -
ABAP Development
5 -
ABAP in Eclipse
1 -
ABAP Platform Trial
1 -
ABAP Programming
2 -
abap technical
1 -
absl
1 -
access data from SAP Datasphere directly from Snowflake
1 -
Access data from SAP datasphere to Qliksense
1 -
Accrual
1 -
action
1 -
adapter modules
1 -
Addon
1 -
Adobe Document Services
1 -
ADS
1 -
ADS Config
1 -
ADS with ABAP
1 -
ADS with Java
1 -
ADT
2 -
Advance Shipping and Receiving
1 -
Advanced Event Mesh
3 -
AEM
1 -
AI
7 -
AI Launchpad
1 -
AI Projects
1 -
AIML
9 -
Alert in Sap analytical cloud
1 -
Amazon S3
1 -
Analytical Dataset
1 -
Analytical Model
1 -
Analytics
1 -
Analyze Workload Data
1 -
annotations
1 -
API
1 -
API and Integration
3 -
API Call
2 -
Application Architecture
1 -
Application Development
5 -
Application Development for SAP HANA Cloud
3 -
Applications and Business Processes (AP)
1 -
Artificial Intelligence
1 -
Artificial Intelligence (AI)
4 -
Artificial Intelligence (AI) 1 Business Trends 363 Business Trends 8 Digital Transformation with Cloud ERP (DT) 1 Event Information 462 Event Information 15 Expert Insights 114 Expert Insights 76 Life at SAP 418 Life at SAP 1 Product Updates 4
1 -
Artificial Intelligence (AI) blockchain Data & Analytics
1 -
Artificial Intelligence (AI) blockchain Data & Analytics Intelligent Enterprise
1 -
Artificial Intelligence (AI) blockchain Data & Analytics Intelligent Enterprise Oil Gas IoT Exploration Production
1 -
Artificial Intelligence (AI) blockchain Data & Analytics Intelligent Enterprise sustainability responsibility esg social compliance cybersecurity risk
1 -
ASE
1 -
ASR
2 -
ASUG
1 -
Attachments
1 -
Authorisations
1 -
Automating Processes
1 -
Automation
1 -
aws
2 -
Azure
1 -
Azure AI Studio
1 -
B2B Integration
1 -
Backorder Processing
1 -
Backup
1 -
Backup and Recovery
1 -
Backup schedule
1 -
BADI_MATERIAL_CHECK error message
1 -
Bank
1 -
BAS
1 -
basis
2 -
Basis Monitoring & Tcodes with Key notes
2 -
Batch Management
1 -
BDC
1 -
Best Practice
1 -
bitcoin
1 -
Blockchain
3 -
BOP in aATP
1 -
BOP Segments
1 -
BOP Strategies
1 -
BOP Variant
1 -
BPC
1 -
BPC LIVE
1 -
BTP
11 -
BTP Destination
2 -
Business AI
1 -
Business and IT Integration
1 -
Business application stu
1 -
Business Architecture
1 -
Business Communication Services
1 -
Business Continuity
1 -
Business Data Fabric
3 -
Business Partner
12 -
Business Partner Master Data
10 -
Business Technology Platform
2 -
Business Trends
1 -
CA
1 -
calculation view
1 -
CAP
3 -
Capgemini
1 -
CAPM
1 -
Catalyst for Efficiency: Revolutionizing SAP Integration Suite with Artificial Intelligence (AI) and
1 -
CCMS
2 -
CDQ
12 -
CDS
2 -
Cental Finance
1 -
Certificates
1 -
CFL
1 -
Change Management
1 -
chatbot
1 -
chatgpt
3 -
CL_SALV_TABLE
2 -
Class Runner
1 -
Classrunner
1 -
Cloud ALM Monitoring
1 -
Cloud ALM Operations
1 -
cloud connector
1 -
Cloud Extensibility
1 -
Cloud Foundry
3 -
Cloud Integration
6 -
Cloud Platform Integration
2 -
cloudalm
1 -
communication
1 -
Compensation Information Management
1 -
Compensation Management
1 -
Compliance
1 -
Compound Employee API
1 -
Configuration
1 -
Connectors
1 -
Consolidation Extension for SAP Analytics Cloud
1 -
Controller-Service-Repository pattern
1 -
Conversion
1 -
Cosine similarity
1 -
cryptocurrency
1 -
CSI
1 -
ctms
1 -
Custom chatbot
3 -
Custom Destination Service
1 -
custom fields
1 -
Customer Experience
1 -
Customer Journey
1 -
Customizing
1 -
Cyber Security
2 -
Data
1 -
Data & Analytics
1 -
Data Aging
1 -
Data Analytics
2 -
Data and Analytics (DA)
1 -
Data Archiving
1 -
Data Back-up
1 -
Data Governance
5 -
Data Integration
2 -
Data Quality
12 -
Data Quality Management
12 -
Data Synchronization
1 -
data transfer
1 -
Data Unleashed
1 -
Data Value
8 -
database tables
1 -
Datasphere
2 -
datenbanksicherung
1 -
dba cockpit
1 -
dbacockpit
1 -
Debugging
2 -
Delimiting Pay Components
1 -
Delta Integrations
1 -
Destination
3 -
Destination Service
1 -
Developer extensibility
1 -
Developing with SAP Integration Suite
1 -
Devops
1 -
digital transformation
1 -
Documentation
1 -
Dot Product
1 -
DQM
1 -
dump database
1 -
dump transaction
1 -
e-Invoice
1 -
E4H Conversion
1 -
Eclipse ADT ABAP Development Tools
2 -
edoc
1 -
edocument
1 -
ELA
1 -
Embedded Consolidation
1 -
Embedding
1 -
Embeddings
1 -
Employee Central
1 -
Employee Central Payroll
1 -
Employee Central Time Off
1 -
Employee Information
1 -
Employee Rehires
1 -
Enable Now
1 -
Enable now manager
1 -
endpoint
1 -
Enhancement Request
1 -
Enterprise Architecture
1 -
ETL Business Analytics with SAP Signavio
1 -
Euclidean distance
1 -
Event Dates
1 -
Event Driven Architecture
1 -
Event Mesh
2 -
Event Reason
1 -
EventBasedIntegration
1 -
EWM
1 -
EWM Outbound configuration
1 -
EWM-TM-Integration
1 -
Existing Event Changes
1 -
Expand
1 -
Expert
2 -
Expert Insights
1 -
Fiori
14 -
Fiori Elements
2 -
Fiori SAPUI5
12 -
Flask
1 -
Full Stack
8 -
Funds Management
1 -
General
1 -
Generative AI
1 -
Getting Started
1 -
GitHub
8 -
Grants Management
1 -
groovy
1 -
GTP
1 -
HANA
5 -
HANA Cloud
2 -
Hana Cloud Database Integration
2 -
HANA DB
1 -
HANA XS Advanced
1 -
Historical Events
1 -
home labs
1 -
HowTo
1 -
HR Data Management
1 -
html5
8 -
Identity cards validation
1 -
idm
1 -
Implementation
1 -
input parameter
1 -
instant payments
1 -
Integration
3 -
Integration Advisor
1 -
Integration Architecture
1 -
Integration Center
1 -
Integration Suite
1 -
intelligent enterprise
1 -
Java
1 -
job
1 -
Job Information Changes
1 -
Job-Related Events
1 -
Job_Event_Information
1 -
joule
4 -
Journal Entries
1 -
Just Ask
1 -
Kerberos for ABAP
8 -
Kerberos for JAVA
8 -
Launch Wizard
1 -
Learning Content
2 -
Life at SAP
1 -
lightning
1 -
Linear Regression SAP HANA Cloud
1 -
local tax regulations
1 -
LP
1 -
Machine Learning
2 -
Marketing
1 -
Master Data
3 -
Master Data Management
14 -
Maxdb
2 -
MDG
1 -
MDGM
1 -
MDM
1 -
Message box.
1 -
Messages on RF Device
1 -
Microservices Architecture
1 -
Microsoft Universal Print
1 -
Middleware Solutions
1 -
Migration
5 -
ML Model Development
1 -
Modeling in SAP HANA Cloud
8 -
Monitoring
3 -
MTA
1 -
Multi-Record Scenarios
1 -
Multiple Event Triggers
1 -
Neo
1 -
New Event Creation
1 -
New Feature
1 -
Newcomer
1 -
NodeJS
2 -
ODATA
2 -
OData APIs
1 -
odatav2
1 -
ODATAV4
1 -
ODBC
1 -
ODBC Connection
1 -
Onpremise
1 -
open source
2 -
OpenAI API
1 -
Oracle
1 -
PaPM
1 -
PaPM Dynamic Data Copy through Writer function
1 -
PaPM Remote Call
1 -
PAS-C01
1 -
Pay Component Management
1 -
PGP
1 -
Pickle
1 -
PLANNING ARCHITECTURE
1 -
Popup in Sap analytical cloud
1 -
PostgrSQL
1 -
POSTMAN
1 -
Process Automation
2 -
Product Updates
4 -
PSM
1 -
Public Cloud
1 -
Python
4 -
Qlik
1 -
Qualtrics
1 -
RAP
3 -
RAP BO
2 -
Record Deletion
1 -
Recovery
1 -
recurring payments
1 -
redeply
1 -
Release
1 -
Remote Consumption Model
1 -
Replication Flows
1 -
Research
1 -
Resilience
1 -
REST
1 -
REST API
1 -
Retagging Required
1 -
Risk
1 -
Rolling Kernel Switch
1 -
route
1 -
rules
1 -
S4 HANA
1 -
S4 HANA Cloud
1 -
S4 HANA On-Premise
1 -
S4HANA
3 -
S4HANA_OP_2023
2 -
SAC
10 -
SAC PLANNING
9 -
SAP
4 -
SAP ABAP
1 -
SAP Advanced Event Mesh
1 -
SAP AI Core
8 -
SAP AI Launchpad
8 -
SAP Analytic Cloud Compass
1 -
Sap Analytical Cloud
1 -
SAP Analytics Cloud
4 -
SAP Analytics Cloud for Consolidation
2 -
SAP Analytics Cloud Story
1 -
SAP analytics clouds
1 -
SAP BAS
1 -
SAP Basis
6 -
SAP BODS
1 -
SAP BODS certification.
1 -
SAP BTP
20 -
SAP BTP Build Work Zone
2 -
SAP BTP Cloud Foundry
5 -
SAP BTP Costing
1 -
SAP BTP CTMS
1 -
SAP BTP Innovation
1 -
SAP BTP Migration Tool
1 -
SAP BTP SDK IOS
1 -
SAP Build
11 -
SAP Build App
1 -
SAP Build apps
1 -
SAP Build CodeJam
1 -
SAP Build Process Automation
3 -
SAP Build work zone
10 -
SAP Business Objects Platform
1 -
SAP Business Technology
2 -
SAP Business Technology Platform (XP)
1 -
sap bw
1 -
SAP CAP
2 -
SAP CDC
1 -
SAP CDP
1 -
SAP Certification
1 -
SAP Cloud ALM
4 -
SAP Cloud Application Programming Model
1 -
SAP Cloud Integration for Data Services
1 -
SAP cloud platform
8 -
SAP Companion
1 -
SAP CPI
3 -
SAP CPI (Cloud Platform Integration)
2 -
SAP CPI Discover tab
1 -
sap credential store
1 -
SAP Customer Data Cloud
1 -
SAP Customer Data Platform
1 -
SAP Data Intelligence
1 -
SAP Data Migration in Retail Industry
1 -
SAP Data Services
1 -
SAP DATABASE
1 -
SAP Dataspher to Non SAP BI tools
1 -
SAP Datasphere
9 -
SAP DRC
1 -
SAP EWM
1 -
SAP Fiori
2 -
SAP Fiori App Embedding
1 -
Sap Fiori Extension Project Using BAS
1 -
SAP GRC
1 -
SAP HANA
1 -
SAP HCM (Human Capital Management)
1 -
SAP HR Solutions
1 -
SAP IDM
1 -
SAP Integration Suite
9 -
SAP Integrations
4 -
SAP iRPA
2 -
SAP Learning Class
1 -
SAP Learning Hub
1 -
SAP Odata
2 -
SAP on Azure
1 -
SAP PartnerEdge
1 -
sap partners
1 -
SAP Password Reset
1 -
SAP PO Migration
1 -
SAP Prepackaged Content
1 -
SAP Process Automation
2 -
SAP Process Integration
2 -
SAP Process Orchestration
1 -
SAP S4HANA
2 -
SAP S4HANA Cloud
1 -
SAP S4HANA Cloud for Finance
1 -
SAP S4HANA Cloud private edition
1 -
SAP Sandbox
1 -
SAP STMS
1 -
SAP SuccessFactors
2 -
SAP SuccessFactors HXM Core
1 -
SAP Time
1 -
SAP TM
2 -
SAP Trading Partner Management
1 -
SAP UI5
1 -
SAP Upgrade
1 -
SAP-GUI
8 -
SAP_COM_0276
1 -
SAPBTP
1 -
SAPCPI
1 -
SAPEWM
1 -
sapmentors
1 -
saponaws
2 -
SAPUI5
4 -
schedule
1 -
Secure Login Client Setup
8 -
security
9 -
Selenium Testing
1 -
SEN
1 -
SEN Manager
1 -
service
1 -
SET_CELL_TYPE
1 -
SET_CELL_TYPE_COLUMN
1 -
SFTP scenario
2 -
Simplex
1 -
Single Sign On
8 -
Singlesource
1 -
SKLearn
1 -
soap
1 -
Software Development
1 -
SOLMAN
1 -
solman 7.2
2 -
Solution Manager
3 -
sp_dumpdb
1 -
sp_dumptrans
1 -
SQL
1 -
sql script
1 -
SSL
8 -
SSO
8 -
Substring function
1 -
SuccessFactors
1 -
SuccessFactors Time Tracking
1 -
Sybase
1 -
system copy method
1 -
System owner
1 -
Table splitting
1 -
Tax Integration
1 -
Technical article
1 -
Technical articles
1 -
Technology Updates
1 -
Technology Updates
1 -
Technology_Updates
1 -
Threats
1 -
Time Collectors
1 -
Time Off
2 -
Tips and tricks
2 -
Tools
1 -
Trainings & Certifications
1 -
Transport in SAP BODS
1 -
Transport Management
1 -
TypeScript
2 -
unbind
1 -
Unified Customer Profile
1 -
UPB
1 -
Use of Parameters for Data Copy in PaPM
1 -
User Unlock
1 -
VA02
1 -
Validations
1 -
Vector Database
1 -
Vector Engine
1 -
Visual Studio Code
1 -
VSCode
1 -
Web SDK
1 -
work zone
1 -
workload
1 -
xsa
1 -
XSA Refresh
1
- « Previous
- Next »
Related Content
- SAP Document and Reporting Compliance - 'Colombia' - Contingency Process in Technology Blogs by SAP
- Notification event for total number of messages in SAP Cloud ALM integration & exception monitoring in Technology Q&A
- Job and Automation Monitoring features - SAP Cloud ALM in Technology Blogs by Members
- Notifications for broadcasting of Reports in Technology Q&A
- SAP Cloud Integration: Streamlining Update Alerts for SAP Prepackaged Content/Adapter in Technology Blogs by Members
Top kudoed authors
| User | Count |
|---|---|
| 11 | |
| 9 | |
| 7 | |
| 6 | |
| 4 | |
| 4 | |
| 3 | |
| 3 | |
| 3 | |
| 3 |