
Technology Blogs by SAP
Learn how to extend and personalize SAP applications. Follow the SAP technology blog for insights into SAP BTP, ABAP, SAP Analytics Cloud, SAP HANA, and more.
Turn on suggestions
Auto-suggest helps you quickly narrow down your search results by suggesting possible matches as you type.
Showing results for
former_member75
Participant
Options
- Subscribe to RSS Feed
- Mark as New
- Mark as Read
- Bookmark
- Subscribe
- Printer Friendly Page
- Report Inappropriate Content
11-04-2020
7:43 PM
This blog covers the new features and enhancements in the SAP Analytics Cloud and SAP Digital Boardroom Q1 2020 Release.
Please note that the SAP Analytics Cloud Help documentation is updated at the same time as the upgrade to this release, so the links here may not yet reflect what is described below until after the upgrade is complete.
Make sure to upgrade your SAP Analytics Cloud agent to the latest agent version 1.0.257 to take advantage of all the data acquisition types!
Requirements
These are the data acquisition minimum requirements:
- Version 1.0.99 for SAP ERP / SQL databases
- Version 1.0.91 for SAP Universe (UNX)
- Version 1.0.233 for SAP Business Warehouse (BW)
- Version 1.0.75 for all other data source types
For more information, see the SAP Analytics Cloud System Requirements and Technical Prerequisites.
SAP Analytics Cloud fully supports Microsoft Edge and Google Chrome for all activities and areas of SAP Analytics Cloud including viewing, authoring and administration.
Highlighted Feature Updates
The features listed in the highlights section are the top feature enhancements in Q1 2020
- Data Visualizations:
- Background gradients or image for Responsive Pages and Lanes
- Threshold legend in charts
- Custom Web Fonts
- Right Click Context Menu
- Planning:
- Cut and Paste Shortcuts
- Option to Switch to Input Mode in BPC Embedded
- Show Hyperlink in Tables
- Allocation Steps in Data Actions
- Copy Data Actions
- Smart Assist:
- Additional Time Phrases in Search to Insight
- Better Support for Time-Based Questions in Search to Insight
Additional Feature Updates
- Analytics Designer:
- Data Source API Enhancements
- Data Locking APIs
- Change Themes when Running Applications
- API Improvements
- Performance Enhancements
- Loading Indicator
- Data Analyzer Enhancements
- Trigger Refreshing for Widgets
- Type Library Optimization
- Data Integration:
- Option to Allow Import Data to Public Dimension for Non-Leaf Node in Hierarchy
- Live Connections to CF HANA 2.0 without Setting up HDI
- Query Panel Resizing Improvements for Live SAP Universe
- View Mapping and Import Job Transformations
- Data Visualization:
- Live BW Support for Exception Aggregation
- Restrict Measures on Dynamic Time using a Custom Current Date
- Story Level Font Resize in Device Preview
- Mobile:
- BW BeX Variable Prompt Support for Fiscal Year and Currency
- iOS 13 Support
- Application Logs
- Support for HANA Variables
- Planning:
- Export Quantities to S4/HANA
- Rename Account and Measures in the Builder Panel
- Activate Processes Automatically on Start Date
- Auto Complete Process on Due Date
- Smart Assist:
- Smart Insights Enhancements
- Search to Insight Support for Acquired Models with Data Access
- Exclude Acquired Models from Search to Insight
- Smart Insights on Data Over Time
- Smart Insights on Account Dimensions
Highlighted Feature Updates
Administration & Infrastructure
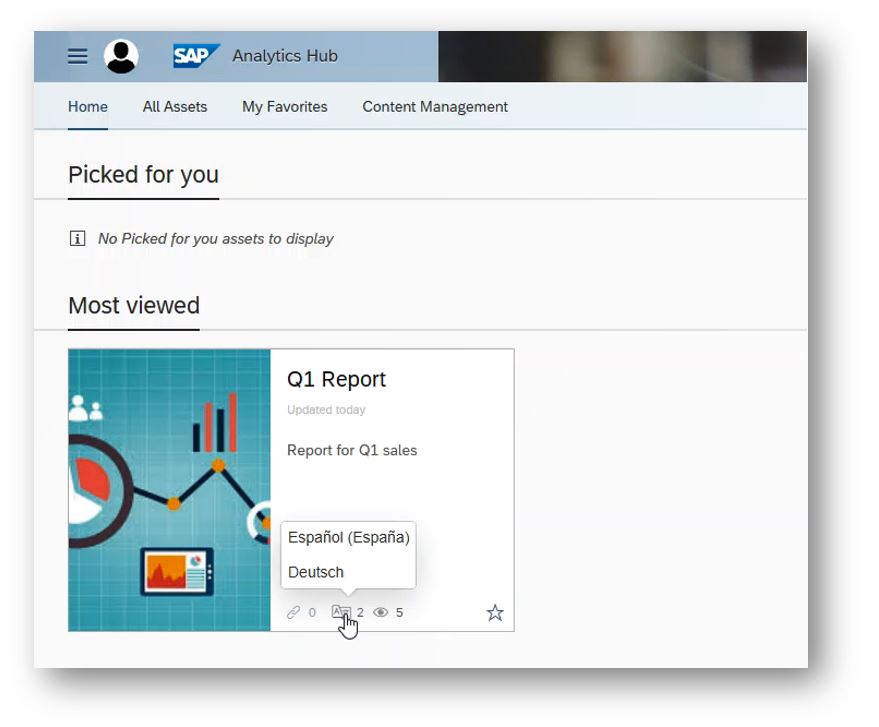
Translate Analytics Hub Content
You can now translate SAP Analytics Hub asset content and structure using the SAP Analytics Cloud translation service. Users can update their language preferences and view translated content in their preferred language.
Support for over 30 languages allows for Analytics to be consumed by a wider audience within your organization, which is perfect for international organizations!
Buy and Import Content
When browsing paid content from Content Libraries on the Content Network, you can now follow a link to the SAP App Center to buy the content, and then import it directly into SAP Analytics Cloud.
This seamless integration makes it much easier and faster to bring in your favorite external content.

Analytics Designer
New text-area widget
You can now add a new text-area widget to your Analytic Application. It is similar to the input field widget, but different in that it can wrap text automatically based on the size of the widget and the line break entered by the application users.
This is especially useful when you get long text from comments and descriptions.

Scripting for Search to Insight
As an application designer, you can now use scripting API to build your own Search to Insight UI by integrating Search to Insight with another application, such as a Chatbot or your own company portal.
This new scripting API allows users to pass a question through the application and apply the resulting chart or table in an Analytic Application, making it faster and easier for the end user to get custom analytics.

Concurrent Session Notifications
This usability improvement will help ensure that users don’t overwrite each other’s work when working on the same Application. When a second user opens the same Application, system notifications will indicate to them that someone else is already editing, and the original editor will receive a notification that someone else opened the file.
Once an edit is made by one of the users, the other user will receive a notification to either save a copy of their Application or jump to the most recent revision to continue working.

Data Integration
Qualtrics Import Connection
Could you think of a time when knowing how a customer or partner felt would have helped your business? Most of us would agree that understanding how people feel about an experience would be incredibly beneficial and offer insights that simply cannot be gained through financial metrics.
With this new release of SAP Analytics Cloud, we’re bringing in the experiential data (X data) powers of Qualtrics by allowing you to import survey questions and answers, adding new insights to augment your operational data (O data).
Users will be able to define what data to import via the familiar query building experience, making the X+O connection experience seamless and intuitive, so you can focus on understanding how to offer your customers the most benefit.

Data Visualization
Background gradients or image for Responsive Pages and Lanes
Story designers can now select gradient colors and images to use as a background for responsive pages and lanes. Background images and color gradient are also available in story preferences for ease of story design.

Threshold legend in charts
Story designers can now choose to display a threshold legend when a threshold is applied on a chart. Just like other chart legends, the threshold legend can also be hidden via the “More Actions” menu.

Custom Web Fonts
Administrators now have the ability to bring in Custom Web Fonts to their tenant from within the Administration Panel.
Story Designers can then use these Custom Web Fonts anywhere fonts are configurable in the Story, in the exact same way you would use a pre-installed font. This will allow for better brand consistency for companies with custom typefaces and offers more flexibility in formatting.

Right Click Context Menu
This update brings a big increase in usability and discoverability of possible widget actions by providing a right click context menu. Widget menu items will now be accessible by right clicking anywhere on the widget, or through the floating “More Actions” icon at top right of the widget.
The wrap title action will be moved inside the context menu to reduce clutter on the main widget screen and core data point actions such as filter, exclude, and drill will remain available via left click. These updates should make interacting with widgets much more intuitive and consistent.

Digital Boardroom
Set prompts for All Pages
Boardroom presenters can now change prompts for all pages rather than page by page. This dramatically reduces the number of clicks needed to change prompts and allows for a more consistent view of the data.
Prompts can still be set for individual pages if desired, allowing you to choose between efficiency or customization!

General Updates
SAP Analytics Cloud for Office
SAP Analytics Cloud’s add-in for Microsoft Office extends our analytic and planning capabilities with the well-known Excel frontend and functions to allow planners to work on their preferred device while still getting all the benefits SAP Analytics Cloud provides.
This add-in works both on premise, with a product installation, as well as on desktop and in the cloud where no installation is required since the add-on can be found in the Microsoft store. And, of course, please keep in mind that some functionality may be missing as this feature is still in beta.

Mobile
Search to Insight on Mobile
Search to Insight is here! You can now query your acquired models using Search to Insight in the mobile app to get quick answers to questions and share these findings with other users.
As you type your query, auto-complete suggestions will display, bringing augmented analytics right to your fingertips no matter where you are in the world!

Planning
Cut and paste shortcuts
With this update you’ll be able to cut and paste cell values with keyboard shortcuts such as Ctrl+C and Ctrl+V, or Cmd+X and Cmd+V. This brings the functionality that was available for custom cells, to data cells, creating a consistent user experience.

Option to Switch to Input Mode in BPC Embedded
When planning against BPC embedded, planners now have the option to toggle between input mode to edit data in a table, or view mode to only view data in the table. In view mode, there is no BW backend lock, and other planners can change data.
This improves collaboration and makes it easier for appropriate users to make edits as necessary.

Show Hyperlink in Tables
Table hyperlinks are now visible through a quick “Go to Link” Hyperlink button available in the context menu of each cell.
The hyperlinks will be displayed with the URL and additional context for quick comprehension and access to the destination.

Allocation Steps in Data Actions
Rather than manually executing allocations from within you story, you can now add structured allocations as part of a data action to provide a more automated experience for your end user.
You can also combine an allocation step with other step types in one data action, and then easily execute them with one click using the data action trigger. Quick and easy!

Copy Data Actions
In this release, you’ll gain the ability to copy a data action with all its steps and parameters, saving you time in those cases when you want to duplicate an existing data action. Just be aware that you can only copy one data action at a time, in order to not lose any previous copies.

Smart Assist
Additional Time Phrases in Search to Insight
Search to Insight will offer more contextual information based on different time inquiries. The following time phrases are now supported:
- Q1, Q2, Q3, Q4
- H1, H2
- Previous, Current, This, Next
- First, Second, …, Last
- Half of the Year
This will provide the end user with a more pleasant experience and better search results!

Better Support for Time-Based Questions in Search to Insight
Natural language is more useful than ever! Users can now ask for a measure over time in a much simpler way as well as specify the granularity through familiar terms, for example:
- Show me Gross Margin…
- over time
- by year
- by fiscal quarter
- broken into months
- broken down by week
- by date
- Show me monthly Gross Margin
Search to Insight will also automatically select a time dimension if the user does not specify one explicitly. This will help your end user get quick information in a very intuitive manner without needing any specific knowledge about the data!

Smart Predict
Time-Series Forecasting Predictive Model Improvements
The time-series forecasting predictive model has received several major improvements with this release. In an effort to improve navigation and interactivity, the predictive reports are now available as tabs to quickly switch between.
Furthermore, the structure of the debriefs has been enhanced by removing one of the reports and grouping the information in a more concise and relevant way. The default report has also changed, showing the forecasts as the initial report.
Lastly, the explainable AI has been improved by exposing the influencers and their contributions in the debrief, as well as providing a description for each component of the signal to help with interpretation.

Additional Feature Updates
Administration & Infrastructure
Browse menu improvements
It’s a-me, Mario, here to save you (time) from the Browse-r! How, you ask? Well, with this update, the Content Network, Translation, and Analytic Application Bookmarks can now be accessed from the Browse menu instead of the Files area, saving you a few clicks, and making the whole process a little more (Princess) Peach-y!

SSO IdP improvements
You can now configure IdP-initiated SSO for SAP Data Centers, allowing for tighter integration to portals and other applications that share an IdP, as well as linking from a portal page to SAP Analytics Cloud without prompting the user for credentials!
In addition to that, administrators will have the option to configure the SLO behavior of SAP Analytics Cloud to keep users logged into the corporate IdP when they logout of SAP Analytics Cloud. SSO, essentially, that means logging in and out won’t be as SLO!

Update and manage IDP metadata
System owners can now fully update and manage SAML SSO metadata before the current metadata expires, avoiding support tickets and downtime. Enough said.

Danish Support
No, this doesn’t mean SAP Analytics Cloud will visualize your data in the form of a pastry. It does mean, however, that you can now choose Danish as your user interface language. Velkommen to all our Danish users!

Analytics Designer
Data Source API Enhancements
With this update you’ll now be able to use the data source prompt API, DataSource.setVariableValue(), to facilitate more customization in Analytics Designer. Please note that this API will not be supported for hierarchy node variables for live data connections to SAP BW.

Data locking APIs
You’ll also be able to use data-locking APIs to check whether a model is data-locking enabled as well as to set or get data locks, even if the table is not planning enabled. This is great for quickly changing data in tables, where a designer can create a button to lock certain data as fixed.

Change themes when running applications
Application designers will now have access to the setTheme() API, which would allow users to easily change the theme when running the application. This means that you can use SAP Analytics Cloud to set the mood on your next date, just add and open a candlelight theme in your Analytical Application and watch the sparks fly as you explore it together…

API Improvements
Multiple improvements have been made with a synopsis listed below for each improvement:
- The wave version of the API reference is displayed in the browser tab and in the first link of the “Contents” section.
- The link “API Reference Latest Published Version” in the “Contents” section navigates to the latest publicly available version of the API reference.
- Class, field, method, and event API additions are listed in their documentation with the wave version of their addition under the heading “Since” and their update under “Last Update”.
- Direct subclasses of a class are listed in the class documentation under the heading “Direct Subclasses”.
- Each class in the “Contents” section has decorator icons indicating special capabilities of the class:
- Icon with the letter “D” indicates whether the class contains fields or methods that can be directly accessed in the script editor without creating an instance of the class.
- Icon with the letter “T” indicates whether the class can be used as a type in method arguments, return values, or global script variables.
- The API reference shows the type library information of each class and all classes are grouped into type libraries.
Performance Enhancements
This update will allow you to improve performance by merging queries from SAP BW or SAP HANA for multiple charts in the Analytics Designer. To enable this feature, visit the Query Settings pop-up panel and turn on the “Enable Query Merge” toggle.

Loading Indicator
Application Designers can now define a loading indicator to prevent Application users from performing new actions while an operation is still in progress. This will improve the user experience as they will receive a visual cue that a process is occurring.
There are two types of loading indicators:
- Automatically triggered when loading is longer than a predefined delay time. This is configured in the Styling panel of the canvas.
- Defined for the application as a pop up, a tab strip, or a panel, by leveraging corresponding APIs.

Data Analyzer Enhancements
As a user of the data analyzer, you will find several improvements for this ready-to-run service to improve your workflow efficiency:
- The “Available Items” area is now displayed by default.
- You can use the Refresh button in the query information dialog to refresh your data source.
- In the query information dialog, prompts that have been set for the data source are now displayed.
- You can now quickly and easily collapse the filter line.

Trigger Refreshing for Widgets
By leveraging the refresh data APIs, Application Designers can allow Application users to trigger a data refresh for a specific widget (such as a table or chart) or all widgets related to an Application data source.
This ensures that relevant and up-to-date information is always available for your end user to make decisions.

Type Library Optimization
More isn’t always better, especially when it comes to searching through help sections. In an effort to save Analytic Designers from having to sift through multiple irrelevant topics, new Analytic Applications will only suggest types that are available in the standard library, within the script editor value help.
Whenever a widget or technical object is loaded into the application, the associated type library will be added as well. For Analytic Applications that were created prior to this update, there will be an “Optimize type Libraries” button under the “Settings” menu which will remove any unused libraries from the script editor value help.

Data Integration
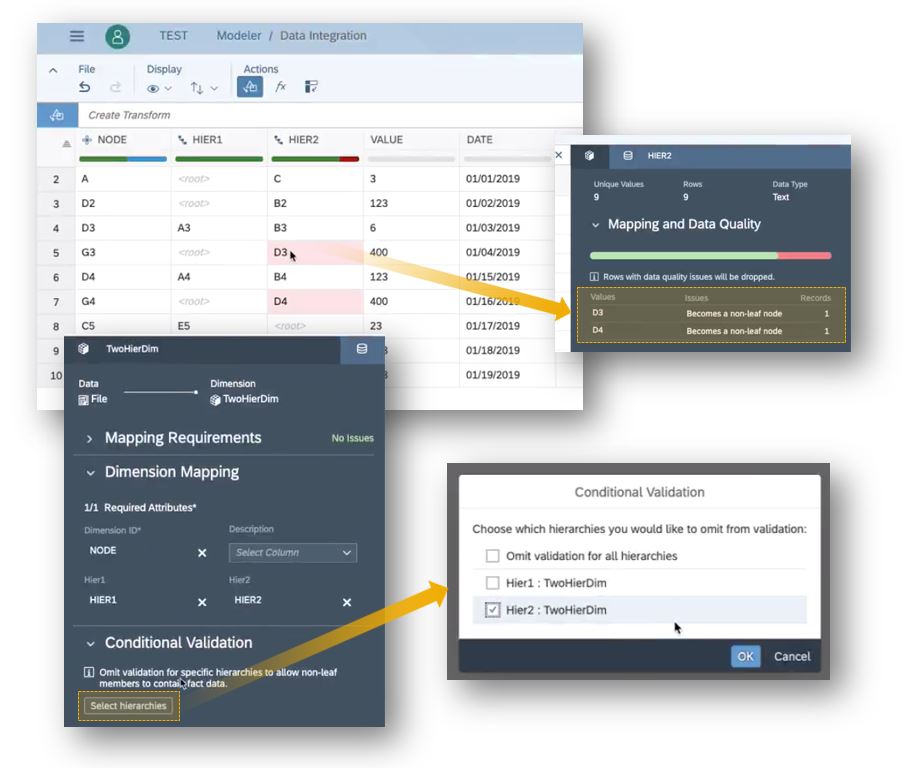
Option to allow import data to public dimension for non-leaf node in hierarchy
When importing data into Global dimensions, users can now omit validation, allowing non-leaf members to contain fact data for specific hierarchies. To find out more, please visit our help section.
Live Connections to CF HANA 2.0 without setting up HDI
Connection setup to Cloud Foundry HANA 2.0 has been simplified by removing the need to force the connection through an HDI container. The overall architecture of the live connection has not changed, the only difference is to replace the HDI container reference to a user provided service.

Query Panel Resizing Improvements for Live SAP Universe
When creating a model on a Universe with SAP Live Data Connect, you can now use the full-screen icon in the Query Panel header to maximize the view. This will make it easier to deal with large quantities of selected data, especially when working on smaller computer screens.

View Mapping and Import Job Transformations
Users can now view data mapping and transform history after they import data into a model or dimension. This history can be used to help map or transform data for other import jobs, saving you time and potential confusion!

Data Visualization
Live BW Support for Exception Aggregations
Story designers now have the ability to create aggregations in the story calculation editor using Live-BW models. There is one exception: the First & Last aggregation can only contain one aggregation dimension while the other aggregations will have a limit of five.

Restrict Measures on Dynamic Time Using a Custom Current Date
This feature provides the ability to create restricted measures and cross calculations with dynamic time range filters based on a “custom current date”. This allows viewers to control the “current period” used for the dynamic time range based on their current date configuration.
Essentially, you will no longer need to update the date filter range whenever you want to change the time-period, just update the custom current date and the rest will change accordingly!

Story Level Font Resize in Device Preview
Story Designers can now change the font scaling of the entire story for each individual device size using a single scale. Widgets can still be individually scaled but this will save you a lot of time from having to configure each widget one-by-one.

Digital Boardroom
Combine Action Bar with Header or Footer
Digital Boardroom designers can now easily integrate the Action Bar into the header or footer of the Boardroom for quick access. This greatly improves discoverability and leaves more space for viewing the boardroom story itself.
These options can be configured in the boardroom preferences.

Intelligent Enterprise
Live BW Support for Time Variances
Time based variances on Live-BW models can now be created within the story, and they will also support Recommended Comparisons, giving you expertly curated ways to view your data.

Mobile
BW Bex variable prompt support for fiscal year and currency
The SAP Analytics Cloud mobile app now supports BW Bex variable prompts for Fiscal Year and Currency Variables. So next time someone stops you on the street and tells you to “Show me the money!”, just pull up your phone and use that shiny new input control.

iOS 13 Support
If triskaidekaphobia is the fear of the number 13, would that make the fear of iOS 13 triOSskaidekaphobia? Nevertheless, the SAP Analytics Cloud mobile app now runs on iOS 13 for iPhones, so hopefully you don’t suffer from either of the aforementioned phobias…

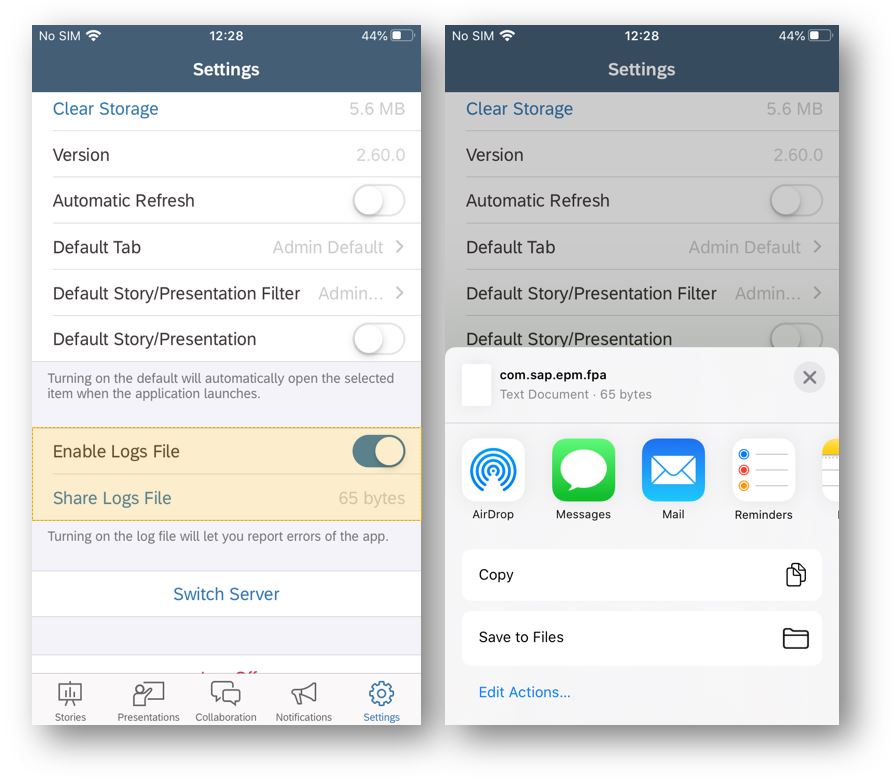
Application Logs
The SAP Analytics Cloud App will now generate local application logs to help analyze issues when contacting the SAP Support team. This will help accelerate resolution of any issues you may face.
Support for HANA Variables
HANA Input parameters and variables will now be supported within the SAP Analytics Cloud Mobile app.

Modeling
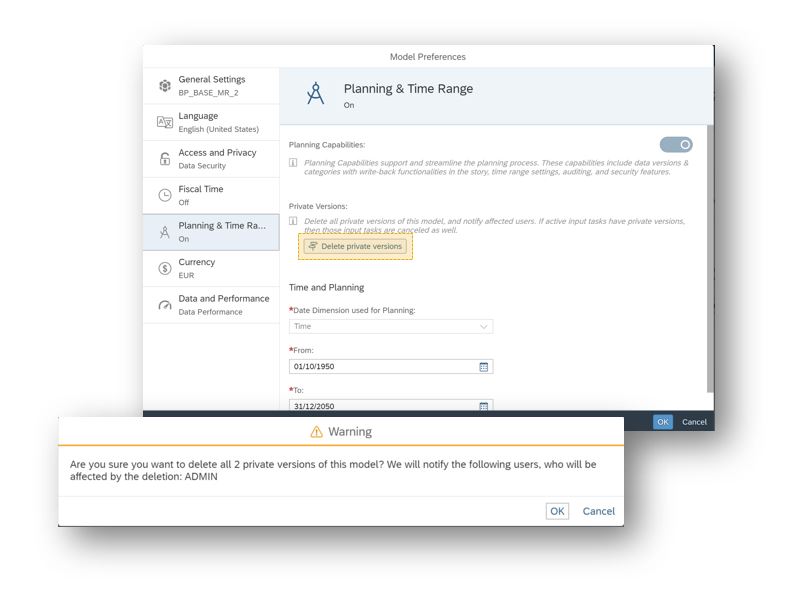
Delete private versions
As an administrator, you can now delete all private versions for a specific model for all users of that model. This would make for a great April Fool’s joke, except for the fact that it actually deletes everything, and it isn’t a joke….
Planning
Export quantities to S4/HANA
When you export data to S/4HANA using OData Services and your target key figure is a quantity, you will now be able to map it to a unit dimension and export the quantities of the different units. This will ensure accurate mapping and improve the quality of data exports to S/4HANA.

Rename Account and Measures in the Builder Panel
The table now provides options to rename Account and Measure dimensions directly from the Builder panel. The changes will not be saved to the model itself but are useful for customizing individual stories based on individual preferences.

Activate Processes Automatically on Start Date
As you can already do with tasks, you can now enable Processes activate automatically on the start date you’ve chosen. This reduces the manual inputs required for Processes, leaving you more time to spend on the actual tasks!

Auto Complete Process on the Due Date
Planners can now choose to have a process complete automatically on the due date and define the completion settings. In addition, Planners are able to apply the same completion settings to subtasks and Processes, or they can complete them with custom settings. Another case of SAP Analytics Cloud saving you time through automation!

Smart Assist
Smart Insights Enhancements
To help you make better business decisions, Smart Insights now brings top contributors to all generic dimensions, even those with a large number of dimension members. To further improve the value of insights, “unassigned” values will no longer be shown as a top contributor, and for variances, Smart Insights now supports up to 50 dimension members.

Search to Insight Support for Acquired Models with Data Access
Acquired Models with Data Access Control (DAC) will now be used in Search to Insight when indexing is enabled from the Model Preferences. By default, models with DAC are not indexed, and because indexing does not respect the DAC settings, users without access to a member will still be able to see it in autocomplete.

Exclude Acquired Models from Search to Insight
Acquired Models can be excluded from Search to Insight by disabling indexing, giving users more control over which models get exposed.

Smart Insights on Data Over Time
Smart Insights now show you how your data points have changed over time, including when they have time dimension filters applied to them. This comes with a convenient tab view of the different time granularities which you can quickly toggle between. These features not only provide more context for better insights, but they also make for a more intuitive interface!

Smart Insights on Account Dimensions
You can now get Smart Insights on data points representing account dimensions that have Income (INC) and Expense (EXP) as financial account types. This feature is especially useful for Planners, offering more valuable insights when looking at financial data.

Smart Predict
Smart Predict Cloud native and converged architecture
We've made improvements to how Smart Predict connects to your data. This ensures that your user experience creating predictive models is now more aligned when using either live or acquired datasets.
This alignment, however, means that you'll have to make sure that all predictive models created before release 2019.23 on acquired datasets, are retrained to view their debriefs, and also before they can be applied to new datasets.
Multi-Column Segmentation for Data Sets
When creating time series forecasting predictive models, segmentation will now have the ability to use values from multiple columns. This makes it easy to create forecasts for segments that combine values from several columns, such as region and product.

Platform Services
Data Point Comments on Analytical Models
Liked our Data Point Comments on Planning Models? Well, now you can make Data Point Comments to the data cells of a table on Analytical Models. This will help you add context-based comments on a particular data point in a table, making it even easier to collaborate with your colleagues.

- SAP Managed Tags:
- SAP Analytics Cloud,
- Data and Analytics,
- SAP Business Technology Platform
Labels:
You must be a registered user to add a comment. If you've already registered, sign in. Otherwise, register and sign in.
Labels in this area
-
ABAP CDS Views - CDC (Change Data Capture)
2 -
AI
1 -
Analyze Workload Data
1 -
BTP
1 -
Business and IT Integration
2 -
Business application stu
1 -
Business Technology Platform
1 -
Business Trends
1,658 -
Business Trends
91 -
CAP
1 -
cf
1 -
Cloud Foundry
1 -
Confluent
1 -
Customer COE Basics and Fundamentals
1 -
Customer COE Latest and Greatest
3 -
Customer Data Browser app
1 -
Data Analysis Tool
1 -
data migration
1 -
data transfer
1 -
Datasphere
2 -
Event Information
1,400 -
Event Information
66 -
Expert
1 -
Expert Insights
177 -
Expert Insights
296 -
General
1 -
Google cloud
1 -
Google Next'24
1 -
Kafka
1 -
Life at SAP
780 -
Life at SAP
13 -
Migrate your Data App
1 -
MTA
1 -
Network Performance Analysis
1 -
NodeJS
1 -
PDF
1 -
POC
1 -
Product Updates
4,577 -
Product Updates
342 -
Replication Flow
1 -
RisewithSAP
1 -
SAP BTP
1 -
SAP BTP Cloud Foundry
1 -
SAP Cloud ALM
1 -
SAP Cloud Application Programming Model
1 -
SAP Datasphere
2 -
SAP S4HANA Cloud
1 -
SAP S4HANA Migration Cockpit
1 -
Technology Updates
6,873 -
Technology Updates
420 -
Workload Fluctuations
1
Related Content
- FAQ for C4C Certificate Renewal in Technology Blogs by SAP
- Switch on gCTS (for existing packages) in Technology Blogs by SAP
- SAP Enable Now setup in Technology Blogs by Members
- Best practice how to deal with action parameters in RAP service in Technology Q&A
- S/4HANA 2023 FPS00 Upgrade in Technology Blogs by Members
Top kudoed authors
| User | Count |
|---|---|
| 36 | |
| 25 | |
| 17 | |
| 13 | |
| 8 | |
| 7 | |
| 7 | |
| 6 | |
| 6 | |
| 6 |