

- SAP Community
- Products and Technology
- Technology
- Technology Blogs by SAP
- Low-code data analysis application with SAP HANA p...
Technology Blogs by SAP
Learn how to extend and personalize SAP applications. Follow the SAP technology blog for insights into SAP BTP, ABAP, SAP Analytics Cloud, SAP HANA, and more.
Turn on suggestions
Auto-suggest helps you quickly narrow down your search results by suggesting possible matches as you type.
Showing results for
former_member67
Active Participant
Options
- Subscribe to RSS Feed
- Mark as New
- Mark as Read
- Bookmark
- Subscribe
- Printer Friendly Page
- Report Inappropriate Content
10-16-2020
8:15 AM
Introduction
Learn how to create an interactive data analysis application on SAP HANA with just a few extra lines of code. Maybe you are happily scripting with Python in Jupyter Notebooks, but your colleagues don’t want to script and prefer a more conventional user interface. In this blog post we show how you can turn your Python code with little effort into an interactive Web app, thanks to the Python package streamlit.
This tutorial starts with a first introduction to streamlit that anyone can easily follow hands-on. It then continues with a basic low-code example on SAP HANA, for which you need access to a SAP HANA system.
We have also extended this concept in a separate blog post around a more advanced example, which uses streamlit and SAP HANA to cluster data and to help the user decide how many clusters to request.
Table of contents
- Prerequisites
- Installation and Configuration
- Create your first streamlit application
- Test streamlit with SAP HANA
Please test any code or information we provide. We have tested our examples but there is no guarantee / warranty on any of this content. This blog post was written by andreas.forster (Global Center of Excellence, SAP) and dmitrybuslov (Presales, SAP).

Prerequisites
We are assuming you are already familiar working with SAP HANA and the hana_ml library, which is officially called the “Python Client API for machine learning algorithms”. In case you haven’t worked with this library yet, this tutorial can be a starting point.
Technically, you need to have:
- SAP HANA, with the Predictive Algorithm Library (PAL) installed and configured. This can be a “conventional” on-premise SAP HANA or SAP HANA Cloud with the script server enabled.
- A user that is entitled to trigger the PAL
Please check with your Account Executive if your licenses cover this use case.
Installation and Configuration
On your laptop you need to install these components:
- A Python distribution. We are using the free “Anaconda Individual Edition”. This environment will execute the Python code.
- An Integrated Development Environment (IDE) in which to write the Python code. This blog post uses the free “Visual Studio Community” release, but you can also use other IDEs.
Then configure your Anaconda environment.
- Open the “Anaconda Prompt”

- Create a new environment in Anaconda with this command:
conda create -n streamlit python=3.6 - Activate this environment, which means the following commands, will be executed in this environment:
conda activate streamlit
- Install the Python library streamlit in this environment:
pip install streamlit - Test streamlit, which should open an example in your default browser:
streamlit hello
- Play with this webapp, which is running on your local streamlit environment.
- Stop the streamlit application with Control + C in the Anaconda prompt.
- Still in the Anaconda Prompt, Install the hana_ml library, which facilitates the connection to SAP HANA
pip install hana_ml
Create your first streamlit application
Now test running your first own interactive streamlit application. For fun, we will tackle the birthday paradox. If there are n number of people in the room, what is the probability that two of them have their birthday on the same day of the year?
Open the IDE, for instance Visual Studio.
Select “Create a new project” and select the template “Python Application”.
Project name: BirthdayParadox
Keep the other default values and click “Create”.
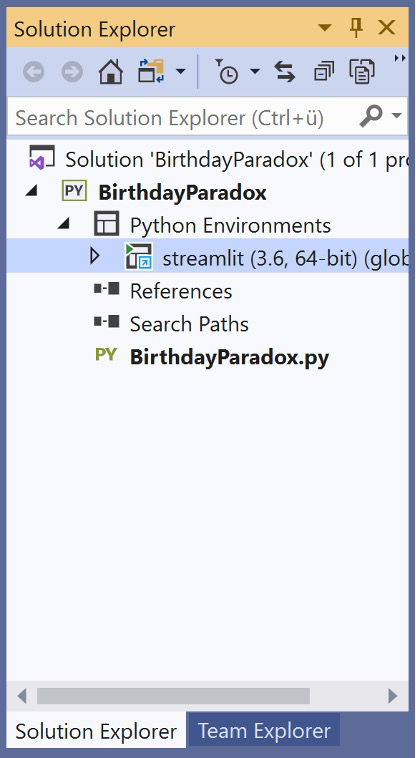
An empty project opens. Notice how in Visual Studio on the right hand-side the Solution Explorer states that our newly created streamlit environment is used as Python environment. This is important, as this environment has the streamlit and hana_ml libraries installed. In case the streamlit environment is not shown here, you might already have created other environments in Anaconda on your system. In that case, just manually set this to streamlit.
Enter this code into the empty BirthdayParadox.py
from math import factorial

print('Birthday paradox')

n = 20

prob_match = 1 - factorial(n) * (factorial(365) / (factorial(n) * factorial(365-n)) )/ pow(365, n)

print('The probability of a birthday match for ' + str(n) + ' people is ' + str(round(prob_match * 100, 1)) + '%')
Run this code with the green “Start” button on top.

And a command prompt shows the result. If there are 20 people in the room, the probability is a surprisingly high 41%, that two of them have their birthday on the same day of the year.

Press a key, to close this prompt.
Now let’s calculate the probability for two people on this blog’s post image on top to have their birthday on the same day. It’s quite hard to spot everyone, but 14 people are visible. Instead of hardcoding n = 14, we create an interactive application instead.
Only a few simple changes are required, to turn the code into an interactive application. Most important are:
- The streamlit library must be imported
- Instead of hardcoding the number of people, streamlit can create an interactive slider
- Any output is also using the streamlit library, to display the information in the browser
Change the code to:
import streamlit as st

from math import factorial

st.title('Birthday paradox')

n = st.slider(label = 'How many people: ', min_value = 2, max_value = 100, value = 20)

prob_match = 1 - factorial(n) * (factorial(365) / (factorial(n) * factorial(365-n)) )/ pow(365, n)

st.write('The probability of a birthday match for ' + str(n) + ' people is ' + str(round(prob_match * 100, 1)) + '%')
This code is now executed differently. Hitting the “Start” button will not help now. Instead, go to the Anaconda Prompt and execute the BirthdayParadox.py file with streamlit:
streamlit run "C:\path\to\the\file\Birthdayparadox\BirthdayParadox.py"
Your default browser should open with the interactive application on http://localhost:8501
Move the slider to 14, and the application immediately calculates the probability of 22.3%, that any of the 14 people on the photograph have their birthday on the same day of the year.

Streamlit can pick up any further changes you make to the code on the fly. Try this out by changing the title in Visual Studio. You can add the word “probability” to the title for example.
st.title('Birthday paradox probability')Save the file in Visual Studio. And the application shows on the top right-hand side that the “Source file changed”.

Click on “Always rerun”, which will update the application. It will also now pick up any further changes when the file is saved.
You could have the two applications side by side on two screens. Code and save on one screen. And the application on the other screen updates itself right away.
If you want to learn more about streamlit, we suggest these links:
- Main website of streamlit
- streamlit presentation at PyData in December 2019
Test streamlit with SAP HANA
Let’s move on to an example, in which streamlit pushes down some calculation logic to SAP HANA. We will use the Predictive Analysis Library (PAL) in SAP HANA to trigger a clustering algorithm and to display how many elements were assigned to each cluster.
Remember that this is just an introductory example. A more advanced application can be found in a separate blog post, which uses streamlit and SAP HANA to cluster data and, most importantly, helps the user decide how many clusters to request.
Now working with SAP HANA, you have to upload some data first.
We will use a retail dataset to cluster customers. Download Mall_Customers.csv from Kaggle. Upload this file with the following Python commands to SAP HANA. We executed this code in JupyterLabs. In case you have not worked with hana_ml yet, please become familiar with this tutorial first: Hands-On Tutorial: Machine Learning push-down to SAP HANA with Python
Make sure to fill in your SAP HANA credentials. In this example the logon parameters are hardcoded to keep things simple. In reality you would probably store these details securely, for instance in the SAP HANA Secure User Store.
# Instantiate connection object

import hana_ml.dataframe as dataframe

conn = dataframe.ConnectionContext(address = ',

                                   port = 0,

                                   user = '',

                                   password = '',

                                   encrypt = 'true',

 sslValidateCertificate = 'false'

                                   )


# Load CSV into pandas DataFrame

import pandas as pd

df_data = pd.read_csv('Mall_Customers.csv')


# Adjust the column names

df_data.columns = ['CUSTOMER_ID', 'GENRE', 'AGE', 'ANNUAL_INCOME', 'SPENDING_SCORE']


# Load data to SAP HANA

df_remote = dataframe.create_dataframe_from_pandas(connection_context = conn,

                                                   pandas_df = df_data,

                                                   table_name = 'MALL_CUSTOMERS',

                                                   force = True,

                                                   replace = False)
The data is now in SAP HANA. Continue with creating the steamlit application. In Visual Studio, create a new project
- Template: Python Application
- Project name: pal_cluster_count
Copy the following code into the pal_cluster_count.py file.
import streamlit as st

import pandas as pd

import numpy as np


st.title('K-means clustering in SAP HANA')


# Instantiate connection object

import hana_ml.dataframe as dataframe

conn = dataframe.ConnectionContext(address = '',

                                   port = 0,

                                   user = '',

                                   password = '',

                                   encrypt = 'true'

                                  )


# Data to be clustered

df_remote = conn.table(table = 'MALL_CUSTOMERS').sort('CUSTOMER_ID', desc = False)


# Number of clusters

cluster_count = st.slider(label = "How many clusters: ", min_value = 2, max_value = 10, value = 5)


# Cluster

from hana_ml.algorithms.pal.clustering import KMeans

pal_kmeans = KMeans(n_clusters = cluster_count)

df_remote_labels = pal_kmeans.fit_predict(data = df_remote, key = 'CUSTOMER_ID')


# Count and display members per cluster

count_by_cluster = df_remote_labels.agg([('count', 'CUSTOMER_ID', 'COUNT' )], group_by = 'CLUSTER_ID').collect()

st.dataframe(count_by_cluster)


import seaborn as sns

sns.set()

sns.barplot(x='CLUSTER_ID',y='COUNT',data=count_by_cluster,color='darkblue')

st.pyplot()
Save the pal_cluster_count.py file and execute it with streamlit from the Anaconda Prompt.
streamlit run "C:\path\to\the\file\Birthdayparadox\pal_cluster_count.py"
Move the slider and SAP HANA will apply K-means to cluster the sample data for the requested number of clusters. The table and plot show how many members are assigned to each cluster. The clustering was done in SAP HANA without any data extraction. SAP HANA also counted how many elements were assigned to the different cluster. Only these aggregates were then transferred back to Python / streamlit.

You have created an interactive low-code data analysis application that pushed the Machine Learning calculation to SAP HANA!
If you want more, continue with the next tutorial...
- SAP Managed Tags:
- SAP HANA
Labels:
6 Comments
You must be a registered user to add a comment. If you've already registered, sign in. Otherwise, register and sign in.
Labels in this area
-
ABAP CDS Views - CDC (Change Data Capture)
2 -
AI
1 -
Analyze Workload Data
1 -
BTP
1 -
Business and IT Integration
2 -
Business application stu
1 -
Business Technology Platform
1 -
Business Trends
1,658 -
Business Trends
91 -
CAP
1 -
cf
1 -
Cloud Foundry
1 -
Confluent
1 -
Customer COE Basics and Fundamentals
1 -
Customer COE Latest and Greatest
3 -
Customer Data Browser app
1 -
Data Analysis Tool
1 -
data migration
1 -
data transfer
1 -
Datasphere
2 -
Event Information
1,400 -
Event Information
66 -
Expert
1 -
Expert Insights
177 -
Expert Insights
293 -
General
1 -
Google cloud
1 -
Google Next'24
1 -
Kafka
1 -
Life at SAP
780 -
Life at SAP
12 -
Migrate your Data App
1 -
MTA
1 -
Network Performance Analysis
1 -
NodeJS
1 -
PDF
1 -
POC
1 -
Product Updates
4,577 -
Product Updates
340 -
Replication Flow
1 -
RisewithSAP
1 -
SAP BTP
1 -
SAP BTP Cloud Foundry
1 -
SAP Cloud ALM
1 -
SAP Cloud Application Programming Model
1 -
SAP Datasphere
2 -
SAP S4HANA Cloud
1 -
SAP S4HANA Migration Cockpit
1 -
Technology Updates
6,873 -
Technology Updates
417 -
Workload Fluctuations
1
Related Content
- ABAP Cloud Developer Trial 2022 Available Now in Technology Blogs by SAP
- Hack2Build on Business AI – Highlighted Use Cases in Technology Blogs by SAP
- Analyze Expensive ABAP Workload in the Cloud with Work Process Sampling in Technology Blogs by SAP
- New Machine Learning features in SAP HANA Cloud in Technology Blogs by SAP
- Unify your process and task mining insights: How SAP UEM by Knoa integrates with SAP Signavio in Technology Blogs by SAP
Top kudoed authors
| User | Count |
|---|---|
| 33 | |
| 25 | |
| 10 | |
| 7 | |
| 7 | |
| 7 | |
| 6 | |
| 6 | |
| 5 | |
| 4 |