
- SAP Community
- Products and Technology
- Technology
- Technology Blogs by SAP
- Analytics Designer: Five Business Cases for Truly ...
Technology Blogs by SAP
Learn how to extend and personalize SAP applications. Follow the SAP technology blog for insights into SAP BTP, ABAP, SAP Analytics Cloud, SAP HANA, and more.
Turn on suggestions
Auto-suggest helps you quickly narrow down your search results by suggesting possible matches as you type.
Showing results for
Advisor
Options
- Subscribe to RSS Feed
- Mark as New
- Mark as Read
- Bookmark
- Subscribe
- Printer Friendly Page
- Report Inappropriate Content
10-12-2020
8:45 AM
By Jie Deng, Product Manager of SAP Analytics Cloud, SAP
The most valuable employees are the ones that know how to navigate an increasingly uncertain world with a clear, practical course of action. They understand how to mitigate risks to build customer trust, enhance the brand’s reputation, foresee market opportunities that improve sustainable growth, and innovate products and services that are relevant today and tomorrow.
Yet, hiring fresh talent and upskilling existing employees are not enough to develop such an effective workforce. Companies should also furnish their workforce with an analytics ecosystem that includes everything from storytelling and visualizations to insight sharing, simulations, and predictive and automated tools.
For many SAP customers and their partners, the key to creating this data-driven decision-making experience is the adoption of the SAP Analytics Cloud solution. It provides a single platform that ties together the advantages of business intelligence (BI), augmented analytics, and enterprise planning.
But the implementation of the cloud-based analytics solution is only the beginning for most of our customers’ analytics transformation. By deepening their decision-making skills with the analytics designer capability for SAP Analytics Cloud, they are supporting a customized analytics experience that is integrated and extended across the entire enterprise system landscape, including existing BI, planning, and predictive capabilities from SAP Analytics Cloud.
Build a knowledgeable workforce with a personalized analytics design
With analytics designer, our customers can create analytics applications in a dedicated, low-code environment to present data in many forms, ranging from simple static dashboards to highly customized and interactive analytics applications. Users can browse and navigate insights across multiple areas and switch formats to detect, forecast, and anticipate emerging opportunities and risks.
The capability supports the agile development of analytic applications end to end – from defining the data model and layout of the screen to configuring widgets and wiring it all with the help of custom scripts. And when this exercise includes the use of existing content, templates, and user stories, our customers can benefit from any of the following business cases.
Figure 1: Example of a Generic Analysis
For business scenarios, processes, and concerns that are complex and unique, our customers can set up applications – usually developed by an application designer or SAP partner. They can acquire a set of simple dashboards, charts, and calculations continuously updated based on each user’s data exploration activity, click events, and visualization and reporting selections.
Requiring no intervention from IT, the self-guided application design helps the user navigate the decision-making process based on continuous learning. It tracks past and current clicks, screen visits, and queries to deliver meaningful insights by directing the user through a closed-loop workflow of notifications, issue analysis, simulation, and action.
Figure 2: Example of a Guided Analytics Application
Figure 3: Example of a Guided Analytics Application
Dashboards with a flexible and responsive layout can turn even the most complicated process or interaction into a foundation for optimized operational performance. An intuitive drag-and-drop features allows application designers to create, edit, and arrange analytics content, ranging from reports and visualizations to data-driven analytics. When ready, the information can be shared with designated experts, teams, organizations, and the larger business network and optimized automatically for a wide variety of desktop and mobile devices.
Figure 4: Example of a responsive analytic application
Figure 5: Example of a dashboard with flexible interactions and layouts
When using planning applications, users do not always enjoy an experience that requires modification of data in redundant tables, clicking through multiple dialogs. More often than not, they want a straightforward planning function that automatically populates analytics tools with data from other business systems and only requires clicking one button to run the query – anytime, anywhere, and on any mobile device.
The analytics designer capability repurposes the planning features of SAP Analytics Cloud and enhances them with flexible scripting. This approach supports customizations of applications according to user requirements and integration with planning data models, allocations, data-action triggers, and other planning activities.
Figure 6: Example of a Planning User Interface
Embedding and extending analytics tools in all enterprise systems are becoming more critical as more companies realize the importance of real-time insights and data-driven automation. With this mind-set, our customers are well-positioned to streamline their decision-making process with the data collected, processed, analyzed, and shared through a single application.
The analytics designer inserts any external analytics page into an analytics application or implants the analytics application into an external page. Users can also choose to use a software development kit edition to create custom widgets to meet unique BI and analytics needs.
No matter which approach is chosen, the analytics applications and external pages can communicate with each other, using a post-message API to enhance responsiveness.
Figure 5: Examples of a 3D parking house built by custom widget SDK in analytics designer
Get ready for the next phase of your analytics transformation
Is your business ready to amplify the value of its data with analytics applications that deliver the truly informed experiences necessary to overcome economic uncertainty and prepare for a future recovery?
Take a look at the following resources to get more information on the capabilities offered through SAP Analytics Cloud, analytics designer:
The most valuable employees are the ones that know how to navigate an increasingly uncertain world with a clear, practical course of action. They understand how to mitigate risks to build customer trust, enhance the brand’s reputation, foresee market opportunities that improve sustainable growth, and innovate products and services that are relevant today and tomorrow.
Yet, hiring fresh talent and upskilling existing employees are not enough to develop such an effective workforce. Companies should also furnish their workforce with an analytics ecosystem that includes everything from storytelling and visualizations to insight sharing, simulations, and predictive and automated tools.
For many SAP customers and their partners, the key to creating this data-driven decision-making experience is the adoption of the SAP Analytics Cloud solution. It provides a single platform that ties together the advantages of business intelligence (BI), augmented analytics, and enterprise planning.
But the implementation of the cloud-based analytics solution is only the beginning for most of our customers’ analytics transformation. By deepening their decision-making skills with the analytics designer capability for SAP Analytics Cloud, they are supporting a customized analytics experience that is integrated and extended across the entire enterprise system landscape, including existing BI, planning, and predictive capabilities from SAP Analytics Cloud.
Build a knowledgeable workforce with a personalized analytics design
With analytics designer, our customers can create analytics applications in a dedicated, low-code environment to present data in many forms, ranging from simple static dashboards to highly customized and interactive analytics applications. Users can browse and navigate insights across multiple areas and switch formats to detect, forecast, and anticipate emerging opportunities and risks.
The capability supports the agile development of analytic applications end to end – from defining the data model and layout of the screen to configuring widgets and wiring it all with the help of custom scripts. And when this exercise includes the use of existing content, templates, and user stories, our customers can benefit from any of the following business cases.
- Generic applications
Traditional applications are created for a specific model, supported by a narrowly scoped user interface, set of widgets, and logic and made available to predefined dimensions and members. But with generic applications, our customer can deliver a model that can be executed anywhere and customized on demand. Such applications include table-centric, slice-and-dice analysis and allow users to select a new dimension, key figure, or filter at run time.

Figure 1: Example of a Generic Analysis
- Guided analytics applications
For business scenarios, processes, and concerns that are complex and unique, our customers can set up applications – usually developed by an application designer or SAP partner. They can acquire a set of simple dashboards, charts, and calculations continuously updated based on each user’s data exploration activity, click events, and visualization and reporting selections.
Requiring no intervention from IT, the self-guided application design helps the user navigate the decision-making process based on continuous learning. It tracks past and current clicks, screen visits, and queries to deliver meaningful insights by directing the user through a closed-loop workflow of notifications, issue analysis, simulation, and action.
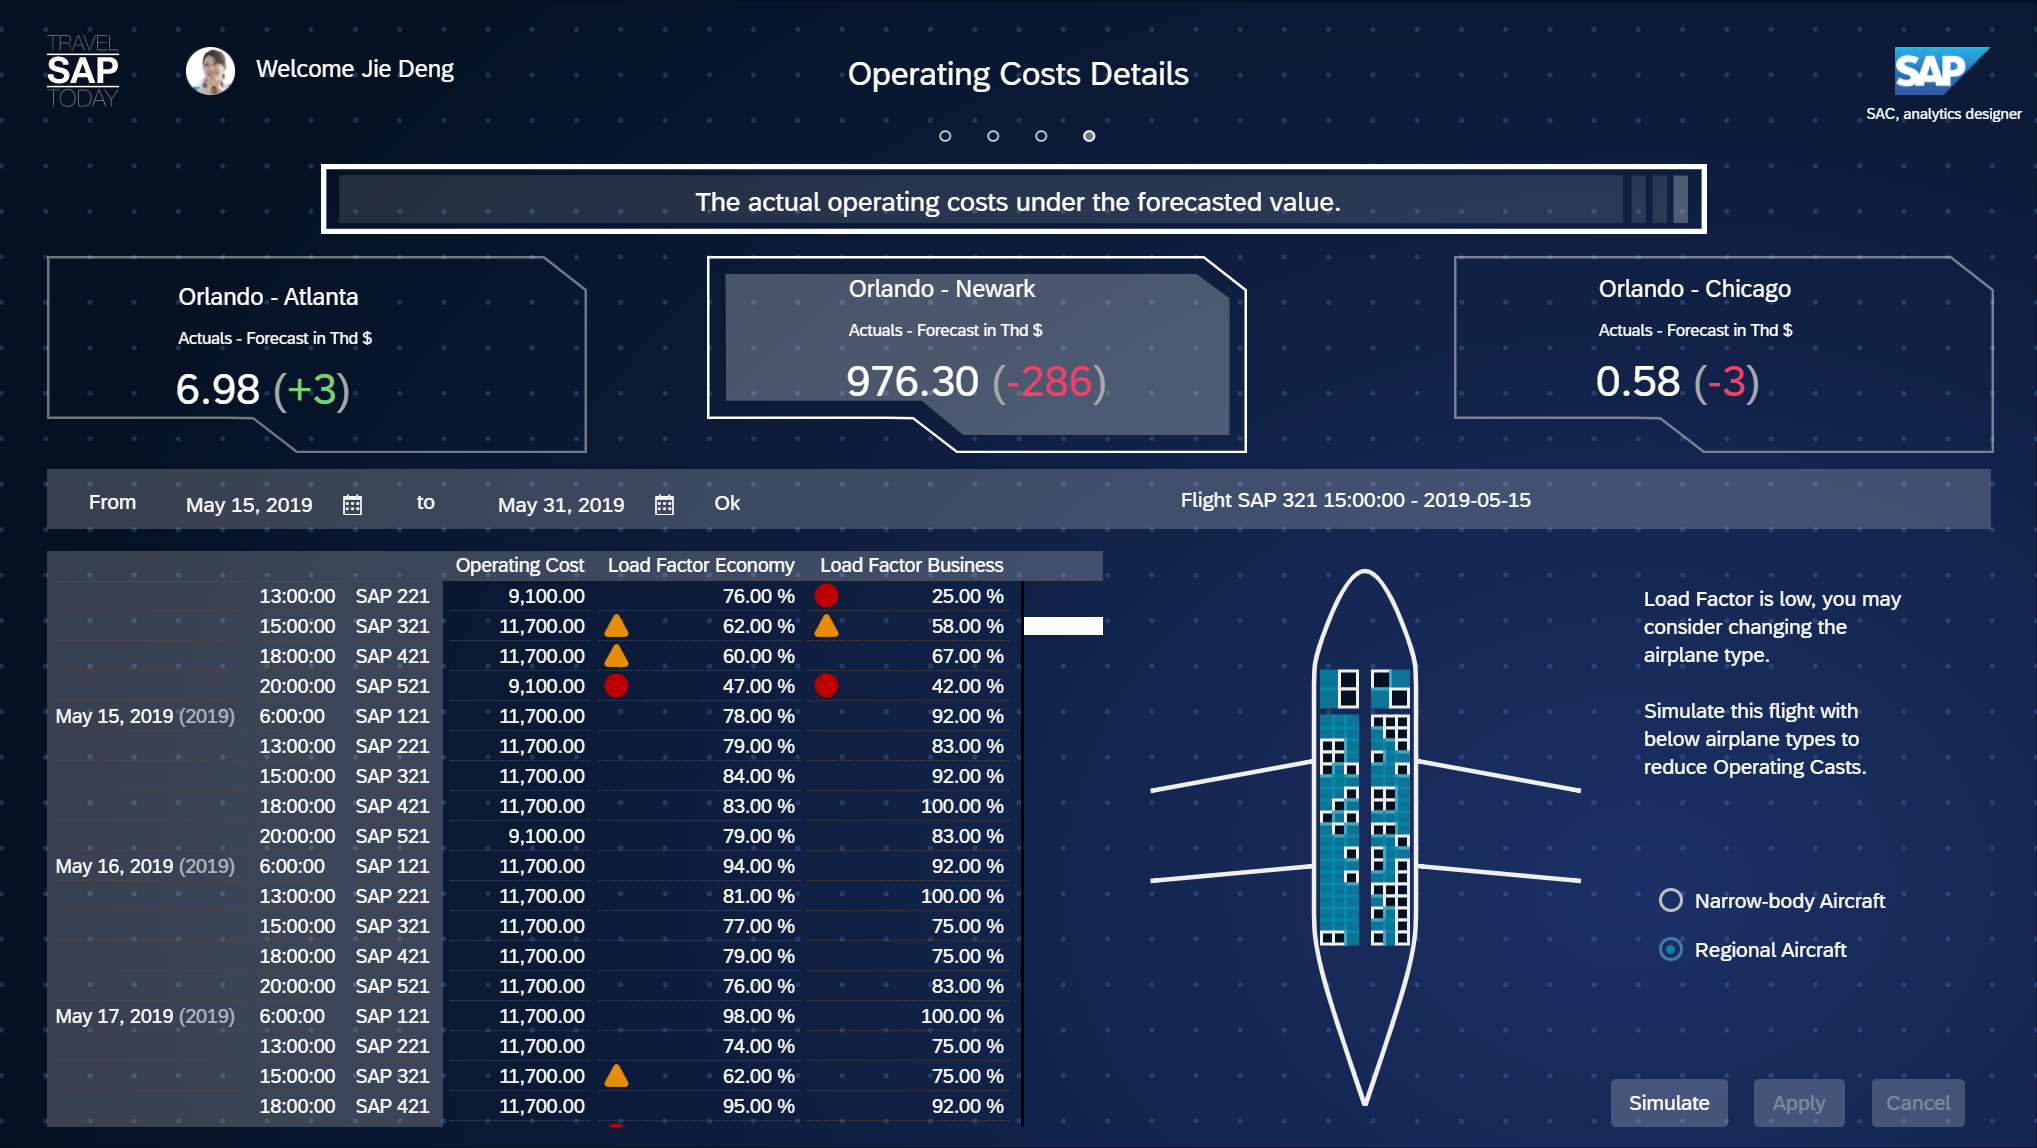
Figure 2: Example of a Guided Analytics Application

Figure 3: Example of a Guided Analytics Application
- Dashboards with flexible interactions and layouts
Dashboards with a flexible and responsive layout can turn even the most complicated process or interaction into a foundation for optimized operational performance. An intuitive drag-and-drop features allows application designers to create, edit, and arrange analytics content, ranging from reports and visualizations to data-driven analytics. When ready, the information can be shared with designated experts, teams, organizations, and the larger business network and optimized automatically for a wide variety of desktop and mobile devices.

Figure 4: Example of a responsive analytic application

Figure 5: Example of a dashboard with flexible interactions and layouts
- Planning user interface
When using planning applications, users do not always enjoy an experience that requires modification of data in redundant tables, clicking through multiple dialogs. More often than not, they want a straightforward planning function that automatically populates analytics tools with data from other business systems and only requires clicking one button to run the query – anytime, anywhere, and on any mobile device.
The analytics designer capability repurposes the planning features of SAP Analytics Cloud and enhances them with flexible scripting. This approach supports customizations of applications according to user requirements and integration with planning data models, allocations, data-action triggers, and other planning activities.

Figure 6: Example of a Planning User Interface
- Embedded and extended analytics applications
Embedding and extending analytics tools in all enterprise systems are becoming more critical as more companies realize the importance of real-time insights and data-driven automation. With this mind-set, our customers are well-positioned to streamline their decision-making process with the data collected, processed, analyzed, and shared through a single application.
The analytics designer inserts any external analytics page into an analytics application or implants the analytics application into an external page. Users can also choose to use a software development kit edition to create custom widgets to meet unique BI and analytics needs.
No matter which approach is chosen, the analytics applications and external pages can communicate with each other, using a post-message API to enhance responsiveness.

Figure 5: Examples of a 3D parking house built by custom widget SDK in analytics designer
Get ready for the next phase of your analytics transformation
Is your business ready to amplify the value of its data with analytics applications that deliver the truly informed experiences necessary to overcome economic uncertainty and prepare for a future recovery?
Take a look at the following resources to get more information on the capabilities offered through SAP Analytics Cloud, analytics designer:
- SAP Managed Tags:
- SAP Analytics Cloud,
- SAP Analytics Cloud, analytics designer
Labels:
1 Comment
You must be a registered user to add a comment. If you've already registered, sign in. Otherwise, register and sign in.
Labels in this area
-
ABAP CDS Views - CDC (Change Data Capture)
2 -
AI
1 -
Analyze Workload Data
1 -
BTP
1 -
Business and IT Integration
2 -
Business application stu
1 -
Business Technology Platform
1 -
Business Trends
1,661 -
Business Trends
88 -
CAP
1 -
cf
1 -
Cloud Foundry
1 -
Confluent
1 -
Customer COE Basics and Fundamentals
1 -
Customer COE Latest and Greatest
3 -
Customer Data Browser app
1 -
Data Analysis Tool
1 -
data migration
1 -
data transfer
1 -
Datasphere
2 -
Event Information
1,400 -
Event Information
65 -
Expert
1 -
Expert Insights
178 -
Expert Insights
280 -
General
1 -
Google cloud
1 -
Google Next'24
1 -
Kafka
1 -
Life at SAP
784 -
Life at SAP
11 -
Migrate your Data App
1 -
MTA
1 -
Network Performance Analysis
1 -
NodeJS
1 -
PDF
1 -
POC
1 -
Product Updates
4,577 -
Product Updates
330 -
Replication Flow
1 -
RisewithSAP
1 -
SAP BTP
1 -
SAP BTP Cloud Foundry
1 -
SAP Cloud ALM
1 -
SAP Cloud Application Programming Model
1 -
SAP Datasphere
2 -
SAP S4HANA Cloud
1 -
SAP S4HANA Migration Cockpit
1 -
Technology Updates
6,886 -
Technology Updates
408 -
Workload Fluctuations
1
Related Content
- Deep dive into Q4 2023, What’s New in SAP Cloud ALM for Implementation Blog Series in Technology Blogs by SAP
- Enter the era of spatial computing for enterprise with SAP Build Code in Technology Blogs by SAP
- Embrace the Future: Transform and Standardize Operations with Chatbot in Technology Blogs by Members
- Optimized Design Experience in SAP Analytics Cloud - Building Containers in a no code Environment in Technology Blogs by SAP
- Responsive vs. Canvas in SAP Analytics Cloud with Optimized Design Experience in Technology Blogs by Members
Top kudoed authors
| User | Count |
|---|---|
| 13 | |
| 10 | |
| 10 | |
| 9 | |
| 8 | |
| 7 | |
| 6 | |
| 5 | |
| 5 | |
| 5 |