
- SAP Community
- Products and Technology
- Technology
- Technology Blogs by SAP
- How to create Generic drilldown report with Manage...
Technology Blogs by SAP
Learn how to extend and personalize SAP applications. Follow the SAP technology blog for insights into SAP BTP, ABAP, SAP Analytics Cloud, SAP HANA, and more.
Turn on suggestions
Auto-suggest helps you quickly narrow down your search results by suggesting possible matches as you type.
Showing results for
Employee
Options
- Subscribe to RSS Feed
- Mark as New
- Mark as Read
- Bookmark
- Subscribe
- Printer Friendly Page
- Report Inappropriate Content
10-09-2020
7:19 AM
Introduction
From SAP S/4HANA 1909 OP, the Key User Tool F2814 - Manage KPIs and reports has been released.
Until SAP S/4HANA 1809 OP, we had a set of KPI Fiori applications like “Create KPI”, “KPI Workspace” and so on, therefore we had to jump across each application on our needs in order to create KPI reports. Now they are integrated into this app - “Manage KPIs and reports”, which is a single integrated platform to create KPI Groups, KPIs, reports, and applications that is launched directly from SAP Fiori launchpad.
Its main capabilities are;
- Create KPI Groups
- Create KPIs
- Create Reports
- Generic drilldown Reports
- Analytical List Page
This blog post focuses on one of the reports which this app can create - Generic drilldown report, which is formerly called "Smart Business KPI" report. The content of this blog post includes what is Generic drilldown report and how to create them from KPI.
Reference) Generic drilldown report is based on "KPI", which is a important concept in fiori analytics. Please refer to the blog post below if you want basic information about KPI itself.
Basics about Key Performance Indicators (KPI)
What is the report type: “Generic drilldown report”?
Generic drilldown report are chart and table visualizations in which the data is aggregated and filtered based on values defined in the KPI. The name of report is written as “Generic report” in Help portal, and on the other hand on the application it is written as “Generic drilldown” - they mean the same thing and in this blog post I write the report name as “Generic drilldown report”. The screen feature is below;
Example) F0683 - Purchasing Spend

The characteristic points are;
- Generic drilldown report can have dynamic tile with Initial KPI.
- In the main area of the report, you have chart/table and you can drilldown the aggregated data.
- Generic drilldown report is based upon a KPI, which means you cannot create the report without a KPI.
- On the other hand, a Generic drilldown report displays some Mini charts – which actually are configured KPIs.
The most distinctive feature of this report type is that drilldown operation is very easy with this report type. It can be done by just clicking the focusing data and selecting different view. Below is drilldown example with same Fiori app - F0683.

Help Portal: Manage KPI and reports – Generic reports
Steps to Create Generic drilldown report
As wrote above, Generic drilldown report is based on a KPI. Thus, you must create a KPI before creating a report. Moreover, a KPI must be in a KPI Group, therefore steps to create a Generic drilldown report with Manage KPIs and reports will be as below;
1 - Create a datasource: We use CDS View to define a datasource, or you can refer to a standard delivered CDS View
2 - Create a KPI Group: Before you define a KPI, you must prepare a KPI Group which will be an owner of the KPI which is to be created. A KPI cannot be created without a KPI Group.
3 - Create a KPI: Here you select the datasource and define key figures. Also, you must define thresholds for the key figures here. A Generic drilldown report cannot be created without a KPI.
4 - Create a Generic drilldown report: You create a Generic drilldown report from the KPI. With the key figures and dimensions in the data source in the KPI, you configure the charts for the Generic drilldown report. Also, you configure filters/drilldowns/Mini charts here.
5 - Create a tile for the app
6 - Finished!
In the next section, we see step-by-step procedure to create the report.
Hands-on steps
1 - Create a datasource
If you already have a data source, or wish to use an SAP supplied CDS View, skip to step #2
In this blog post, I refer to flight data model in the following blog post.
Create an analytical model based on ABAP CDS views
*Caution: I have made some corrections in Cube and Query CDS View in the blog post in order to enable date function.
Here is the sample codes of CUBE and Query which I use in this blog post.
For dimensions, I use CDS Views on the blog post above.
Cube: Z_Cube_FlightBookings
@AbapCatalog.sqlViewName: 'ZCUBEFLIGHTBOOK'

@AbapCatalog.compiler.compareFilter: true

@AccessControl.authorizationCheck: #CHECK

@EndUserText.label: 'Flight Bookings'


@Analytics.dataCategory: #CUBE


define view Z_Cube_FlightBookings

with parameters


    P_StartDate       : bedat,


    P_EndDate         : bedat


  as select from sbook

  association [0..1] to I_CalendarDate           as _CalendarDate on  $projection.FlightDate = _CalendarDate.CalendarDate

  association [0..1] to Z_Dimension_Airline      as _Airline      on  $projection.Airline = _Airline.Airline

  association [0..1] to Z_Dimension_Connection   as _Connection   on  $projection.Airline          = _Connection.Airline

                                                                  and $projection.FlightConnection = _Connection.FlightConnection

  association [0..1] to Z_Dimension_Customer     as _Customer     on  $projection.Customer = _Customer.Customer

  association [0..1] to Z_Dimension_TravelAgency as _TravelAgency on  $projection.TravelAgency = _TravelAgency.TravelAgency

{

  /** DIMENSIONS **/


  @EndUserText.label: 'Airline'

  @ObjectModel.foreignKey.association: '_Airline'

  carrid                 as Airline,


  @EndUserText.label: 'Connection'

  @ObjectModel.foreignKey.association: '_Connection'

  connid                 as FlightConnection,


  @EndUserText.label: 'Flight Date'

  @ObjectModel.foreignKey.association: '_CalendarDate'

  fldate                 as FlightDate,


  @EndUserText.label: 'Book No.'

  bookid                 as BookNumber,


  @EndUserText.label: 'Customer'

  @ObjectModel.foreignKey.association: '_Customer'

  customid               as Customer,


  @EndUserText.label: 'Travel Agency'

  @ObjectModel.foreignKey.association: '_TravelAgency'

  agencynum              as TravelAgency,


  @EndUserText.label: 'Flight Year'

  _CalendarDate.CalendarYear,


  @EndUserText.label: 'Flight Month'

  _CalendarDate.CalendarMonth,


  @EndUserText.label: 'Customer Country'

  @ObjectModel.foreignKey.association: '_CustomerCountry'

  _Customer.Country      as CustomerCountry,


  @EndUserText.label: 'Customer City'

  _Customer.City         as CustomerCity,


  @EndUserText.label: 'Travel Agency Country'

  @ObjectModel.foreignKey.association: '_TravelAgencyCountry'

  _TravelAgency.Country  as TravelAgencyCountry,


  @EndUserText.label: 'Travel Agency Customer City'

  _TravelAgency.City     as TravelAgencyCity,


  /** MEASURES **/


  @EndUserText.label: 'Total of Bookings'

  @DefaultAggregation: #SUM

  1                      as TotalOfBookings,


  @EndUserText.label: 'Weight of Luggage'

  @DefaultAggregation: #SUM

  @Semantics.quantity.unitOfMeasure: 'WeightUOM'

  luggweight             as WeightOfLuggage,


  @EndUserText.label: 'Weight Unit'

  @Semantics.unitOfMeasure: true

  wunit                  as WeightUOM,


  @EndUserText.label: 'Booking Price'

  @DefaultAggregation: #SUM

  @Semantics.amount.currencyCode: 'Currency'

  forcuram               as BookingPrice,


  @EndUserText.label: 'Currency'

  @Semantics.currencyCode: true

  forcurkey              as Currency,


  // Associations

  _Airline,

  _CalendarDate,

  _CalendarDate._CalendarMonth,

  _CalendarDate._CalendarYear,

  _Connection,

  _Customer,

  _Customer._Country     as _CustomerCountry,

  _TravelAgency,

  _TravelAgency._Country as _TravelAgencyCountry

}

where fldate <= $parameters.P_EndDate

  and fldate >= $parameters.P_StartDate
Query: Z_Query_FlightBookings
@AbapCatalog.sqlViewName: 'ZQUERYFLIGHTBOOK'

@AbapCatalog.compiler.compareFilter: true

@AccessControl.authorizationCheck: #CHECK

@EndUserText.label: 'Flight Bookings'


@OData.publish: true

@Analytics.query: true

@VDM.viewType: #CONSUMPTION


define view Z_Query_FlightBookings


with parameters

    @Consumption.derivation: { lookupEntity: 'C_SglGregorianCalDateFunction',

    resultElement: 'DateFunctionStartDate', binding: [ {

      targetParameter: 'P_DateFunction', type: #PARAMETER, value : 'P_DateFunction' }]

    }

    @Consumption.hidden: true

    P_StartDate       : bedat,


    @Consumption.derivation: { lookupEntity: 'C_SglGregorianCalDateFunction',

    resultElement: 'DateFunctionEndDate', binding: [ {

      targetParameter: 'P_DateFunction', type: #PARAMETER, value : 'P_DateFunction' }]

    }

    @Consumption.hidden: true

    P_EndDate         : bedat,


    @Consumption.defaultValue: 'PREVIOUSYEARTODATE'

    @Consumption.valueHelpDefinition: [{

      entity: {

        name:'C_GregorianCalDateFuncVH',

        element:'DateFunction'

      }

    }]

    P_DateFunction    : datefunctionid


  as select from Z_Cube_FlightBookings (P_StartDate : $parameters.P_StartDate,

                                        P_EndDate : $parameters.P_EndDate)

{

    /** DIMENSIONS **/


    @AnalyticsDetails.query.display: #KEY_TEXT

    @AnalyticsDetails.query.axis: #FREE

    Airline,

    @AnalyticsDetails.query.display: #KEY_TEXT

    @AnalyticsDetails.query.axis: #FREE

    FlightConnection,

    @AnalyticsDetails.query.display: #KEY

    @AnalyticsDetails.query.axis: #FREE

    FlightDate,

    @AnalyticsDetails.query.display: #KEY_TEXT

    @AnalyticsDetails.query.axis: #FREE

    Customer,

    @AnalyticsDetails.query.display: #KEY_TEXT

    @AnalyticsDetails.query.axis: #FREE

    TravelAgency,

    @AnalyticsDetails.query.display: #KEY

    @AnalyticsDetails.query.axis: #FREE

    CalendarYear,

    @AnalyticsDetails.query.display: #TEXT

    @AnalyticsDetails.query.axis: #FREE

    CalendarMonth,

    @AnalyticsDetails.query.display: #TEXT

    @AnalyticsDetails.query.axis: #FREE

    CustomerCountry,

    @AnalyticsDetails.query.display: #KEY

    @AnalyticsDetails.query.axis: #FREE

    CustomerCity,

    @AnalyticsDetails.query.display: #TEXT

    @AnalyticsDetails.query.axis: #FREE

    TravelAgencyCountry,

    @AnalyticsDetails.query.display: #KEY

    @AnalyticsDetails.query.axis: #FREE

    TravelAgencyCity,

    @AnalyticsDetails.query.display: #KEY

    @AnalyticsDetails.query.axis: #FREE

    Currency,

    @AnalyticsDetails.query.display: #KEY

    @AnalyticsDetails.query.axis: #FREE

    WeightUOM,


    /** MEASURES **/


    TotalOfBookings,

    WeightOfLuggage,

    BookingPrice,


    @EndUserText.label: 'Average Weight Per Flight'

    @AnalyticsDetails.exceptionAggregationSteps.exceptionAggregationBehavior: #AVG

    @AnalyticsDetails.exceptionAggregationSteps.exceptionAggregationElements: [ 'Airline', 'FlightConnection', 'FlightDate' ]

    @AnalyticsDetails.query.formula: '$projection.WeightOfLuggage'

    @AnalyticsDetails.query.decimals: 0

    0 as AverageWeightPerFlight

}
And, also please be aware that the CDS View you want to create is released to be used from Manage KPIs and reports App.
Log on with ADT -> Z_Query_FlightBookings -> Select API State -> Add Use System-Internally


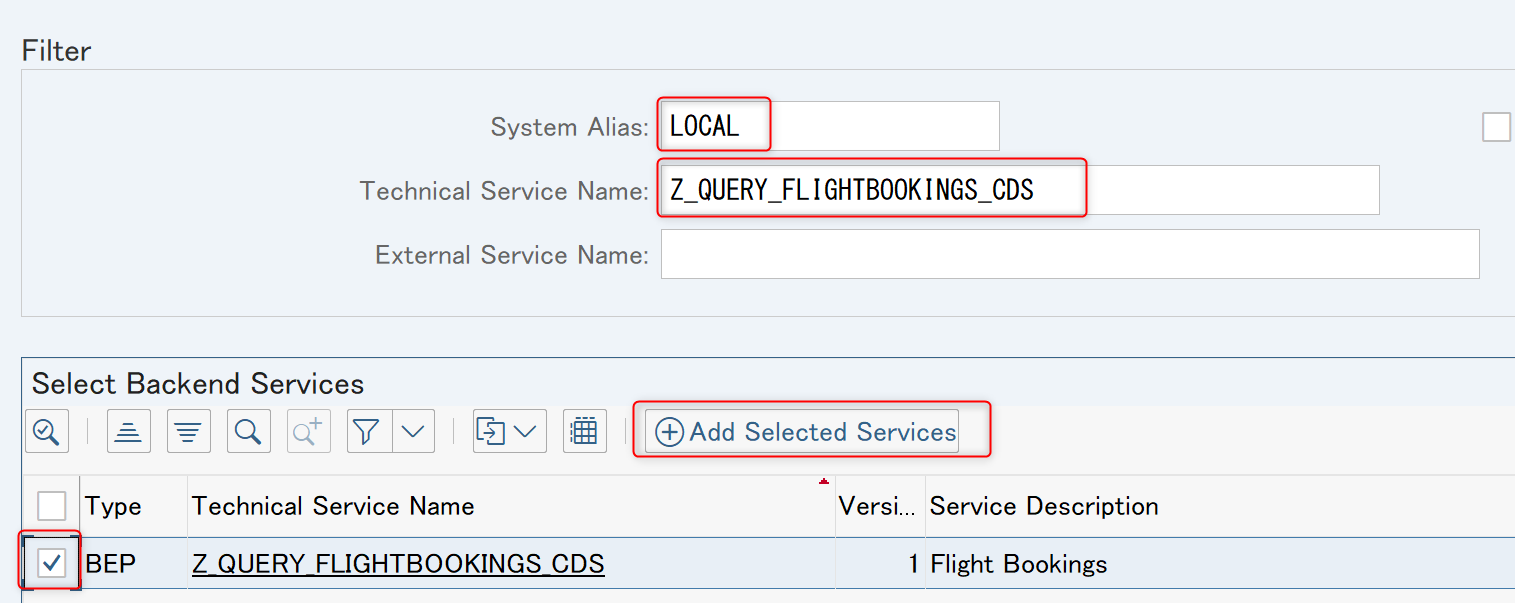
After the completion of your CDS View Z_Query_FlightBookings, let’s publish it as OData service like below;
Transaction Code: /n/iwfnd/maint_services, and press “+Add Service”

Select the OData service you want to publish – Z_QUERY_FLIGHTBOOKINGS_CDS in this example.
2 - Create a KPI Group
Let’s open the fiori app “Manage KPIs and reports” and see its structure.
In the app, you have 2 options (tabs) – “KPI” or “Reports”.
“KPI” has 2 tabs – Groups and KPIs. They mean KPI Groups and KPIs respectively.
In the first place let’s create KPI Group.

Fill out the title(Flight KPI Group).

Transport request is asked. This time I chose local object because it is test object.

3 - Create a KPI
Now you can create a KPI, because you created the KPI Group.
In the KPI Group detail page, you can create KPI in it.

Fill out the title(Flight KPI) and this is the time to select the datasource(CDS View) you created.

Enter “Z_Query” on the selection field so that you can select the datasource.
*Your CDS View may not be released if it is not visible on the selection as I wrote above.
Press “OK” after you select the view name.

Next, we configure the KPI in detail. We have 2 sections to configure;
Input parameters and filters
Here you define the initial input filter for aggregating of the measure. I use date function to filter the data, as defined in the CDS View. With date functions, it is possible to filter date dynamically based on your current date. For the details, please refer to the blog post below;
Date Function for dynamic date filtering in Fiori apps
Also, do not forget to set a currency to the filter with “Adapt Filters” – KPI is a aggregated measure, so if there are multiple currencies in a measure, the system cannot calculate the measure correctly. You need to set a base currency to be aggregated. In this example, I set “EUR” as a currency.

Semantics
In this section, you add semantics to the measure so that the measure becomes a KPI. Set fixed values/the other measure to evaluate if the value measure is critical/warned/enough for target. In this example, fixed value is set for the semantics.

- Value Measure: Total of Bookings
- Scaling Factor: Kilo
- Goal type: Maximizing
- Value Type: Fixed value
- Critical: 15000
- Warning: 20000
- Target: 30000
Press “Save and Activate”.
In the next section, we create a Generic drilldown report based on this KPI.
4 - Create a Generic drilldown report
Go back to the top page and press “Reports” icon on top of the page.
The press “Create” -> “Generic Drilldown”

Select the KPI you have created above.

Do not forget the “Definition” tab to set title to this report.

Go to “Configuration” tab and add filters, which are specific to the report which you are now creating.

In this example, I selected “Connection”, “Customer City”, “Travel Agency”, “Travel Agency Country”.

Add Mini Charts. Mini Charts are small charts which is based on a KPI. You can create Mini Charts from KPIs from the same KPI Group or associated KPI Group. Here let’s add a Mini Chart by using same KPI.

In this blog post I select Numeric Tile to display it. Press OK and finish the configuration.

Add a main view which will be displayed on the center of the report. It is very easy – just click “Add view” and configure measure/dimensions as below.

Enter the name of the view.
View Title: By Airlines

Click the gear icon so that you can configure the dimensions/measures.

Measure: Booking Price
Dimension: Airline

Then the chart appears. However, you must scroll down to see all the airlines in this chart… it is not good to see.
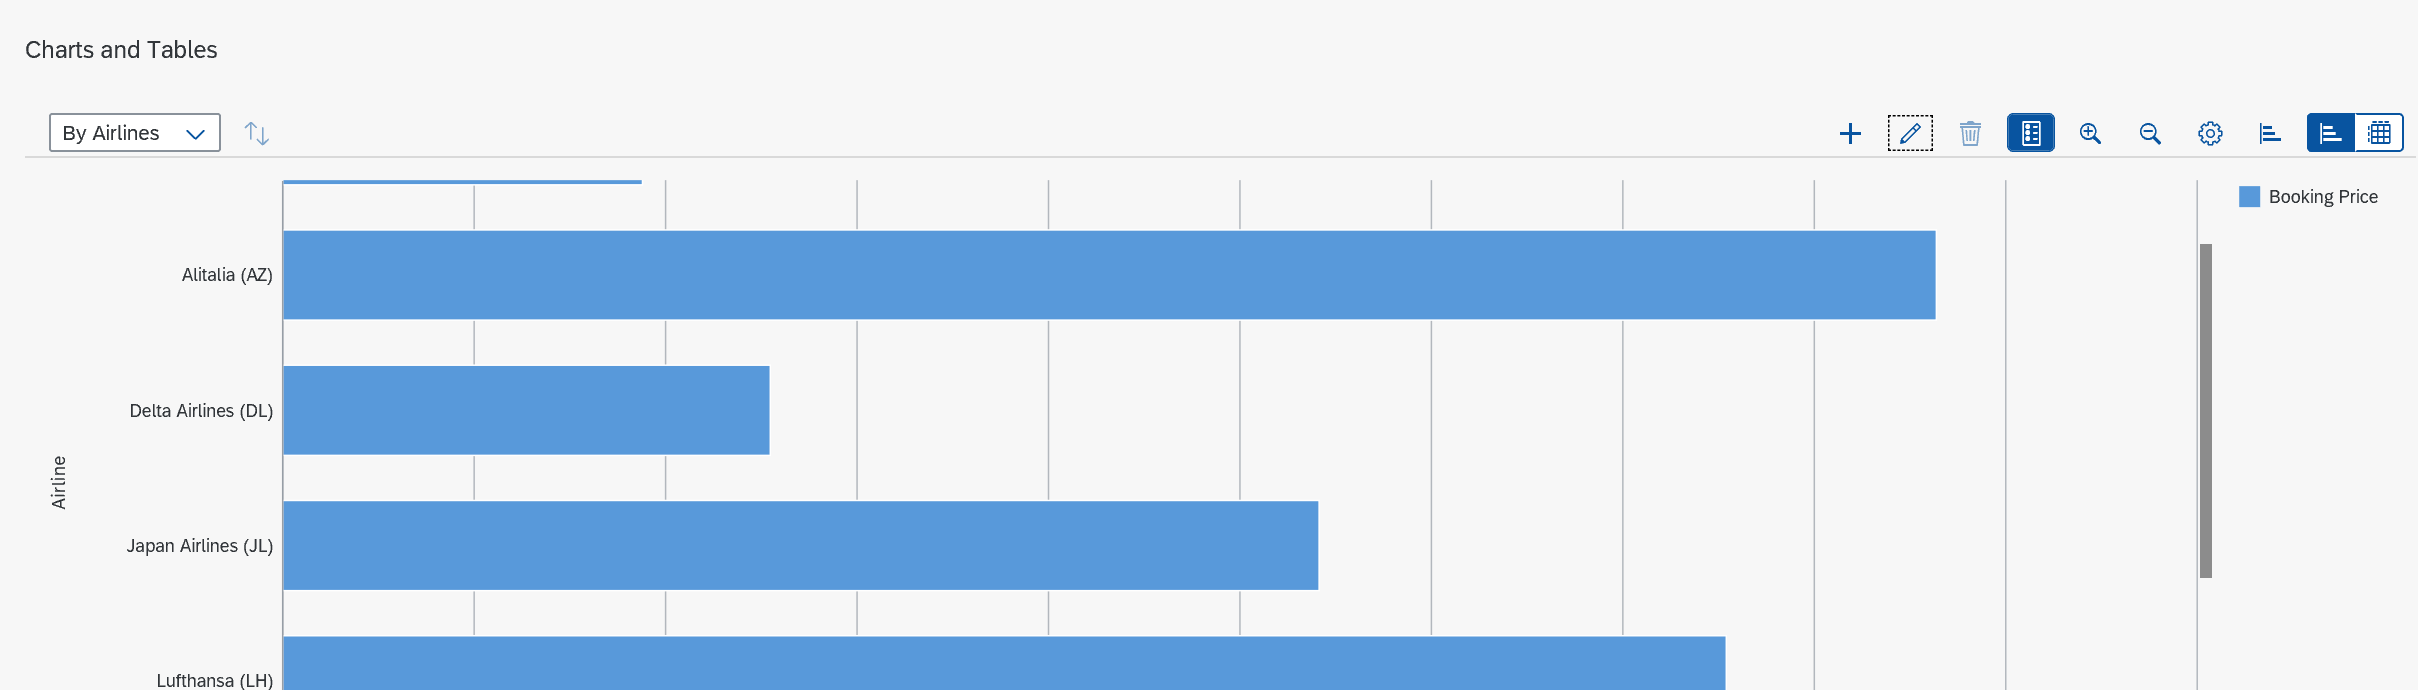
Let's change the type of the chart. Click the “chart” icon on header and select “Column chart”.

The chart type has changed and now it is easier to see all dimensions.

Here, assume that you want to add another view on the report… in that case, you can click the + icon on the header and repeat the step according to your report requirements. In this blog post, I am adding another view “By Countries”. Screenshots are as below.
Press + icon

Set view name

Select the dimension / measure
Measure: Booking Price
Dimension: Customer Country

Set chart type to “Column Chart”
After the report development has finished, press ”Activate”.

5 - Create a Tile for the app
Finally, you have to set this report as a tile, therefore everyone can use it as an application.
*Caution: In this step, you create a tile to a catalog – please log on to the system with the language on which you created the catalog. Otherwise you see the error below when you create a tile. “You cannot change Page in language en. Original language: ja” This error shows the catalog was created in JA(Japanese), but the report is created in EN. They must be same language.

Go to “Applications” tab and add Tile.

Select the type of Tile you want to set. In this scenario, let’s select “Numeric Tile”.

Enter titles as you want, and select the catalog where you want to put this report.

In Target Mapping area, you set the Semantic Object and Action for the tile to the report navigation. For the details of Semantic Object and Action, please refer to this blog post;
SAP Fiori for SAP S/4HANA – Understanding Insight to Action app-to-app navigation
In this blog post, I set as follows;
Semantic Object: FlightModel
Action: analyze

6 - Finished!
Find the app from app finder and check if your report is created as a tile.

When you press “Show Mini Charts”, the Mini Chart you configured appears.

Congratulations! Now you have completed creating your Generic drilldown report.

Thank you for reading. Hope you enjoyed the content!
You’ll find much more on our SAP Fiori for SAP S/4HANA wiki
Brought to you by the S/4HANA RIG
Yuto Sugita
Labels:
5 Comments
You must be a registered user to add a comment. If you've already registered, sign in. Otherwise, register and sign in.
Labels in this area
-
ABAP CDS Views - CDC (Change Data Capture)
2 -
AI
1 -
Analyze Workload Data
1 -
BTP
1 -
Business and IT Integration
2 -
Business application stu
1 -
Business Technology Platform
1 -
Business Trends
1,658 -
Business Trends
92 -
CAP
1 -
cf
1 -
Cloud Foundry
1 -
Confluent
1 -
Customer COE Basics and Fundamentals
1 -
Customer COE Latest and Greatest
3 -
Customer Data Browser app
1 -
Data Analysis Tool
1 -
data migration
1 -
data transfer
1 -
Datasphere
2 -
Event Information
1,400 -
Event Information
66 -
Expert
1 -
Expert Insights
177 -
Expert Insights
293 -
General
1 -
Google cloud
1 -
Google Next'24
1 -
Kafka
1 -
Life at SAP
780 -
Life at SAP
13 -
Migrate your Data App
1 -
MTA
1 -
Network Performance Analysis
1 -
NodeJS
1 -
PDF
1 -
POC
1 -
Product Updates
4,577 -
Product Updates
341 -
Replication Flow
1 -
RisewithSAP
1 -
SAP BTP
1 -
SAP BTP Cloud Foundry
1 -
SAP Cloud ALM
1 -
SAP Cloud Application Programming Model
1 -
SAP Datasphere
2 -
SAP S4HANA Cloud
1 -
SAP S4HANA Migration Cockpit
1 -
Technology Updates
6,873 -
Technology Updates
419 -
Workload Fluctuations
1
Related Content
- generating qrcode using image url in crystal report in Technology Q&A
- Crystal Reports Server - Restful API & Parameters in Technology Q&A
- SAP Datasphere - Space, Data Integration, and Data Modeling Best Practices in Technology Blogs by SAP
- Barcode generation works fine only for first report / CRYSTAL REPORTS in Technology Q&A
- Fiori Projects Actuals report - add Project Definition User Defined fields to drilldown in Technology Q&A
Top kudoed authors
| User | Count |
|---|---|
| 36 | |
| 25 | |
| 16 | |
| 13 | |
| 7 | |
| 7 | |
| 6 | |
| 6 | |
| 6 | |
| 6 |