
- SAP Community
- Products and Technology
- Technology
- Technology Blogs by SAP
- Get Your Master Data Quality Insight from SAP Anal...
Technology Blogs by SAP
Learn how to extend and personalize SAP applications. Follow the SAP technology blog for insights into SAP BTP, ABAP, SAP Analytics Cloud, SAP HANA, and more.
Turn on suggestions
Auto-suggest helps you quickly narrow down your search results by suggesting possible matches as you type.
Showing results for
Advisor
Options
- Subscribe to RSS Feed
- Mark as New
- Mark as Read
- Bookmark
- Subscribe
- Printer Friendly Page
- Report Inappropriate Content
10-07-2020
8:01 AM
Abstract
SAP Master Data Governance is a state-of-the-art master data management application.
Data Quality Management in MDG enables you to define master data quality rules, striving for consistent usage across all points of entry and enabling data quality monitoring and remediation.
SAP Analytics Cloudsd (SAC) is a top-tier SaaS solution that combines all your analytics needs, for example, Planning, Predictive, Business Intelligence and more, in one intuitive user interface, saving you time and effort while helping you make better decisions.
From MDG on SAP S/4HANA 2020 and Cloud 2008, two easy-to-use dashboards are delivered for end users, from chief data officer to master data specialist, to get real-time quality abstracts for master data quality as well as history trends:
- SAP MDG Data Quality Overview for Products
- SAP MDG Data Quality Overview for Business Partner
These dashboards, with a live data connection to your backend S/4 system, will enable you to monitor data quality score by Category, Dimension and Data Quality Rule. With MDG Data Quality Integration, all details of data quality insight can be explored, as well as how authorization control is integrated.
This blog will guide you on how to use this dashboard with your S/4 system and how to set it up.
To learn more about this dashboard and how the underlying errors in the data can be identified and directly be corrected, check out this demo video.
SAP MDG Data Quality Overview Dashboard
This dashboard overview page contains three levels of information:
- Category is a grouping of dimensions, while Category Score is the average of the scores of the assigned data quality dimensions.
- Dimension is a grouping of rules that assess one aspect of data quality, for example, completeness or correctness. Dimension Score is an aggregation of the scores of the rules assigned underneath.
- Data Quality Rule defines criteria to evaluate data quality. Rule Score indicates the data quality of the evaluated data.

Category Score
The Average Category Score give you the overview quality status of your master data.
The bar chart shows the five lowest score categories, and the trend chart provides the history of each category. When you click any category in the bar chart, the history trends chart displays only your selected ones with the same color. The dimension score charts and data quality rules charts below are updated accordingly.

In case you have configured Dashboard access via your S/4 Fiori Launchpad, you can also right click to jump to Configure Data Quality Score app on your selected Category
Dimension Score
The Average Dimension Score give you the overview quality of all defined dimensions for your master data.
The bar chart shows the five lowest score dimensions, and the trend chart provides the history of each dimension. When you click any dimension in the bar chart, the history trends chart displays only your selected ones with the same color. The data quality rules chart is updated accordingly.

Data Quality Rule Score
The Average Dimension Score give you the overview quality of all defined rules for your master data.
The bar chart shows the five lowest score rules, and the trend chart provides the history of each rule. When you click any rule in the bar chart, the history trends chart displays only your selected ones with the same color.
Additionally, you will get the navigation link on your selected rule. You can click to open the data quality rule application from your S/4 on-premise system.

[back to top]
How To Set Up Dashboard for Your SAC Tenant
Import the MDG Data Quality Content into Your Tenant
Open Content Network from your tenant, find the SAP Master Data Governance package, and import it.

Set Up the Connection to Your S/4 System
After the import, you have created the connection SAPMDG in your tenant. Open it and enter your system info.
You may need to configure basic settings in your system by following this document

Enhance Your Dashboard
There are two stories located under the Public/SAP_Content/SAP_MDG_Master_Data_Governance folder.

If you want to create a new chart or display more details on the existing chart, you can copy it to your own Story and enhance it there. There are many guides available on the learning center here.
Configure the Backend Navigation in Your S/4 On-Premise System
Call up transaction SE38 and execute the program MDQ_MAINT_HOST_PATH. Enter the SAP Fiori host path and execute.
Example: myhost.mycorp/sap/bc/ui5_ui5/ui2/ushell/shells/abap/FioriLaunchpad.html?#Shell-home
Afterwards, you will be able to open data quality rules in your S/4 on-premise system from your SAC tenant.
Configure the Backend Navigation in Your S/4 Cloud Tenant
If you are connecting to MDG on S/4 Cloud, replace the hyperlink in the story chart directly,
<YourS4TenantFioriLaunchpadhomeURL>#MDQualityBusinessRule-manage?MDQltyBusinessObjectTypeCode=194&MDQualityBusinessRule=[Rule Definition ID]

[back to top]
How To Access Dashboard for Your End User
Option 1: Access Your Dashboard via URL
Open the story, the URL now appearing in your browser is also the address for your end user to access the dashboard.
This option fits to casual user who access it time to time.

Option 2: Access Your Dashboard via Your S/4HANA Fiori Launchpad
It is also possible to embed the dashboard into your S/4HANA Fiori launchpad. For more professional users who are mainly working in this environment, they will be able to access the dashboard from here.
Firstly, set up basic system settings by following this document .
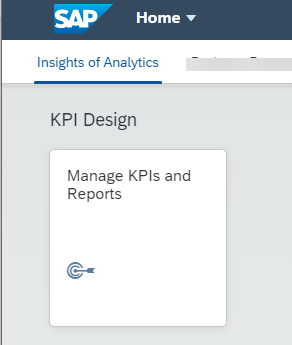
Once setup is done, you can now go to the Manage KPIs and Report app from your Fiori launchpad, open Stories, and select the connection. You will see your story listed there.

Now you can create Fiori applications in the catalog by following note 2919734. Here are my examples:
Target Mapping in Catalog

With parameter XSEMANTIC_OBJECTS, with Default value MDQualityDimensionCategory, you will be able to Jump to Configure Score app from the dashboard
Tile Configuration in Catalog

Afterwards, you can assign the catalog and group to PFCG Role, and assign th PFCG role to the end user and the tile should appear in his or her Fiori launchpad.


[back to top]
Summary
Following this blog, you should know how to use the dashboard, and also set up a data quality dashboard for your end user and explain to them
Reference
To understand the S/4 HANA integration with SAP Analytics Cloud, welcome to visit Rolf's blog
To learn more about this dashboard and how the underlying errors in the data can be identified and directly be corrected, check out this demo video.
To hear about all new features available in the SAP Master Data Governance on SAP S/4HANA 2020 release, check out Markus's blog.
- SAP Managed Tags:
- SAP Analytics Cloud,
- SAP Master Data Governance
Labels:
7 Comments
You must be a registered user to add a comment. If you've already registered, sign in. Otherwise, register and sign in.
Labels in this area
-
ABAP CDS Views - CDC (Change Data Capture)
2 -
AI
1 -
Analyze Workload Data
1 -
BTP
1 -
Business and IT Integration
2 -
Business application stu
1 -
Business Technology Platform
1 -
Business Trends
1,661 -
Business Trends
87 -
CAP
1 -
cf
1 -
Cloud Foundry
1 -
Confluent
1 -
Customer COE Basics and Fundamentals
1 -
Customer COE Latest and Greatest
3 -
Customer Data Browser app
1 -
Data Analysis Tool
1 -
data migration
1 -
data transfer
1 -
Datasphere
2 -
Event Information
1,400 -
Event Information
64 -
Expert
1 -
Expert Insights
178 -
Expert Insights
273 -
General
1 -
Google cloud
1 -
Google Next'24
1 -
Kafka
1 -
Life at SAP
784 -
Life at SAP
11 -
Migrate your Data App
1 -
MTA
1 -
Network Performance Analysis
1 -
NodeJS
1 -
PDF
1 -
POC
1 -
Product Updates
4,577 -
Product Updates
326 -
Replication Flow
1 -
RisewithSAP
1 -
SAP BTP
1 -
SAP BTP Cloud Foundry
1 -
SAP Cloud ALM
1 -
SAP Cloud Application Programming Model
1 -
SAP Datasphere
2 -
SAP S4HANA Cloud
1 -
SAP S4HANA Migration Cockpit
1 -
Technology Updates
6,886 -
Technology Updates
403 -
Workload Fluctuations
1
Related Content
- 10+ ways to reshape your SAP landscape with SAP BTP - Blog 4 Interview in Technology Blogs by SAP
- 10+ ways to reshape your SAP landscape with SAP Business Technology Platform – Blog 4 in Technology Blogs by SAP
- Top Picks: Innovations Highlights from SAP Business Technology Platform (Q1/2024) in Technology Blogs by SAP
- What’s New in SAP Analytics Cloud Release 2024.08 in Technology Blogs by SAP
- Value Unlocked! How customers benefit from SAP HANA Cloud in Technology Blogs by SAP
Top kudoed authors
| User | Count |
|---|---|
| 12 | |
| 10 | |
| 10 | |
| 7 | |
| 7 | |
| 7 | |
| 6 | |
| 6 | |
| 5 | |
| 4 |