
- SAP Community
- Products and Technology
- Enterprise Resource Planning
- ERP Blogs by SAP
- Analytics on Universal Journal, the heart of SAP S...
Enterprise Resource Planning Blogs by SAP
Get insights and updates about cloud ERP and RISE with SAP, SAP S/4HANA and SAP S/4HANA Cloud, and more enterprise management capabilities with SAP blog posts.
Turn on suggestions
Auto-suggest helps you quickly narrow down your search results by suggesting possible matches as you type.
Showing results for
Product and Topic Expert
Options
- Subscribe to RSS Feed
- Mark as New
- Mark as Read
- Bookmark
- Subscribe
- Printer Friendly Page
- Report Inappropriate Content
09-24-2020
6:46 PM
Purpose of this blog
One of the simplest ways to enjoy the value in S/4HANA should be Analytics on the Universal Journal because:
- Universal Journal is the heart of S/4HANA, Single one truth. One of the main purposes of ERP is to integrate data among a company group, as ERP stands for “Enterprise Resource Planning”, and the most important data in S/4HANA is integrated into Universal Journal.
- Sophisticated analytics is possible in S/4HANA without BW, as S/4HANA is running on SAP HANA, a high performance in-memory database.
The purpose of this blog is to encourage analytics in S/4HANA by showing:
- Brief overview of analytics in S/4HANA
- The main data sources (Interface View) of Universal Journal for analytics.
- What kind of analytical queries can be created from the data source.
- What kind of analytical apps can be created from the analytical queries.
Functional experts are expected to create reports or analytical apps with Fiori and CDS View instead of classical reporting tools like Report Painter, ALV. See the Note 2579584, 2349297, etc.

The focuses of this blog are especially on
1) VDMs of the Interface Views for Universal Journal from which queries can be created,
2) Sophisticated calculations possible in Analytical Queries
because functional experts are expected to understand them for creating reports from Universal Journal,
Why?
Although technical experts tend to emphasize the frontend apps only, as many functional experts and experienced analytics experts would have already known, the importance is rather more in the backend, or data model. Functional expert should have already known data model (tables and what kind of data is stored in it), but might not know enough about VDM, the datasource for analytics, and Query (calculations to fill the business requirements).
Detail of Analytical app types is out of the scope of this blog.
- Expected output:
- Analytical apps based on Universal Journal in S/4HANA for Financial accounting, Management Accounting, Asset, Sales, Inventory, etc.
- Target readers:
- Finance and other functional experts
- Analytics experts
- Fiori Experts
My trial in this blog is to unleash the value of analytics by bridging between CDS View/Analytical app and data model, between technology and business, and between software vendor and consultant. In other words, I need your help, functional experts and consultants, to make analytics happen!
Summary
- Brief overview of Analytics in S/4HANA: It consists of 6 parts: HANA, Data Model Simplification, Virtual Data Model (VDM), Analytical apps or functions, Standard Fiori apps for analytics, Tools for creating analytical apps
- Consumption View and Interface View for VDM: VDM consists of Consumption View (Query) and Interface View (Data Source for transaction data and master data).
- VDMs of the Interface View for Universal Journal: Understanding of the VDMs of the Interface View for Universal Journal is essential for analytics in S/4HANA, as Consumption Views for many analytical apps can be created based on the them. It is the main focus of this blog.
- This blog focuses only on CUBE / DIMENSION View as Interface View, and Analytic Query as Consumption View created from CUBE / DIMENSION View.
- If BPC Optimized is NOT used, instead of standard Fiori Design Studio app for BPC Optimized, Multidi..., without using embedded BW Queries for BPC Optimized for S/4HANA.
- Analytic Query - Sophisticated Calculations: You can create custom Analytic Queries from the Interface View of VDMs for Universal Journal. Sophisticated calculations are possible in an Analytic Query. Not only Finance Accounting report, but the report for Sales, Inventory can be created. Thanks to the rich functionalities in an Analytic Query, sophisticated calculation is possible for reporting and analytical apps.
- Analytical app types: Many types of apps can be created, Fiori Design Studio, Fiori KPI apps, and SAC, Analysis Office, etc.. in addition.
- How to add fields to VDM? : You can add fields to VDMs with Fiori Custom Fields and Logic or Extend View. In addition, you can create CDS View with Fiori Custom CDS View.
Brief overview of analytics in S/4HANA:
Analytics in S/4HANA consists of 6 parts:
- HANA - High Performance DB: HANA overcomes the performance issue for analytical apps in S/4HANA.
- Data Model Simplification: Data Model is simplified and optimized for analytics. Data Model is de-normalized in Universal Journal, aggregation table and index tables are no longer needed.
- Most important data are integrated into Universal Journal. The reporting and analytics not only for financial accounting but management accounting, material ledger, asset accounting, and sales, inventory value is possible.
- Virtual Data Model (VDM): Templates of CDS Views for data models are provided, that is Virtual Data Model (VDM).
- Analytical functions: S/4HANA has sophisticated analytical functions for, e.g. Multidimensional analytics, and Dashboards, etc.
- Standard Fiori apps for analytics: S/4HANA has Standard Fiori apps for analytics and SAP Analytics Cloud (SAC) contents, e.g. Trial Balance, Journal Entry Analyzer.
- Tools for Analytics: Tools are provided to create objects like CDS Views and Fiori apps.

Example: How do they work in an analytical process?
With Standard Fiori app Trial Balance, you can enjoy multidimensional analytics (slicing, dicing and drill down, like pivot table in MS EXCEL) because:
1) runtime for data access is quite short thanks to HANA performance capability
2) data source is ACDOCA, de-normalized which for analytical process optimization (I believe it is more important than data volume reduction!)
3) Balance value for time series are calculated from delta values stored in ACDOCA within VDM (C_Trialbalanceq0001), so that you don’t have to develop the logic to calculate balance value yourself
4) rich functions for multidimensional analytics (slicing, dicing and drill down) is possible with Fiori Design Studio
5) Standard Fiori app F0996A Trial Balance are provided in which the VDM and the analytical Fiori app are included.

Example scenarios for Analytics:
- Use Standard Fiori apps for analytics
- Use VDM with Analysis Office
- Create Analytic Query based on VDM (Interface View) and use it in Query Browser or create Fiori Design Studio tile for the Analytic Query,
- Create Interface View as well as Consumption View (Analytic Query) and Fiori app.
- Use SAC content for S/4HANA, or create SAC app using VDM or custom CDS View/
The focus of this blog is to show the interface of Universal Journal for the third scenario; create Analytic Query based on VDM for Universal Journal.
Consumption View and Interface View for VDM
VDM consists of
- Consumption View: Query (Tech name: C_*)
- Interface View: Data source as transaction or master data for Consumption View (Tech name: I_*)
- Private View: Technical parts of Interface View or Consumption View. (Tech name: P_)
Example:

It is expected that functional and analytics experts understand the main VDM Interface Views for data models in S/4HANA because it is the foundation of analytical apps and reusable for many analytic queries. You can create custom analytical queries based on the VDM Interface View. There are Interface Views for Master data and transaction data. VDM Interface Views for master data is “associated” (a kind of JOIN) to Interface View for transaction data.
For those familiar with BW, the above can be compared to BW as follows, Consumption View is a BW Query, Interface View for Transaction data is an InfoProvider and Interface View for master data is an InfoObject.
Analytic Query is a kind of Consumption View in which Analytical Query is set to “true”, see this blog for further details (Analytic Query is set to true). It can be run like a BW Query, e.g. Transaction RSRT, or Analysis Office. It is the source of Fiori Design Studio. The Analytic Query name is used, which is “2C<SQL View of the Consumption View>”, e.g. 2CCFIPROFCTRQ2701 for CDS View C_ProfitCenterQ2701. Analytic Query must have the Interface View in which analytic data category is set to CUBE or DIMENSION.
“Development standard rule for analytics” in this blog:
The special assumptions of this blog are
- Consumption View is to be created from Interface View
- Consumption view should always be Analytic Query, so that the Interface View is CUBE or DIMENSION View (Analytic Data Category is set to DIMENSION or CUBE).
It is because of my “personal” simplification. It is not universal but my choice. In my opinion, they should be the development standard rule of the analytics at least in the initial phase, although it is technically possible to create Consumption View without Interface View, and Consumption View does not have to be Analytic Query technically. The reasons of this rule are
- Interface View should be prepared to be reused as data source for Consumption View like BW InfoProvider, at least for analytical apps,
- Analytic Query has richer analytical capabilities and BW expert can understand it easily because it is practically the same as BW Query, e.g. it can be run with Transaction RSRT.
(It is “my choice”, so I know some of you do not agree with me. Each expert should rather have their own belief. I know in reality there are standard analytical Fiori apps which do not follow those standards.)
See the blog to understand the structure of VDM for further detail.
See the blog to understand how to find the VDMs you want to use.
See the blog to understand the real state of Analytical app types in S/4HANA.
Notes:
- Officially, only “Released” VDM are reusable. See the blog on how to deal with unreleased VDM.
- Interface View officially consists of 2 types. Basic View and Composite View. Private View is not mandatory and created only if it is needed for technical reasons. No Private Views are released. But I think the categorization of Basic View, Composite View and Private View is not important.
VDMs of the Interface View for Universal Journal
Universal Journal:
Universal Journal – Single One Truth, the heart of S/4HANA, the most important data are integrated into S/4HANA. Universal Journal includes:
- General Ledger (FI-GL)
- Fixed Assets (FI-AA)
- Controlling (CO)
- Profitability Analysis or Margin Analysis (CO-PA)
- Profit Center Accounting (EC-PCA)
- Material Ledger (CO-PC-ACT)
In addition, many other business data are linked to data in Universal Journal, e.g. Sales Documents, Billing Documents, Goods movement documents and Stock Value.
Based on the simplified data model, the allocation process is also simplified with the Universal Journal (see this blog: Universal Allocation).
The reporting for Predictive Accounting (see this Blog: Predictive Accounting) is also based on the Universal Journal.
You can also enjoy Event Based Revenue Recognition only by filtering data in Universal Journal on "Bus. Transac. Type"(ACDOCA-BTTYPE) with "Event Based Revenue Recognitn (TBRR)".

The main tables of the Universal Journal:
- ACDOCA (Actual)
- ACDOCP (Plan)
Other than above, Consolidation Journal Entries are stored in ACDOCU in Group Reporting.
VDMs of the Interface View for Universal Journal:
Overview of the main VDMs of the Interface views for Universal Journal is below

Personal simplification: I removed some Interface Views for avoiding duplications.
- I_GLAccountLineItemCube: I think I_JournalEntryItemCube should be used in principle for G/L Account, not I_GLAccountLineItemCube, which is also for G/L Line Item based on ACDOCA. I_GLAccountLineItemCube includes technical balance carried forward items of period 000 but there are fewer fields. In many cases, the value of Period 000 is not needed.
- I_GLAccountLineItemSemTag / I_ActualPlanLineItemSemTag : I_GLAccountLineItemSemTag is for G/+ Line Item for actual data and I_ActualPlanLineItemSemTag for Plan (on ACDOCP) and Actual Data, and account value is aggregated with Semantic Tag. But aggregation is possible without Semantic tag, and it is more sophisticated to use two structures for account and version (Plan vs Actual) than to have all measures for actual and plan value in one structure.
Many of them are in SAP API Business hub.
| DDL Source | Data | Analytic Cube name | Source Table |
| I_GLAccountLineItemCube (Accounting Journal Entry Item Cube) | Actual data of GL Line Item (Amount/Debit Amount/Credit Amount for each currency amounts/Quantities). It provides less fields (300+) than I_JournalEntryItemCube. | 2CIFIGLLITMCUBE | ACDOCA |
| I_JournalEntryItemCube (LedgerGLLineItem) | Same as above. This view provides all details of a journal entry item (400+ fields), but Technical balance carried forward items of period 000 is not included. | 2CIFIDOCJRNLCUBE | ACDOCA |
| I_GLAcctBalanceCube (G/L Account Balance Cube) | Actual data of Financial Balance Amount (Amount/Debit Amount/Credit Amount/End Balance Amount for each currency amounts). it is expected to be used instead of FAGLFLEXT. | 2CIFIGLBALCUBE | ACDOCA |
| I_GLAccountLineItemSemTag (GL Account Line Item with Semantic Tag) | Actual data of GL Line Item (Amount/Debit Amount/Credit Amount for each currency amounts/Quantities/Measures for the groups of account (Revenue, Cost, Margin, etc.)). Prerequisite is to set the Semantic Tag*. | 2CIFIGLACCTLITST | ACDOCA |
| I_FixedAssetValueCube (Asset Balances Cube) | Asset balance | 2CIFASSETVALUECUBE | ACDOCA |
| I_FixedAssetAHSValueCube (Asset History Sheet Cube) | Asset History Sheet | 2CIASTAHSVALUECUBE | ACDOCA |
| I_Materialledgercube_Lit (Material Ledger Cube for Line Items) | Stock value and quantity can be calculated by summarizing all data in the past in this view. The custom Interface View has to be created based on this View in which analytic Data category is set to CUBE or DIMENSION. | 2CIMLCUBELIT | ACDOCA ACDOCD CKMLCR CKMLPP |
| I_ActualPlanJrnlEntryItemCube (Actual Plan Cube for Journal Entry Item) | Same as I_GLAccountLineItemCube but Plan data is included as well. | 2CIFIACTPLNJEIC | ACDOCA ACDOCP |
| I_ActualPlanLineItemSemTag (Actual&plan GL Account Line Item With Semantic Tag) | Same as I_GLAccountLineItemSemTag but Plan data is included as well. | 2CIFIAPGLACCTLITST | ACDOCA ACDOCP |
| I_WorkCenterProdCostCube (Production Cost By Work Center) | Actual and Plan data of Fixed Cost / Variable Cost / Quantity) | 2CIFIWCPRODCSTCUB | ACDOCA ACDOCP |
| I_GLIncgSalesOrdPrdtvCube (Incoming Sales Orders – Pred. Accounting) | Predicted revenues, cost of sales, margins, and sales deductions based on incoming sales orders. | 2CIFGLISOPRCUBE | ACDOCA VBAK |
- Analytic Cube: The Interface View as the source of Analytic Query. The name is “2C<SQL View name>”. By adding “!”, It works as Analytic Query, e.g. “!2CIFIGLLITMCUBE”.
- When you have the performance issue on I_GLAcctBalanceCube, there are 2 workarounds.
- If time point based balance is enough, and time series is not needed, you can create query for balance based on I_GLAccountLineItemCube.
- You can add quantity as well as amount when creating time point based balance query from I_GLAccountLineItemCube. See Stock Value and Quantity Query to study how to create the balance value.
- You can create the Calculation Measure not only for current period, but previous period, previous year, etc.. See B/S Current vs previous year by period Query for reference,
- If time series finance balance report is needed but monthly is enough and daily report is not needed, consider using Period Based Balance. See SAP Note 2663199 for further detail.
- If time point based balance is enough, and time series is not needed, you can create query for balance based on I_GLAccountLineItemCube.
- Plan data in ACDOCP: In I_ActualPlanJrnlEntryItemCube, I_ActualPlanLineItemSemTag and I_WorkCenterProdCostCube, the plan data in ACDOCP is used, so that Plan data would not be provided if ACDOCP is not used.
- Analytical apps for Event Based Revenue Recognition can be created based on I_JournalEntryItemCube and I_GLAcctBalanceCube by filtering data on "Bus. Transac. Type"(ACDOCA-BTTYPE) with "Event Based Revenue Recognitn (TBRR)".
- Semantic Tag: Semantic Tag is for creating calculated measures in which the values of the hierarchy account nodes on Financial Statement Version (FSV) are aggregated, e.g. measure of “Billed Revenue”, “COGC - Fixed”. Prerequisite is to set Semantic Tag in Customizing (Transaction SPRO). See SAP Note 2841880.

Consumption Views based on the VDM Interface View for Universal Journal:
| DDL Source | Analytic Cube name | DDL Source | Analytic Query name | Fiori ID | Transaction |
| I_JournalEntryItemCube (Accounting Journal Entry Item Cube) | 2CIFIDOCJRNLCUBE | C_ServiceOrderQry2401 (Service Orders - Actuals) | 2CCFISERVORDQ2401 | ||
| C_SalesOrderQ2301 (Sales Orders - Actuals) | 2CCFISALESORDQ2301 | KKBC_KUN | |||
| C_ProjectQ2201 (Projects - Actuals) | 2CCFIPROJECTQ2201 | ||||
| C_ProfitCenterQ2701 (Profit Centers - Actuals) | 2CCFIPROFCTRQ2701 | KE80 | |||
| C_ProfitAndLossQ2901 (P&L - Actuals) | 2CCFIPROFLOSSQ2901 | S_ALR_87012284 | |||
| C_MarketSegmentQ2501 (Market Segments - Actuals) | 2CCFIMARKSEGMQ2501 | KE30 | |||
| C_FunctionalAreasQ2801 (Functional Areas - Actuals) | 2CCFIFAQ2801 | ||||
| C_CostCenterQ2001 (Cost Centers - Actuals) | 2CCFICOSTCTRQ2001 | S_ALR_87013611 | |||
| I_GLAcctBalanceCube (G/L Account Balance Cube) | 2CCFITRIALBALQ0001 | C_Trialbalanceq0001 (Trial Balance) | 2CCFITRIALBALQ0001 | F0996A | FAGLB03 |
| I_ActualPlanJrnlEntryItemCube (Actual Plan Cube for Journal Entry Item) | 2CIFIACTPLNJEIC | C_ProjectPlanActQ2203 (Projects - Baseline/EAC/Ongoing) | 2CCFIPROPLACTQ2203 | ||
| C_ProjectPlanActQ2201 (Project - Plan/Actual) | 2CCFIPRPLANACT2201 | S_ALR_87013532 | |||
| C_ProfitCenterPlanActQ2701 (Profit Center - Plan/Actual) | 2CCFIPCPLANACT2701 | KE30 | |||
| C_ProfitAndLossPlanActQ2903 (P&L - Plan/Actual) | 2CCFIPLPLANACT | S_ALR_87012284 | |||
| C_MarketSegmentPlanActQ2501 (Market Segment - Plan/Actual) | 2CCFIMSPLANACT2501 | KE30 | |||
| C_InternalOrderPlanActQ2101 (Internal Order - Plan/Actual) | 2CCFIIOPLANACT2101 | S_ALR_87012993 | |||
| C_FunctionalAreaPlanActQ2801 (Functional Area - Plan/Actual) | 2CCFIFAPLANACT2801 | F1584A | |||
| C_CostCenterPlanActQ2001 (Cost Center - Plan/Actual) | 2CCFICCPLANACT2001 | S_ALR_87013611 | |||
| I_APJrnlEntrItmAgingGrid (Aging grid of journal entry view of Accounts Payables) | 2CIAPJEITMAGGRID | C_APJrnlEntrItmAgingGrid | 2CCAPJEITMAGGRID | ||
| I_FixedAssetValueCube (Asset Balances Cube) | 2CIFASSETVALUECUBE | C_FixedAssetBalance (Asset Balances) | 2CCFASSETBAL | F1617A | AR01 |
| I_FixedAssetAHSValueCube (Asset History Sheet Cube) | 2CIASTAHSVALUECUBE | C_FixedAssetHistorySheet (Asset History Sheet) | 2CCFASSETHISTSHEET | F1615A | AR02 |
| I_GLIncgSalesOrdPrdtvCube (Incoming Sales Orders – Pred. Accounting) | 2CIFGLISOPRCUBE | C_GLIncgSalesOrdPrdtvQuery | 2CCFGLISOPRQUERY | ||
| I_WorkCenterProdCostCube (Production Cost By Work Center) | 2CIFIWCPRODCSTCUB | C_WorkCenterProdCostQuery (Production Cost By Work Center) | 2CCFIWCPRODCSTQRY | ||
| I_GLAccountLineItemCube (Accounting Journal Entry Item Cube) | 2CIFIGLLITMCUBE | C_GLLineItemsQ0001 (Journal Entry Analyzer) | 2CCFIGLLITMQ0001 | F0956A | |
| I_GLAccountLineItemSemTag (GL Account Line Item with Semantic Tag) | 2CIFIGLACCTLITST | C_Profitability_Q0001 (Project Profitability) | 2CCFIPROFQ0001 | ||
| C_Profitability_Q0002 (Product Profitability) | 2CCFIPROFQ0002 | ||||
| C_CashFlowIndirectIFRS (Display Cash Flow Statement Indirect IFRS) | 2CCFICSHFLINDIFRS | F3076 | |||
| I_ActualPlanLineItemSemTag (Actual&plan GL Account Line Item With Semantic Tag) | 2CIFIAPGLACCTLITST | C_FinancialStatementKPI (KPIs based on Financial Statements) | 2CCFIFINSTMTKPI |
“Transaction” is the SAP Transaction which had worked as the same function as the corresponding Consumption View, e.g. Instead of Transaction KE30, C_ProfitCenterPlanActQ2701 (2CCFIPCPLANACT2701) can be used in S/4HANA.
It might be the cases that th fields you want to use in the Consumption View would be missed but they are in the Interface View, please check if you can add fields in the Standard VDM Consumption View with Custom Fields and Logic and Data Source Extension.
Alternative Analytic Queries to the sources of the standard Fiori apps for BPC Optimized for S/4HANA:
In the standard Fiori apps for BPC optimized for S/4HANA, BW Queries are used (Component CO-OM-IS). The BWQueryName for the app is started with /ERP, not 2CC. Alternative standard Analytic Queries to those BW Queries are provided. In Plan vs Actual queries of those Analytic Queries, planning data is read from ACDOCP, not real-time InfoCube. If BPC Optimized for S/4HANA is NOT used or ACDOCP is used as the source of planning data in BPC Optimized for S/4HANA, it is recommended to create custom Fiori Design Studio apps using those alternative Analytic Queries instead of those standard Fiori apps for BPC Optimized for S/4HANA. See the Note 2535903 for further detail. By skipping BW Objects,e.g. BW Query, you can create any analytical apps only with CDS View technology, e.g. you don’t have to consider BW Analysis Authorization for BW Query as well as DCL for CDS View. See the blog to create the tile for multidimensional reporting app.
Below is the mapping between the standard Fiori apps and the alternative Analytic Queries.
| Fiori ID | Text | Query Name | Alternative Analytic Query | CDS View name |
| F1582B | Sales Orders - Actuals | /ERP/SFIN_V01_Q2301 | 2CCFISALESORDQ2301 | C_SalesOrderQ2301 |
| F0942A | Projects - Actuals | /ERP/SFIN_V01_Q2201 | 2CCFIPROJECTQ2201 | C_ProjectQ2201 |
| F0944A | Profit Centers - Actuals | /ERP/SFIN_V01_Q2701 | 2CCFIPROFCTRQ2701 | C_ProfitCenterQ2701 |
| F0945A | P&L - Actuals | /ERP/SFIN_V01_Q2901 | 2CCFIPROFLOSSQ2901 | C_ProfitAndLossQ2901 |
| F0943A | Market Segments - Actuals | /ERP/SFIN_V01_Q2501 | 2CCFIMARKSEGMQ2501 | C_MarketSegmentQ2501 |
| F1583B | Functional Areas - Actuals | /ERP/SFIN_V01_Q2801 | 2CCFIFAQ2801 | C_FunctionalAreasQ2801 |
| F0940A | Cost Centers - Actuals | /ERP/SFIN_V01_Q2001 | 2CCFICOSTCTRQ2001 | C_CostCenterQ2001 |
| F0936A | Project - Plan/Actual | /ERP/SFIN_M01_Q2202 | 2CCFIPRPLANACT2201 | C_ProjectPlanActQ2201 |
| F0926A | Profit Center - Plan/Actual | /ERP/SFIN_M01_Q2502 | 2CCFIPCPLANACT2701 | C_ProfitCenterPlanActQ2701 |
| F0927A | P&L - Plan/Actual | /ERP/SFIN_M01_Q2901 | 2CCFIPLPLANACT | C_ProfitAndLossPlanActQ2903 |
| F0948A | Market Segment - Plan/Actual | /ERP/SFIN_M01_Q2501 | 2CCFIMSPLANACT2501 | C_MarketSegmentPlanActQ2501 |
| F0948A | Internal Order - Plan/Actual | /ERP/SFIN_M01_Q2102 | 2CCFIIOPLANACT2101 | C_InternalOrderPlanActQ2101 |
| F0949A | Cost Center - Plan/Actual | /ERP/SFIN_M01_Q2002 | 2CCFICCPLANACT2001 | C_CostCenterPlanActQ2001 |
How to find and evaluate VDM?
It is explained in this blog.
The easiest way for running Analytic Query is transaction RSRT with which you can run the Analytic Query like a BW Query.
You can find which attributes and measures an Analytic Cube has with transaction RSRTS_ODP_DIS.
Use ADT (ABAP Development Tools), to understand internal design of CDS Views. See “Options to find a CDS View” section in the blog above. You can open the definition of CDS View in SAPGUI as well.
Analytic Query - Sophisticated Calculations
- Queries for many application areas (Finance, Sales, Stock, etc.) can be created from the VDM for Universal Journal with Fiori Custom Analytical Queries, ADT or BW Query.
- Sophisticated calculations are possible in Analytic Query, which functional experts are expected to understand as well.
This page explains detail about the calculations possible in Analytic Query.
Below are the sample queries to show those 2 points.
| Report | Interface View | Tool |
| P/L Actual Query | I_JournalEntryItemCube | Custom Analytical Queries |
| Sales/Gross Profit Plan vs Actual Query | I_ActualPlanJrnlEntryItemCube | Custom Analytical Queries |
| Stock Value and Quantity Query | I_Materialledgercube_Lit | Custom Analytical Queries |
| B/S Current vs previous year by period Query | I_GLAcctBalanceCube | ABAP Development Tools |
| Sales/Gross Profit Monthly Cumulated Query | I_JournalEntryItemCube | BW Modeling Tools* |
- BEX Query Designer could be used technically as well, but it officially not supported in newer version of S/4HANA.
P/L Actual Query:
Source: I_JournalEntryItemCube
Created with: Custom Analytical Queries
Queries for finance report can be created in which Set hierarchy can be used in Analytic Query.

Row: G/L Account – hierarchy YCOA is activated.
Column: Year Month, Measure (Amount in CC Crcy)
Free: Material Group, Sales Document, Chart of Account, Company Code, Ledger, Posting Date
- Hierarchy: Set Hierarchy defined in S/4HANA can be used in Analytic Query. It can be set to be displayed by default as well as selected manually after running the query. Internally the set hierarchy data has to be replicated to hierarchy tables for CDS Views (HRRP*) with transaction HRY_REPRELEV and HRRP_REP. Custom Hierarchy can be created as well with Manage Global Accounting Hierarchies.
In Custom Analytical Queries, Hierarchy YCOA is set to be used in G/L Account.

For filtering on Posting Date, Date Function “YEARTODATE” is used.

In the value help of Default Value of User Input Values for Posting date, Date Functions defined with Date Function can be selected.

As a result, Date from/Date To are proposed in the prompt after running the query.

Sales/Gross Profit Plan vs Actual Query:
Source: I_ActualPlanJrnlEntryItemCube
Created with: Custom Analytical Queries
Plan vs Actual report for finance can be created from I_ActualPlanJrnlEntryItemCube.
The second Characteristic structure (Sales/Cost/Gross Profit) is created. The structure consists of restricted or calculated elements.
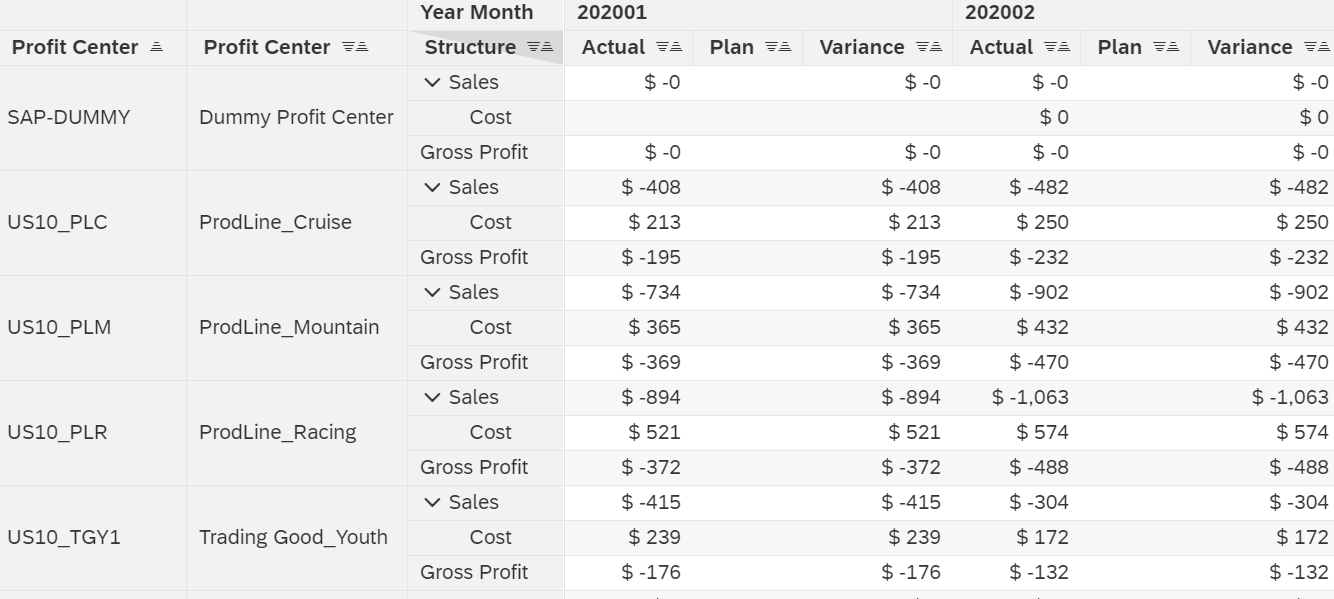
Row: Profit Center, Characteristic Structure (Sales/Cost/Gross Profit)
Column: Year Month, Measure Structure (Actual/Plan/Variance)
Free: Company Code, Sales Document, Sales Document Item, Product, Posting Date.
Key/Text:
In Analytic Query, Key and Text are grouped and work together, and you can select the display option (Text/Key/Text and key/Key and Text).

Structures:
- The Measure structure “measure”:
- Actual (restricted on Plan Category with “ACT01”)
- Plan (restricted on Plan Category with input parameter “Plan Category”)
- Variance (Calculation: Actual – Plan)
- The Characteristic structure “Structure”
- Sales (restricted on CoA with “YCOA” and on G/L Account with “41000000” and “44002000”)
- Cost (restricted on CoA with “YCOA” and on G/L Account with “51100000” and 51600000”), set to be the child of “Sales”.
- Gross Profit (Calculation: Sales + Cost).
Definition of Characteristic Structure and Measure Structure in Custom Analytical Queries. Characteristic Structure is created additionally. (Please note that the Analytic Query with Characteristic structure cannot be exposed as OData Service).
For creating the second structure, in Custom Analytical Queries,
go to display tab
select Add > Add Characteristic Structure Element

Created the second Characteristic Structure and elements.

Definition:
Restricted Measure “Sales” in Measure Structure:
Restricted on Plan Category with “ACT01”.

Restricted Measure “Plan” in Measure Structure:
Restricted on Plan Category with User Input Parameter “Plan Category”. Users can then select the appropriate “Plan Category” with the input prompt window at report execution.

Calculated Measure “Variance” in Measure Structure (Actual – Plan):

Restricted Element “Sales” in Characteristic Structure:
Restricted on Chart of Account with “YCOA” and on G/L Account with “41000000” and “440020000”.

Restricted Element “Cost” in Characteristic Structure:
Restricted on Chart of Account with “YCOA” and on G/L Account with “51100000” and “560000000”.
It is set to be displayed as hierarchy and the parent is set to be “Sales”.

Calculated Element “Gross Profit” in Characteristic Structure (Sales – Cost):

Stock Value and Quantity Query:
Source: I_Materialledgercube_Lit
Created with: Custom Analytical Queries
Stock Value report can be created from I_Materialledgercube_Lit.
Stock value and quantity at input key date and “Compared To” date are displayed. As only delta value and quantity are retrieved from I_Materialledgercube_Lit (as the source is mainly ACDOCA), to get the stock value and quantity, all value and quantity =< input posting date has to be aggregated.

Prompt:
Today for “Key Date” and the last day of the previous month for “Compared To” are proposed, and you can change the date.

Restricted measure “Amt Key Date” is created in which the Amount =< Input Value “Key Date” are aggregated (filtering on Posting Date).

Definition of Amt ComparedTo, in which the input value is “ComparedTo”.

For proposing the input value on ComparedTo, the End date of the Date Function “PREVIOUSMONTH” is used. PREVIOUSMONTH is range, not single value, but the end value canbe used for the default value of the input parameter.

B/S Current vs previous year by period Query:
Source: I_GLAcctBalanceCube
Created with: ABAP Development Tools
I_GLAcctBalanceCube provides balance value for the amount by time period. Balance Value is calculated automatically within this view.
In CDS View created with ADT, you can create custom loolup entry to retrieve values for parameters.
Prompt:

Result:

Row: G/L Account (Hierarchy with
Column: Fiscal Period, Measures (Fiscal Year, Previous Y ear)
Free: Company Code Crcy, Ledger, Profit Center
Filter: Ledger, Company Code (P_Company), Fiscal Year (P_FiscalYear) to iuput, Fiscal Year variant(P_FYVariant), Start Date of previous Fiscal Year (P_FromPostingDate) and End of Fiscal Year (P_ToPostingDate), and Previous Year (P_PreviousFyscalYear) for which the values are derived using lookup entries. Data is filtered with Ledger and Company in the query.
Structures:
- The Measure structure “measure”:
- FiscalYear (restricted on FiscalYear with parameter P_FiscalYear)
- PrevFiscalYear (restricted on FiscalYear with parameter P_PreviousFiscalYear)
- Variance (Calculation: FiscalYear and PrevFiscalYear)
Parameter values are derived using Lookup Entry:
The values are input on Ledger, Company Code (P_Company), Fiscal Year (P_FiscalYear) in the Prompt. This is the reason why ADP is used to create the query. Custom Lookup Entry is available only with ADT.
Fiscal Year Variant value (parameter: P_FYVariant) is derived from Company Code using I_Company Code (P_Company)
Start date of the previous Fiscal Year (P_FromPostingDate) is derived from Fiscal Year Variant Value (P_FYVariant) and Fiscal Year Value (P_FiscalYear)/ using custom View ZI_PREVFY.*
End date of the Fiscal Year (P_ToPostingDate) is derived from Fiscal Year Variant Value (P_FYVariant) and Fiscal Year Value (P_FiscalYear) using custom View I_FiscalYear.*
Previous Fiscal Year (P_PreviousFiscalYear) is derived from Fiscal Year Variant Value (P_FYVariant) and Fiscal Year Value (P_FiscalYear) using custom View ZI_PREVFY.*

*ZI_PREVFY uses I_FiscalCalendarDtePrevPeriods which has start and end date of Fiscal Year and Previous Fiscal Year, and Fiscal Year, Previous Year, as a source. Only one record in each Fiscal Year is selected in ZI*_PREVFY to avoid duplication of the derived value.
Exceptional Aggregation:
“LAST VALUE” is used to aggregate the data instead of “SUM”. In the Total of the table above, the same values as those in Period 16 is displayed because they are value and quantity for stock, so that it is inappropriate to summarize the values of the periods, but “Last” values should be displayed.
In the following table, “Fiscal Period” is removed, so the values and quantities in the periods are aggregated. Not summary, but Exceptional Aggregation LAST is used for aggregation.
Exceptional Aggregation can be created also with Custom Analytical Queries.

Source of Analytic Query:
@AbapCatalog.preserveKey: true

@AbapCatalog.compiler.compareFilter: true

@AbapCatalog.sqlViewName: 'ZCCAQ1030'

@EndUserText.label: 'Trial Balance'

@VDM.viewType: #CONSUMPTION

@Analytics.query: true

@AccessControl.authorizationCheck: #PRIVILEGED_ONLY

@ClientHandling.algorithm: #SESSION_VARIABLE

@AbapCatalog.buffering.status: #NOT_ALLOWED

@Metadata.ignorePropagatedAnnotations: true

define view ZC_CAQ1030

with parameters

    P_Company   : bukrs,

    P_FiscalYear: fis_gjahr,

    @Consumption.hidden: true

    @Consumption.derivation: { lookupEntity: 'I_CompanyCode',

    resultElement: 'FiscalYearVariant', binding: [

    { targetElement : 'CompanyCode' , type : #PARAMETER, value : 'P_Company' } ]}

    P_FYVariant: periv ,

    @Consumption.hidden: true

    @Consumption.derivation: { lookupEntity: 'ZI_PREVFY',

    resultElement: 'PreviousFiscalYearStartDate', binding: [

    { targetElement : 'FiscalYear' , type : #PARAMETER, value : 'P_FiscalYear'}

    ,    { targetElement : 'FiscalYearVariant' , type : #PARAMETER, value : 'P_FYVariant' }]}

    P_FromPostingDate   : fis_budat_to,

    @Consumption.hidden: true

    @Consumption.derivation: { lookupEntity: 'I_FiscalYear',

    resultElement: 'FiscalYearEndDate', binding: [

    { targetElement : 'FiscalYear' , type : #PARAMETER, value : 'P_FiscalYear'}

    ,    { targetElement : 'FiscalYearVariant' , type : #PARAMETER, value : 'P_FYVariant' }]}

    P_ToPostingDate : fis_budat_to,

    @Consumption.hidden: true

    @Consumption.derivation: { lookupEntity: 'ZI_PREVFY',

    resultElement: 'PreviousFiscalYear', binding: [

    { targetElement : 'FiscalYear' , type : #PARAMETER, value : 'P_FiscalYear'}

    ,    { targetElement : 'FiscalYearVariant' , type : #PARAMETER, value : 'P_FYVariant' }]}

    P_PreviousFiscalYear: fis_gjahr

as select from I_GLAcctBalanceCube

( P_FromPostingDate: $parameters.P_FromPostingDate, P_ToPostingDate: $parameters.P_ToPostingDate ) as I_GLAcctBalanceCube

{

@Consumption.filter: {selectionType: #SINGLE, multipleSelections: false, mandatory: true}

@Consumption.derivation: { lookupEntity: 'I_LedgerStdVH',

      resultElement: 'Ledger', binding: [

      { targetElement : 'IsLeadingLedger' , type : #CONSTANT, value : 'X' } ]}

 @AnalyticsDetails.query.variableSequence : 10

Ledger,

@AnalyticsDetails.query.axis:#COLUMNS

FiscalPeriod,

@AnalyticsDetails.query.axis:#ROWS

@AnalyticsDetails.query.displayHierarchy: #ON

@AnalyticsDetails.query.hierarchyInitialLevel: 7

@AnalyticsDetails.query.display: #TEXT

@AnalyticsDetails.query.hierarchyBinding : [

{type :#CONSTANT,value :'1099'}]

GLAccount,

@AnalyticsDetails.query.display: #KEY_TEXT

ProfitCenter,

CompanyCodeCurrency,

@AnalyticsDetails.query.axis: #COLUMNS

@EndUserText.label: 'FiscalYear'

@DefaultAggregation: #FORMULA

@Semantics.amount.currencyCode: 'CompanyCodeCurrency'

@AnalyticsDetails: {

        exceptionAggregationSteps: [{ exceptionAggregationBehavior : #LAST,

                                      exceptionAggregationElements: ['FiscalPeriodDate']

                                   }]}

@AnalyticsDetails.query.formula : '$projection.IntmdEndingBalAmtInCCCrcyFY' cast( cast( 1 as abap.dec(23,2)) as fis_end_bal_hsl_ui ) as EndingBalanceAmtInCoCCCrcyFY,

@AnalyticsDetails.query.axis: #COLUMNS

@EndUserText.label: 'PrevFiscalYear'

@DefaultAggregation: #FORMULA

@Semantics.amount.currencyCode: 'CompanyCodeCurrency'

@AnalyticsDetails: {

        exceptionAggregationSteps: [{ exceptionAggregationBehavior : #LAST,

                                      exceptionAggregationElements: ['FiscalPeriodDate']

                                   }]}

@AnalyticsDetails.query.formula : '$projection.IntmdEndingBalAmtInCCCrcyPY' cast( cast( 1 as abap.dec(23,2)) as fis_end_bal_hsl_ui ) as EndingBalanceAmtInCCCrcyPY,


@AnalyticsDetails.query.axis: #COLUMNS

@EndUserText.label: 'Var'

@DefaultAggregation: #FORMULA

@Semantics.amount.currencyCode: 'CompanyCodeCurrency'

@AnalyticsDetails.query.formula : '$projection.IntmdEndingBalAmtInCCCrcyFY - $projection.IntmdEndingBalAmtInCCCrcyPY' cast( cast( 1 as abap.dec(23,2)) as fis_end_bal_hsl_ui ) as Variance,


// Hidden fields

@Consumption.hidden: true

@AnalyticsDetails.query.axis: #COLUMNS

@DefaultAggregation: #SUM

@Semantics.amount.currencyCode: 'CompanyCodeCurrency'

case when FiscalYear = $parameters.P_FiscalYear then EndingBalanceAmtInCoCodeCrcy else 0 end

as IntmdEndingBalAmtInCCCrcyFY,

@Consumption.hidden: true

@AnalyticsDetails.query.axis: #COLUMNS

@DefaultAggregation: #SUM

@Semantics.amount.currencyCode: 'CompanyCodeCurrency'

case when FiscalYear = $parameters.P_PreviousFiscalYear then EndingBalanceAmtInCoCodeCrcy else 0 end

as IntmdEndingBalAmtInCCCrcyPY

}

where CompanyCode = $parameters.P_Company

and FiscalYearVariant = $parameters.P_FYVariant
ZI_PREVFY
@AbapCatalog.preserveKey: true

@AbapCatalog.sqlViewName: 'ZIPREVFY'

@AbapCatalog.compiler.compareFilter: true

@ClientHandling.algorithm: #SESSION_VARIABLE

@Metadata.ignorePropagatedAnnotations: true

@VDM.viewType: #COMPOSITE

@ObjectModel.usageType.serviceQuality: #D

@ObjectModel.usageType.sizeCategory: #L

@ObjectModel.usageType.dataClass: #CUSTOMIZING

@AccessControl.authorizationCheck: #NOT_REQUIRED

@ObjectModel.representativeKey: 'CalendarDate'

@Analytics: { dataCategory: #DIMENSION }

@EndUserText.label: 'Previous Fiscal Year'

define view ZI_PREVFY as select from I_FiscalCalendarDtePrevPeriods {

 key FiscalYearVariant,

 key CalendarDate,

 FiscalYear,

 FiscalYearStartDate,

 FiscalYearEndDate,


 ~(omitted)~


 PreviousFiscalPeriodStartDate,

 PreviousFiscalPeriodEndDate,

 PreviousFiscalYear,

 PreviousFiscalYearStartDate,

 PreviousFiscalYearEndDate,


 ~(omitted)~


}

where FiscalYearStartDate = CalendarDate
Sales/Gross Profit Monthly Cumulated Query:
Source: I_JournalEntryItemCube
Created with: BW Modeling Tools (BW-MT)
It is possible to create BW Query on top of CDS CUBE View. In BW Query, many more sophisticated calculations are possible. Note that DCL is used for authorization even when creating BW Query, as the datasource is CDS View.

Row: Year Month
Column: Measure Structure Sales/GP (Sales/Cost/Gross Profit/%/Sales Cumulated/Cost Cumulated/Gross Profit Cumulated)
Free: Company Code Crcy, Ledger, Profit Center
Filter: Ledger, CompanyCode, Year Month
Structures:
- The Characteristic structure “Sales/GP”
- Sales (restricted on CoA with “YCOA” and on G/L Account with Hierarchy Node YCOA/20_CE), sign is reversed.
- Cost (restricted on CoA with “YCOA” and on G/L Account with Hierarchy Node YCOA/10_CE), set to be the child of “Sales”.
- Gross Profit (Calculation: -Sales - Cost).
- % (- Gross Profit A% Sales)
- Sales Com (Copied from Sales and set to be Cumulated)
- Cost Cumulated (Copied from Cost and set to be Cumulated)
- Gross Profit Cumulated (Copied from Gross Profit and set to be Cumulated)
- Sign is set to be reversed.

it will be available also in Custom Analytical Queries as of S/4HANA2020.
- “%A” is available for calculated measure “%”. It is for calculating rate.

- Sales Cumulated, Cost Cumulated and Gross Profit Cumulated are set to be “Cumulated”.

- Access type for Result value on Year Month is set to be “Master Data”.

Result
- Sign of “Sales” is displayed as plus value (e.g. -5112.52), although in the system, the sales values (Credit) are stored as minus value
- % is added for the profitability rate (%) as below.
- The value of Sales Cumulated, Cost Cumulated and Profit Center Cumulated are cumulated by the attributes as below, e.g. value of Cost Cumulated in Year Month 201902 is 3611.60 (= 2250.44 + 1361.16).
- In 201904 and 201908, no records are there, but added because Year Month master has those values. Hierarchy node can be used to filter value

- Below is the definition of the restricted measure “Sales” in which hierarchy node of G/L Account YCOA/09 is used to filter data.

| Tools | Functionality | UI: Easy to use | SAP's direction | Other limitations |
| Custom Analytical Queries | + | ++ (Fiori Based) | +++ | - Only for released CDS View. |
| ADT | ++ | + (Script) | ++ | - Unavailable for S/4HANA Cloud ES. |
| BW-MT | +++ | +++ (Eclipse based ) | + | - Unavailable for S/4HANA Cloud ES. - Queries are not listed in Query Browser. - Tech name of fields would be changed when changing the settings in CDS View. |
Which tool is the recommendation?
The answer would be different by experts. As SAP’s employee, the recommendation is Custom Analytical Queries. But as a consultant, I cannot avoid recommending BW-MT (modelling tools).
Custom Analytical Queries, I think, is not a bad tool. It keeps good balance between functionality and usability. Except lookup entry to derive default value, basic requirements could be filled. Functional experts would not feel difficulties using the tool. But some developers might believe would scripting modeling would be better, as copy and paste is possible, so they could create queries once they learn annotations.
But I, as a consultant, would rather like to use BW-MT, as some typical requirements could not be realized without the functionalities in BW. Without creating query with BW-MT, I have to pay more effort on discussion with customers which may result in some compromising. The BW Query cannot be used in Query Browser and tech name of the fields would be changed, but I think they are minor limitations so not difficult to overcome.
Analytical app types
Other than Fiori Design Studio or WebDynpro Grid, Analytical Query or BW Query can be used in many tools, Analysis office, OData based Analytical Fiori apps, SAC Story and Analytics Designer.
Example apps in this blog.
- Analysis Office
- KPI app
- Analytical List Report
See the section to understand more about the analytical apps, and this section is about the tools to create apps.
FYI: The Blog on Hands-on for KPI app.
Analysis Office:
With Analysis Office, OLAP navigations (slice, dice and drill down like MS Excel pivot table) are possible. The experience is similar to Fiori Design Studio, but it is functionally richer. In the following hardcopy, P/L Actual Query (the first example in this blog) is used in Analysis Office.
AO is included also in SAC license, but the connection is via SAC in the case.
in the following case, P/L Actual Query is used.

Fiori KPI app:
in the following app, Sales/Gross Profit Monthly Cumulated Query is used so the value is cumulated by month.

Analytical List Report:

For OData based Fiori apps, Analytic Query or BW Query must be published as OData Service. OData based Fiori apps includes KPI apps, Analytical List Report (created with Manage KPIs and Reports), Fiori Elements apps (List Report, Overview Page, etc.). Analytic Query created with Custom Analytical Queries has been published, and “@OData.publish: true” has to be added for CDS View created with ADT. BW Query has a flag to publish it as OData Service. After adding it as service with Transaction /IWFND/MAINT_SERVICE, it is available for those OData based apps.
How to add fields to VDMs?
For adding fields in the VDM Interface View, you have the following options:
- Use Custom Fields and Logics to add fields to standard VDMs or OData and underlying table without changing the view or OData names with graphical tools. It is also possible to add fields already been added in Universal Journal tables. It is easy to do but is not available for all objects.
- See SAP Note 2453614 FAQ: Universal Journal Extensibility for Universal Journal/
- Data Source Extension in Custom Fields and Logic can add the fields in the associated view.
- e.g. Custom Field “Product Category” is added to the Business Context Profit Center, Then this fields can be added to G/L Account Line Items Cube (G/L Account Line Items Cube) and Journal Entry Analyzer (C_GLLINEITEMSQ0001).
- The data of the Custom Fields in Profit Center and Cost Center can be uploaded from file using Manage Flexible Hierarchies.
- Use Extend View to add fields to VDMs without changing view name. It is possible to associate CDS View or table to add fields in it with Extend View. It may take some time for the activation to occur. When associating the view/table, the relationship between the source and associated view has to be n:1. (cardinality cannot be [..*].
- use Annotate View to change annotations, e.g. change the label name.
- target annotation: UI, EnduserText, Consumption.
- In the target view, metadata extension must be allowed: @Metadata.allowExtensions:true
- Create Custom CDS View on top of the VDMs (Wrapping View)
- Fiori “Custom CDS Views” is provided to create Custom CDS View. But the target is only released CDS View and what is possible is to associate released VDMs and add fields in them to the custom CDS View.
- You can create custom CDS View based on the VDMs as you like with ADT. You can do anything like JOIN, UNION, adding annotation, etc..
For adding the database fields as well as VDM, the almost only option should be Custom Fields and Logics. For adding the fields from other views or tables, if you do not want to change the view name (as you plan to use standard Fiori apps), Extend View should be the only way. But if it is okay to change the name, you can adjust the view more flexibility by creating custom CDS View with ADT.
I want you financial and functional experts to make analytics happening and create practical values in S/4HANA.
Thanks!
Labels:
31 Comments
You must be a registered user to add a comment. If you've already registered, sign in. Otherwise, register and sign in.
Labels in this area
-
Artificial Intelligence (AI)
1 -
Business Trends
363 -
Business Trends
23 -
Customer COE Basics and Fundamentals
1 -
Digital Transformation with Cloud ERP (DT)
1 -
Event Information
461 -
Event Information
24 -
Expert Insights
114 -
Expert Insights
158 -
General
1 -
Governance and Organization
1 -
Introduction
1 -
Life at SAP
415 -
Life at SAP
2 -
Product Updates
4,684 -
Product Updates
218 -
Roadmap and Strategy
1 -
Technology Updates
1,502 -
Technology Updates
89
Related Content
- How to reset task status in data monitor. in Enterprise Resource Planning Q&A
- S4 HANA Cost Center Activity Rate Calculation Hybrid Approach in Enterprise Resource Planning Blogs by Members
- Readiness for Universal Parallel Accounting in Enterprise Resource Planning Blogs by SAP
- SAP Fiori for SAP S/4HANA – Upgrade Faster – Managing app lifecycle impacts on users in Enterprise Resource Planning Blogs by SAP
- Accruals Management - Purchase Order Accruals and Deferrals in Enterprise Resource Planning Blogs by SAP
Top kudoed authors
| User | Count |
|---|---|
| 13 | |
| 11 | |
| 10 | |
| 7 | |
| 7 | |
| 6 | |
| 5 | |
| 4 | |
| 4 | |
| 4 |