
- SAP Community
- Products and Technology
- Technology
- Technology Blogs by SAP
- SAC Planning - Toggle table values with a mouse cl...
Technology Blogs by SAP
Learn how to extend and personalize SAP applications. Follow the SAP technology blog for insights into SAP BTP, ABAP, SAP Analytics Cloud, SAP HANA, and more.
Turn on suggestions
Auto-suggest helps you quickly narrow down your search results by suggesting possible matches as you type.
Showing results for
Product and Topic Expert
Options
- Subscribe to RSS Feed
- Mark as New
- Mark as Read
- Bookmark
- Subscribe
- Printer Friendly Page
- Report Inappropriate Content
09-23-2020
12:08 AM
The challenge
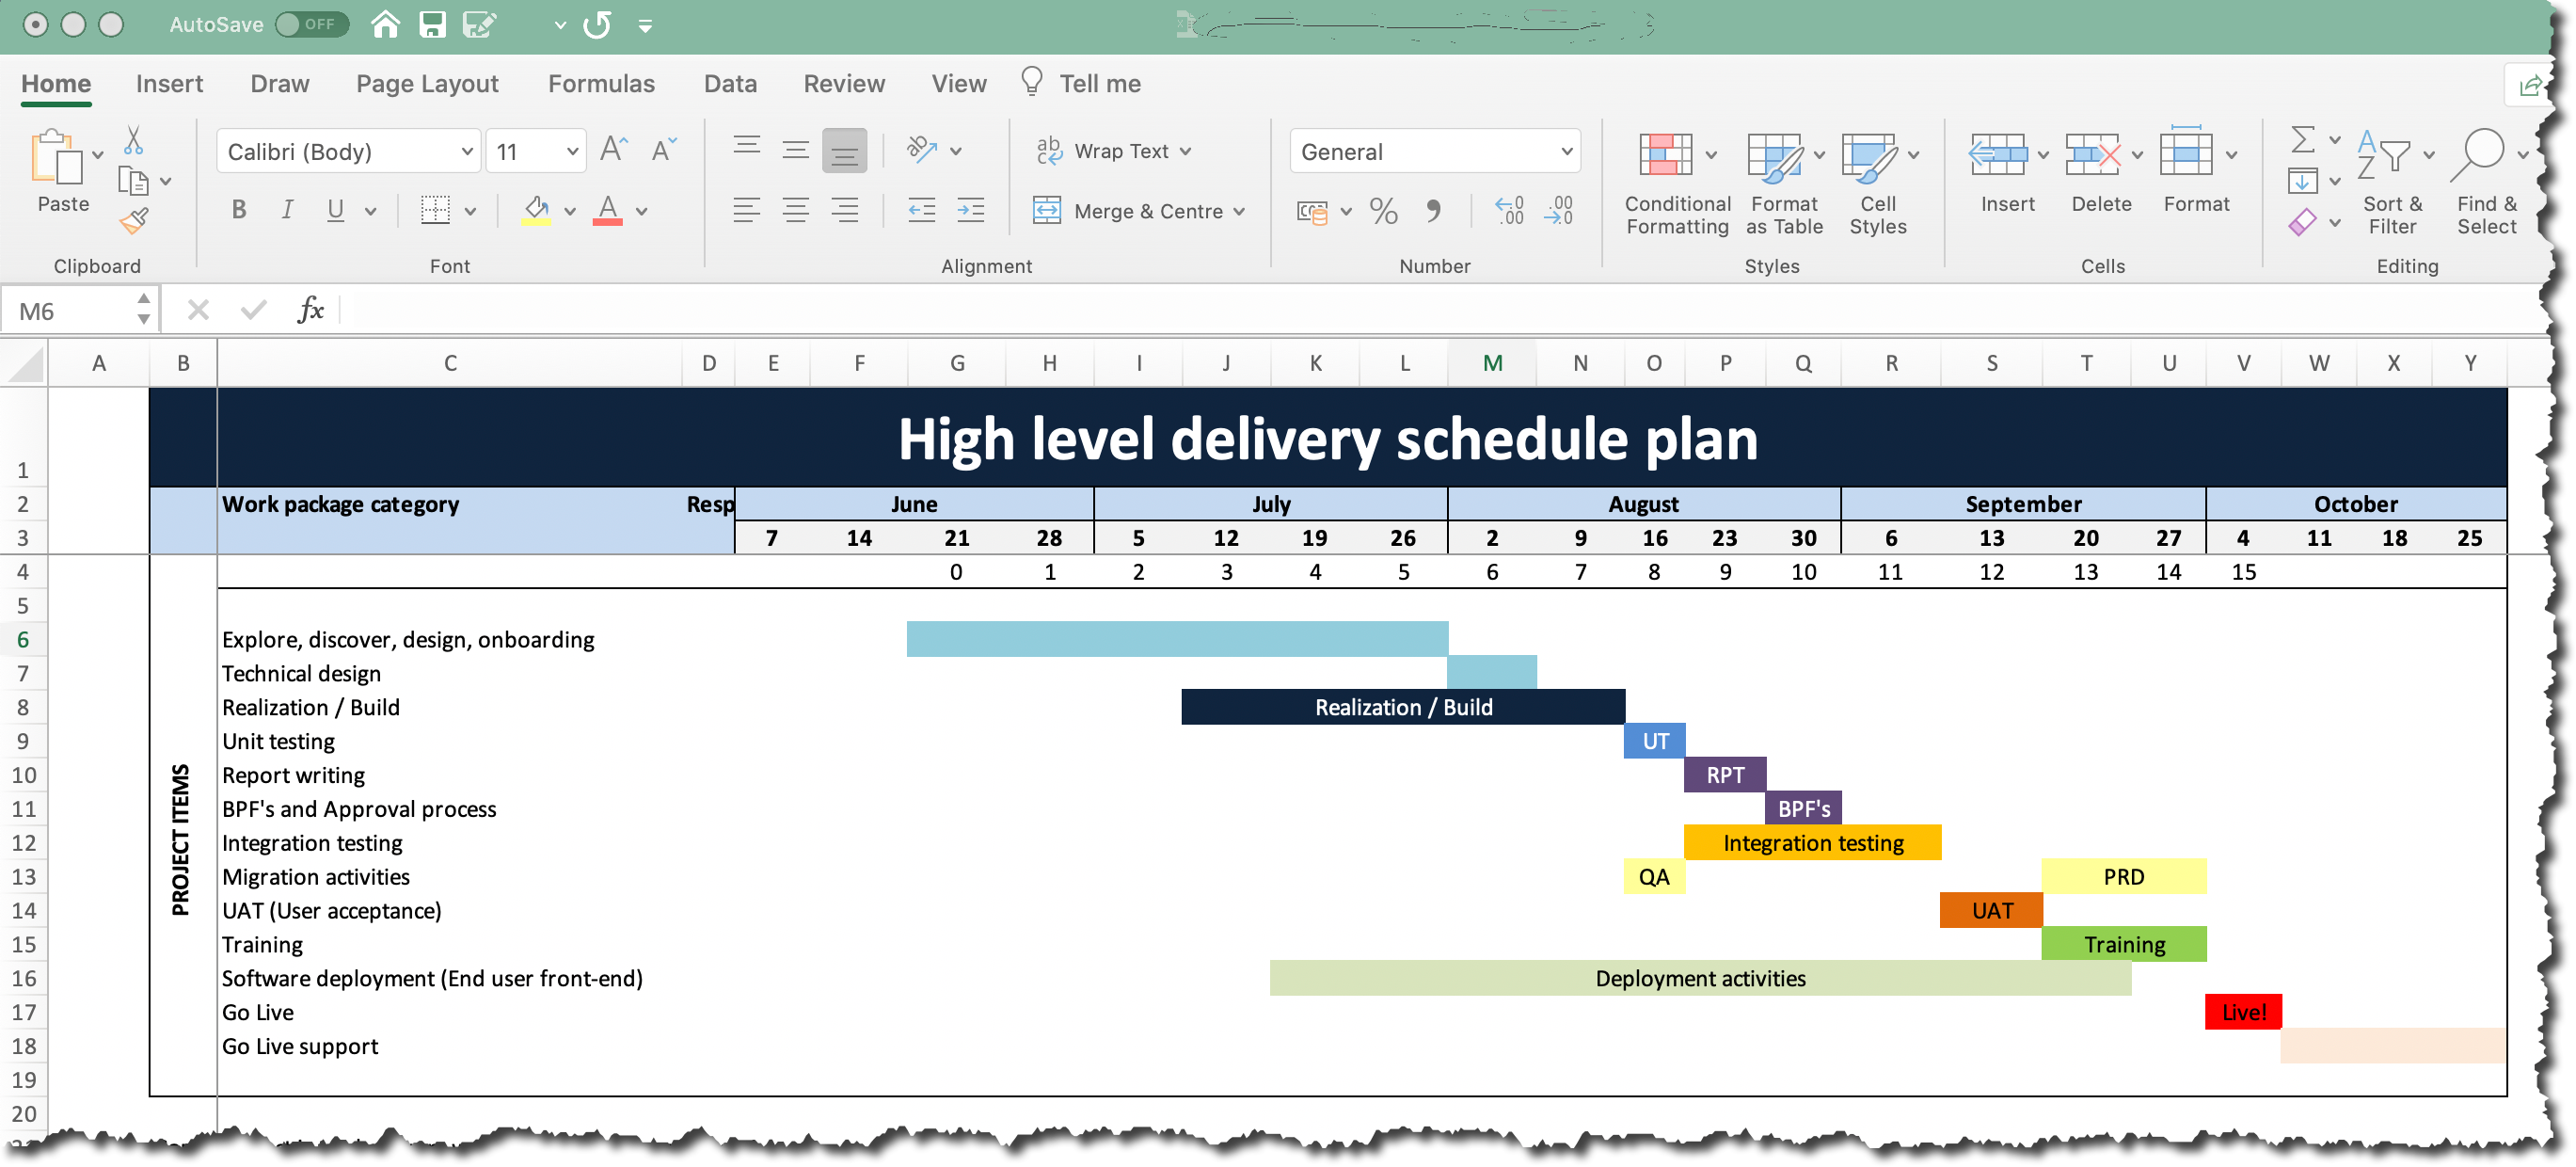
The outcome of this fun challenge is to replicate the following worksheet in SAC (SAP Analytics Cloud) planning in a way that the user only has to select a cell with their mouse to either toggle it's colour on or off.
Although I am using the example of a project plan with dates in the columns and project tasks in the rows of a normal SAC Planning Table the principle is that the mouse-click in the cell sets it's numeric value and this could be applied to other areas of planning.
The numeric value in this case is either a "0" or a "1" and conditional formatting does the rest.
The solution
Overview
Firstly note we are using SAC Analytic Application to solve the challenge based on a SAC planning data acquisition model with a very basic structure as follows:

We start by creating a table with all the necessary filters that we wish to apply to it and select the time dimension "Date" for the columns and "Account" measures in the rows. In the example above it means the table can be applied to multiple projects, multiple versions, reported on a weekly basis (i.e. if the project plan changes the prior weeks plan can still be accessed and compared to the updated plan) and using "Unbooked" values the "Dates" in the columns select every Friday for the duration of the project but can be modified to include additional dates or select Monday's etc.
The basic principle will be to set a "1" or a "0" in each cell turning it "on" or "off" for the visual representation and use conditional formatting to hide these values and "mark" the cells by coloring the background.
The "fun" part of the design is to only use a mouse-click to toggle the "1" / "0" in a normal planning table.
Basic formatting - thresholds
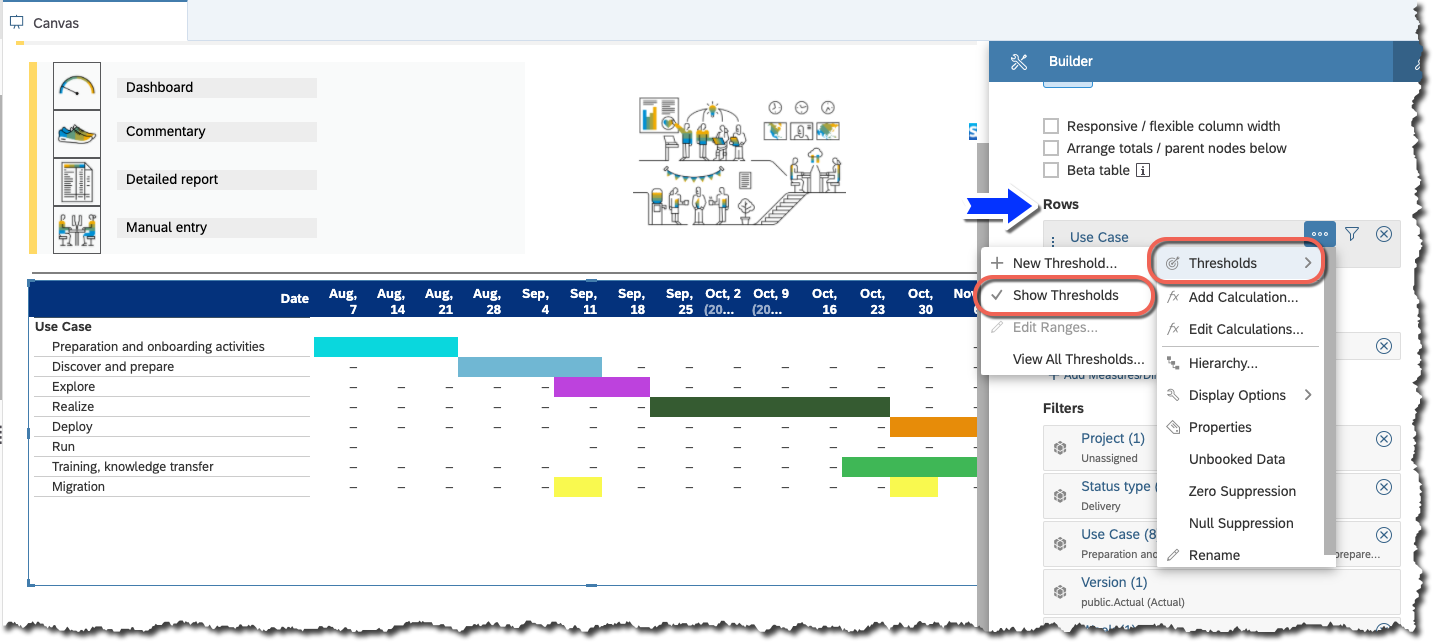
With a little formatting by hiding the unwanted table headers, wrapping text and colouring the "Date" dimension we come close to the basic format.
Then use conditional formatting and "Thresholds" to set a colour for each line item when the value is positive and to the colour "white" for zero or below.

Ensure that the styling for the table with respect to threshold is set to "Color Background Without Values".
This hides the "1" and "0" although they are technically still in each cell.
Also note that "Selection Type" is set to "Single Cell" so the user is only able to select a single cell at a time.

"Zero Suppression" and "Null Suppression" must not be selected because when the script function is executed on a new cell ("Unbooked Data") it contains a "Null" value and if suppression is on the script fails. This is also true for "Zero Suppression" because our toggle function will first take "Null" and set it to a "1" (first toggle) and then if it is toggled again it is not possible to "delete" a value and return it to a "null" state so a "0" is inserted into the cell instead. Therefore, if zero suppression is on the script will fail again when it tries to access any cell that contain a zero.

Script
The event that we are adding our JavaScript code to is the "onSelect" event which means the user only has to select a cell to trigger a response from the table and does not have to enter anything in the table.

The script code will be explained line for line:
if (b_ToggleFlag)

{

	b_ToggleFlag = false;

	return;

};


var vSelection = Table_4.getSelections()[0];

console.log(vSelection);


var vSelData = Table_4.getDataSource().getData(vSelection);

console.log(vSelData);


cast(Type.string, vSelData.formattedValue);

console.log(vSelData.formattedValue);


if (vSelData.formattedValue === "1") {

	Table_4.getPlanning().setUserInput(vSelection, "0");

	Table_4.getPlanning().submitData();

	Table_4.getDataSource().refreshData();

	b_ToggleFlag = true;

	console.log("case 1");

} else {

    Table_4.getPlanning().setUserInput(vSelection, "1");

	Table_4.getPlanning().submitData();

	Table_4.getDataSource().refreshData();

	b_ToggleFlag = true;

	console.log("case <> 1");

}| Line 1 - 5 | A global boolean variable, "b_ToggleFlag", is set to "true" in line 21 and 27 when a toggle has occurred but because we call .submitData in line 19 and 25 when we toggle the value an additional "onSelect" event is triggered and the script is executed again and again in an endless loop. The cell value keeps changing from "0" to "1" and back again and is quite fun to watch but is a definite error for our requirement. So the toggle flag catches the second event and breaks the endless loop by remembering that a toggle has already occurred. It then resets itself to "false" in line 3 and exits the function in line 4 without doing anything. |
| Line 8 - 9 | Since the table styling only allows the user to select a single cell we know that we can look at the first element of the returned selection array since there is only one cell in the selection i.e. the ..."[0]" and we output this to the console for checking purposes while developing. |
| Line 11 - 12 | With the selected cell we can now access that cell's data value and we can view the "raw data" or the "formatted value" which we again output to the console for development purposes. Here you will notice returned values of "-", "0" or "1". |
| Line 14 | Since we are setting integer values but comparing strings we cast the value as a string so the "if" statement can perform the evaluation. |
| Line 17 - 29 | This is the core of the toggle code but the most easiest part to understand as the "if" statement simply checks if the selected data cell value is a "1" in which case it sets it to a "0" and .submitData the data to the planning model which also performs a refresh. Else if not "1" i.e. null or zero perform the opposite setting. |
| Line 20, 26 | The reason there is an additional .refreshData after the .submitData is because SAC Tables format the cell with a "changed cell" formatting of a light yellow just after a value in a table's cell is changed and the threshold formatting does not take effect even though the value is now correct for formatting. So the additional .refreshData activates the threshold conditional formatting and the cell toggles it's colour. |
- SAP Managed Tags:
- SAP Analytics Cloud
Labels:
5 Comments
You must be a registered user to add a comment. If you've already registered, sign in. Otherwise, register and sign in.
Labels in this area
-
ABAP CDS Views - CDC (Change Data Capture)
2 -
AI
1 -
Analyze Workload Data
1 -
BTP
1 -
Business and IT Integration
2 -
Business application stu
1 -
Business Technology Platform
1 -
Business Trends
1,661 -
Business Trends
87 -
CAP
1 -
cf
1 -
Cloud Foundry
1 -
Confluent
1 -
Customer COE Basics and Fundamentals
1 -
Customer COE Latest and Greatest
3 -
Customer Data Browser app
1 -
Data Analysis Tool
1 -
data migration
1 -
data transfer
1 -
Datasphere
2 -
Event Information
1,400 -
Event Information
64 -
Expert
1 -
Expert Insights
178 -
Expert Insights
274 -
General
1 -
Google cloud
1 -
Google Next'24
1 -
Kafka
1 -
Life at SAP
784 -
Life at SAP
11 -
Migrate your Data App
1 -
MTA
1 -
Network Performance Analysis
1 -
NodeJS
1 -
PDF
1 -
POC
1 -
Product Updates
4,577 -
Product Updates
328 -
Replication Flow
1 -
RisewithSAP
1 -
SAP BTP
1 -
SAP BTP Cloud Foundry
1 -
SAP Cloud ALM
1 -
SAP Cloud Application Programming Model
1 -
SAP Datasphere
2 -
SAP S4HANA Cloud
1 -
SAP S4HANA Migration Cockpit
1 -
Technology Updates
6,886 -
Technology Updates
406 -
Workload Fluctuations
1
Related Content
- Partitioning a table in HANA using Range Partitioning using multiple values from Partitioning column in Technology Q&A
- Consuming SAP with SAP Build Apps - Connectivity options for low-code development - part 2 in Technology Blogs by SAP
- explore the business continuity recovery sap solutions on AWS DRS in Technology Blogs by Members
- Single Sign On to SAP Cloud Integration (CPI runtime) from an external Identity Provider in Technology Blogs by SAP
- SAP Sustainability Footprint Management: Q1-24 Updates & Highlights in Technology Blogs by SAP
Top kudoed authors
| User | Count |
|---|---|
| 13 | |
| 10 | |
| 10 | |
| 7 | |
| 7 | |
| 6 | |
| 5 | |
| 5 | |
| 5 | |
| 4 |