- SAP Community
- Products and Technology
- Technology
- Technology Blogs by SAP
- SAP Cloud Platform Alert Notification – Receive Al...
Technology Blogs by SAP
Learn how to extend and personalize SAP applications. Follow the SAP technology blog for insights into SAP BTP, ABAP, SAP Analytics Cloud, SAP HANA, and more.
Turn on suggestions
Auto-suggest helps you quickly narrow down your search results by suggesting possible matches as you type.
Showing results for
Advisor
Options
- Subscribe to RSS Feed
- Mark as New
- Mark as Read
- Bookmark
- Subscribe
- Printer Friendly Page
- Report Inappropriate Content
09-16-2020
4:59 PM
The efficient management of business-critical systems requires not only a powerful monitoring but also a truly reliable alerting mechanism. When it comes to monitoring, any system needs a different set of tools and utilities to ensure that each potential issue is prevented or noticed as soon as it happens. On the other hand, when it comes to alerting, any support team needs one and the same – real-time alerting from all system components to the preferred and easy-to-use channel, where immediate action is taken. One year ago, SAP Cloud Platform introduced the SAP Cloud Platform Alert Notification service – the real-time alerting tool that gathers information throughout the entire platform, then delivers it conveniently to everyone who needs it. Now – an year later, we expand beyond the SAP Cloud Platform, so that we can satisfy the diversity of needs among our customers and partners. We introduce the possibility to gather information from third-party and open source monitoring tools. Only with such integrations, we could achieve the unified alerting model among all components part of a business-critical system.
Today, we will focus on how to adopt the common alerting model when we have Kibana with X-Pack in place. Especially, we will explore the case when its version is equal to or higher than 7.7. In that version, they expose for the first time a new alerting framework which is capable of raising alerts from within the SIEM, APM, Metrics, and Uptime applications.
Throughout the blog post, we will walk through the simple steps to feed a simple index threshold alert into SAP Cloud Platform Alert Notification service. Then we will receive this alert as an e-mail message to verify that it looks like just any other SAP Cloud Platform event.
As prerequisites, two points are needed before starting:
At first, we need to get credentials that allow Kibana to send alerts to Alert Notification. For this purpose let's navigate to our Alert Notification instance using the SAP Cloud Platform Cockpit, then go to the Security menu (for Neo accounts) or to the Service Keys menu (for Cloud Foundry accounts). Now we are ready to create a credentials pair of type BASIC authentication that has the ALERT_WRITE permission. To achieve this, do the following according to your environment:
Once, the credential pair is created, make sure to save the client id and client secret in a secure place, so that we could use them later while configuring Kibana.
The second point of our Alert Notification setup is the configuration that tells it how to react when a Kibana alert is received. Let's start by setting up a simple Alert Notification configuration that will catch any Kibana alert coming, then it will send it to my.mailbox@sap.com. If you want to further filter the upcoming alerts, you could do it later as described in Managing Subscriptions.
You can replicate the configuration in your SAP Cloud Platform Alert Notification instance by the Import feature of the service. Below is the payload you need to import.
Do not forget to replace the e-mail destination with your own email address. After importing, you will receive an automatic message that prompts you to confirm your willingness to receive events on this address.
Note: The screenshots below are taken from Kibana 7.9.1.
After launching your Kibana instance, navigate to its Management section, then Stack Management. In the Alerts and Insights menu, select Alerts and Actions. You will end up in a view like this:
Let's start by creating a connector that will route alerts to Alert Notification. Navigate to the Connectors tab, then click on Create connector:
Here is how my connector looks like when my Alert Notification instance is located in Europe (Frankfurt):
Having a connector set up, we are ready to create also an alert. Let's navigate to the Alerts tab and click on Create alert button. We will create very simple Index threshold alert that could be triggered either in well-setup Kibana environment or in a brand new one:
After saving the alert, wait for a couple of minutes and check your mailbox. You will receive an SAP Cloud Platform Alert Notification event as follows:
Would you like to further explore this scenario? See Integrating with Kibana at SAP Help Portal.
This blog post is part of a series of blog posts related to integration between third-party monitoring tools and SAP Cloud Platform Alert Notification service. We will continuously add newly released integrations, so stay tuned!
We ask you - our customers and partners - to join us in our integration journey! Tell us what you use for monitoring solutions, what you need to integrate with them; tell us your experience, and what your alerting needs are!
Today, we will focus on how to adopt the common alerting model when we have Kibana with X-Pack in place. Especially, we will explore the case when its version is equal to or higher than 7.7. In that version, they expose for the first time a new alerting framework which is capable of raising alerts from within the SIEM, APM, Metrics, and Uptime applications.
Throughout the blog post, we will walk through the simple steps to feed a simple index threshold alert into SAP Cloud Platform Alert Notification service. Then we will receive this alert as an e-mail message to verify that it looks like just any other SAP Cloud Platform event.
As prerequisites, two points are needed before starting:
- An active license or subscription for SAP Cloud Platform Alert Notification;
- One of the following:
- a configured Kibana (version 7.7 or higher) instance with X-Pack & alerting and actions setup;
- a free trial Kibana (version 7.7 or higher) instance.
Set up SAP Cloud Platform Alert Notification
At first, we need to get credentials that allow Kibana to send alerts to Alert Notification. For this purpose let's navigate to our Alert Notification instance using the SAP Cloud Platform Cockpit, then go to the Security menu (for Neo accounts) or to the Service Keys menu (for Cloud Foundry accounts). Now we are ready to create a credentials pair of type BASIC authentication that has the ALERT_WRITE permission. To achieve this, do the following according to your environment:
- for Neo, follow the steps described here

- for Cloud Foundry, follow the steps described here

Once, the credential pair is created, make sure to save the client id and client secret in a secure place, so that we could use them later while configuring Kibana.
The second point of our Alert Notification setup is the configuration that tells it how to react when a Kibana alert is received. Let's start by setting up a simple Alert Notification configuration that will catch any Kibana alert coming, then it will send it to my.mailbox@sap.com. If you want to further filter the upcoming alerts, you could do it later as described in Managing Subscriptions.
You can replicate the configuration in your SAP Cloud Platform Alert Notification instance by the Import feature of the service. Below is the payload you need to import.
Do not forget to replace the e-mail destination with your own email address. After importing, you will receive an automatic message that prompts you to confirm your willingness to receive events on this address.
{

  "conditions": [

    {

       "name": "AllKibanaAlerts",

       "propertyKey": "eventType",

       "predicate": "STARTS_WITH",

       "propertyValue": "KibanaAlert"

    }

  ],

  "actions": [

    {

       "name": "NotifyMeByEmail",

       "state": "ENABLED",

       "destination": "<your.email@here>",

       "type": "EMAIL"

    }

  ],

  "subscriptions": [

    {

       "name": "AllKibanaAlertsToMyEmail",

       "conditions": [

           "AllKibanaAlerts"

       ],

       "actions": [

           "NotifyMeByEmail"

       ],

       "state": "ENABLED"

    }

  ]

}
Set up Kibana Alerts
Note: The screenshots below are taken from Kibana 7.9.1.
After launching your Kibana instance, navigate to its Management section, then Stack Management. In the Alerts and Insights menu, select Alerts and Actions. You will end up in a view like this:

Let's start by creating a connector that will route alerts to Alert Notification. Navigate to the Connectors tab, then click on Create connector:
- Select a connector of type Webhook
- Provide it a name
- Choose the POST method
- Insert an URL to the SAP Cloud Platform Alert Notification Producer API. Notes on how to extract it:
- for Neo accounts, it is the base Event Producer URL, followed by /neo/producer/v1/resource-events. The base Event Producer URL is available in the Security view of your Alert Notification instance in the SAP Cloud Platform Cockpit:
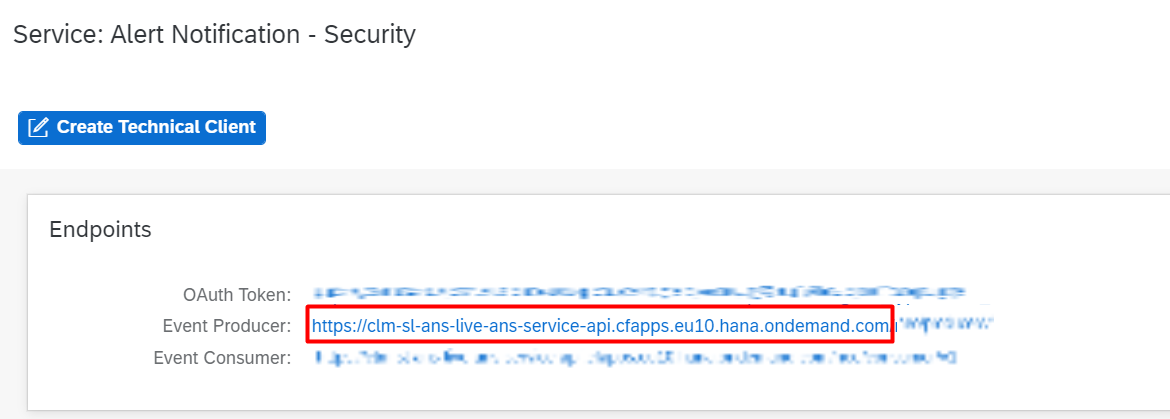
for Cloud Foundry accounts, it is the url available in your Service Key, followed by /cf/producer/v1/resource-events:

- for Neo accounts, it is the base Event Producer URL, followed by /neo/producer/v1/resource-events. The base Event Producer URL is available in the Security view of your Alert Notification instance in the SAP Cloud Platform Cockpit:
- Enter username and password – those are the client id and client secret we saved previously
- Add Content-Type header with value application/json
Here is how my connector looks like when my Alert Notification instance is located in Europe (Frankfurt):

Having a connector set up, we are ready to create also an alert. Let's navigate to the Alerts tab and click on Create alert button. We will create very simple Index threshold alert that could be triggered either in well-setup Kibana environment or in a brand new one:
- Provide alert name, some tags (optional), checks and notifications frequencies:
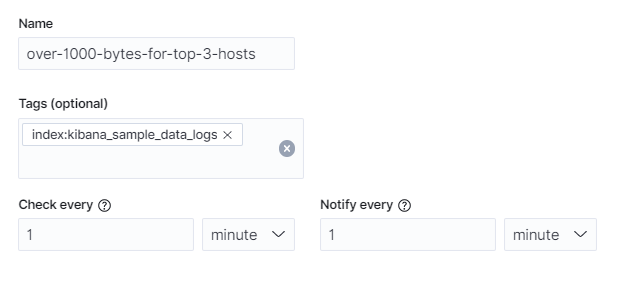
- Select the trigger type and set it up accordingly – index name, grouping field and condition shall be adapted according to your own Kibana environment. In this example, I've used the default index in my trial deployment with sample data :

- Finally, we select an action to be executed on raising such an alert – we'll use the webhook to Alert Notification we've just created with the following sample payload:
{
"eventType": "KibanaAlert",
"resource": {
"resourceName": "{{alertName}}",
"resourceType": "cloud-resource",
"tags": {
"spaceId": "{{spaceId}}"
}
},
"severity": "INFO",
"category": "ALERT",
"subject": "Alert '{{alertName}}' triggered",
"body": "Index threshold alert with name {{actionName}} was triggered.",
"tags": {
"alertInstanceId": "{{alertInstanceId}}",
"alertId": "{{alertId}}",
"tags": "{{tags}}"
}
}

After saving the alert, wait for a couple of minutes and check your mailbox. You will receive an SAP Cloud Platform Alert Notification event as follows:

Would you like to further explore this scenario? See Integrating with Kibana at SAP Help Portal.
This blog post is part of a series of blog posts related to integration between third-party monitoring tools and SAP Cloud Platform Alert Notification service. We will continuously add newly released integrations, so stay tuned!
We ask you - our customers and partners - to join us in our integration journey! Tell us what you use for monitoring solutions, what you need to integrate with them; tell us your experience, and what your alerting needs are!
- SAP Managed Tags:
- DevOps,
- SAP Alert Notification service for SAP BTP,
- SAP Business Technology Platform
Labels:
1 Comment
You must be a registered user to add a comment. If you've already registered, sign in. Otherwise, register and sign in.
Labels in this area
-
ABAP CDS Views - CDC (Change Data Capture)
2 -
AI
1 -
Analyze Workload Data
1 -
BTP
1 -
Business and IT Integration
2 -
Business application stu
1 -
Business Technology Platform
1 -
Business Trends
1,661 -
Business Trends
88 -
CAP
1 -
cf
1 -
Cloud Foundry
1 -
Confluent
1 -
Customer COE Basics and Fundamentals
1 -
Customer COE Latest and Greatest
3 -
Customer Data Browser app
1 -
Data Analysis Tool
1 -
data migration
1 -
data transfer
1 -
Datasphere
2 -
Event Information
1,400 -
Event Information
65 -
Expert
1 -
Expert Insights
178 -
Expert Insights
280 -
General
1 -
Google cloud
1 -
Google Next'24
1 -
Kafka
1 -
Life at SAP
784 -
Life at SAP
11 -
Migrate your Data App
1 -
MTA
1 -
Network Performance Analysis
1 -
NodeJS
1 -
PDF
1 -
POC
1 -
Product Updates
4,577 -
Product Updates
330 -
Replication Flow
1 -
RisewithSAP
1 -
SAP BTP
1 -
SAP BTP Cloud Foundry
1 -
SAP Cloud ALM
1 -
SAP Cloud Application Programming Model
1 -
SAP Datasphere
2 -
SAP S4HANA Cloud
1 -
SAP S4HANA Migration Cockpit
1 -
Technology Updates
6,886 -
Technology Updates
408 -
Workload Fluctuations
1
Related Content
- Hack2Build on Business AI – Highlighted Use Cases in Technology Blogs by SAP
- SAP Partners unleash Business AI potential at global Hack2Build in Technology Blogs by SAP
- Receive a notification when your storage quota of SAP Cloud Transport Management passes 85% in Technology Blogs by SAP
- Top Picks: Innovations Highlights from SAP Business Technology Platform (Q1/2024) in Technology Blogs by SAP
- SAP Document and Reporting Compliance - 'Colombia' - Contingency Process in Technology Blogs by SAP
Popular Blog Posts
| Subject | Kudos |
|---|---|
|
|
|
|
|
|
|
|
|
|
|
|
|
|
|
|
|
|
|
Top kudoed authors
| User | Count |
|---|---|
| 13 | |
| 10 | |
| 10 | |
| 9 | |
| 8 | |
| 7 | |
| 6 | |
| 5 | |
| 5 | |
| 5 |