
- SAP Community
- Products and Technology
- Technology
- Technology Blogs by SAP
- Downtime Optimization - Get insights using the new...
Technology Blogs by SAP
Learn how to extend and personalize SAP applications. Follow the SAP technology blog for insights into SAP BTP, ABAP, SAP Analytics Cloud, SAP HANA, and more.
Turn on suggestions
Auto-suggest helps you quickly narrow down your search results by suggesting possible matches as you type.
Showing results for
Advisor
Options
- Subscribe to RSS Feed
- Mark as New
- Mark as Read
- Bookmark
- Subscribe
- Printer Friendly Page
- Report Inappropriate Content
09-16-2020
4:24 PM
Features of version 1.0 (released on 11 June 2020):
Features of version 1.1 (released on 01 October 2020):
Features of version 1.2 (released on 25 February 2021):
Features of version 1.3 (released on 12 August 2021):
Features of version 1.4 (released on 03 August 2022):
Features of Version 1.5 (Released on 18 November 2022):
Features of Version 1.6 (Released on 02 February 2023):
Features of Version 1.7 (Released on 07 March 2023):
Prerequisite: An uploaded applana.xml is required to see this feature. (applana Generation described in Features of Version 1.1)
A transition to SAP S/4HANA is on everyone’s agenda. Sooner or later you will start your journey to SAP S/4HANA. In such projects you deal with longer runtimes. As a result there are troubles meeting the requested downtime window by the business unit.
A downtime event is always costly for a company. Often not more than a weekend is allowed to ensure an uninterrupted operation. Hence, the downtime can be a showstopper for any project and needs to be kept under control.
In this blog post I would like to introduce the Technical Downtime Optimization app.
It helps upgrade/conversion project members meet tight downtime requirements by providing easy to consume analytics and tailored downtime minimization advices and simulation from continuously updated knowledge base curated by upgrade/conversion experts.
The Software Update Manager (SUM) collects runtime statistics in the UPGANA.XML file. They can be send to SAP along with the SUM feedback form at the end of your Upgrade or Conversion run.
An automated algorithm in the cloud backend processes the data and presents them after approximately three hours. This step is fully automated and doesn't require any interaction from your side.
Finally you are ready to analyze your data and identify potential downtime savings.
There are two ways entering the app:
If you would like to go for the SAP ONE Support Launchpad then search for the "Technical Downtime Optimization" app. Afterwards add this tile to a group. Now you can see information about the number of maintenance events in the past 365 days as well as the data of the last available event.
No problem! With the new upload functionality you are now able to upload your UPGANA.XML and APPLANA.XML file. The processing time of about three hours applies as well.
On the start screen, set a filter to reduce the number of displayed events or directly choose a desired maintenance event and check the analysis by clicking the event.
The analysis screen is divided into three parts: the header, the time chart and the recommendation part.
The Header
The header of the app always contains information of the displayed maintenance event. Here you will see (1) the installation number, product, host and type of event, as well as information on source and target system including start and end date.
Additionally to that (2) you are able to open the UPGANA.XML and APPLANA.XML files to get more data of the event . Please note, that the APPLANA.XML file is just available for SAP S/4HANA conversions and if created and uploaded manually.
(3) Furthermore you have the possibility to switch the timeline between "Complete upgrade without tool waiting time" and "... with tool waiting time".
The Timeline
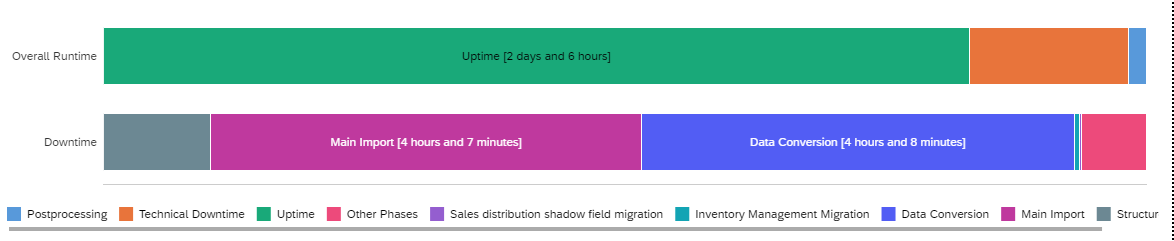
The timeline (4) consists of an overall runtime and a detailed analysis.
The overall runtime includes Uptime, Downtime and Postprocessing. The detailed analysis is dependent on one of that parts. As we focus on downtime optimization, we directly switch to the orange part, the "Technical Downtime".
The detailed analysis will now show SUM phases which run during the downtime. When clicking on a downtime phase you will see analysis and recommendation in the recommendation part (5).
The recommendation part
The last part of the app is also divided into three parts.

At the beginning you will read about the chosen phase, its runtime and how to optimize it. Afterwards you see the processes sorted according their duration and the line chart which shows the parallel processes. The granularity of the charts can be adjusted using either more or less bins.
In order to evaluate the Financial Data Migration runtime choose "Application analytics document" on the top right side of your start screen.
This will direct you to a structured view of the APPLANA.XML file.
In the next version it is planned to have a more detailed analysis on the Financial Data Migration part included into the app.
The major deliver of release 1.3 was the compare view. You have now the possibility to compare two runs of a recent project. This can be done as follows:
Using the compare view you have the chance to check what improvements you achieved. In above example the first run was executed using standard methodology. After implementing downtime decreasing parameter and choosing nZDM method in Software Update Manager the overall SUM downtime has been reduced by 57% with major improvements in Main Import (71%) and Data Conversion (72%).
With the 1.4 update in August 2022 you can now also see the detailed phases and their runtimes.
The major deliver of release 1.5 was the cutover planning tool.
With the Cutover Planner it is possible to create a rough plan for an upcoming maintenance event based on the currently selected event. Adjustments can be made based on the required time windows. Once completed, an export function is available to use the plan in a spreadsheet program.
Note: The Cutover Planning Tool is currently not available for SUM procedures with ZDO.
In the tool itself you see the most important cutover activities, like:
These times can be changed by moving or resizing the blocks directly in the timeline. The orange blocks are proposals and might need to be changed. Durations are rounded to the nearest fifteen minutes.
Using the Technical Downtime Optimization app you get easy to consume analytics and simulation from an up-to-date knowledge base to evaluate your runtime and detect possible downtime drivers. This tailored downtime minimization advice is included in the SAP support offering and comes with no extra costs.
For more details and updates on new functionality and answers to frequently question, check:
Andreas Lichtenau
- Procedure events can be browsed, sorted, and filtered
- General procedure information is displayed in the header part
- Duration information is divided into sections that can be opened separately
- First optimization recommendations are provided
Features of version 1.1 (released on 01 October 2020):
- Upload functionality of upgana.xml and/or applana.xml files
- Several checks are available (R3trans & SUM version check, R3trans process amount, PARDIST_SHD & KERNEL_PRE runtime)
- Display elements details for TABIM & data transfer phases (EU_CLONE_*)
Features of version 1.2 (released on 25 February 2021):
- Simulation for nZDM, Downtime-optimized DMO, Downtime-optimized Conversion and ZDO
- Download of UPGANA & APPLANA files
- Extension of filter options
- Header shows procedure type
- Integration of System Data, Financial Data Quality and Data Volume Management app
- Visual improvements
- Support of Update events in addition to Conversion and Upgrade
Features of version 1.3 (released on 12 August 2021):
- Compare View has been launched
Features of version 1.4 (released on 03 August 2022):
- Revision of the event comparison in TDO
- Display of runtimes of phases in TDO
- Display of runtimes of phases in a comparison view (selection "Compare")
- Selection "View" removed
Configurable event table - New timeline (Note: This new feature is currently not available for events with system move)
Features of Version 1.5 (Released on 18 November 2022):
- Added: Cutover Planning Tool
Features of Version 1.6 (Released on 02 February 2023):
- Enhancement of Simulation Results and Timeline
- Timeline Enabled for System Move Events
- Interactive Cutover Planner Table
- Datepicker for Start of Downtime in Cutover Table
- App performance improvements
Features of Version 1.7 (Released on 07 March 2023):
- For planning of productive Conversion the financial downtime is now available in the Cutover Plan.
Prerequisite: An uploaded applana.xml is required to see this feature. (applana Generation described in Features of Version 1.1)
###################################################################
A transition to SAP S/4HANA is on everyone’s agenda. Sooner or later you will start your journey to SAP S/4HANA. In such projects you deal with longer runtimes. As a result there are troubles meeting the requested downtime window by the business unit.
A downtime event is always costly for a company. Often not more than a weekend is allowed to ensure an uninterrupted operation. Hence, the downtime can be a showstopper for any project and needs to be kept under control.
In this blog post I would like to introduce the Technical Downtime Optimization app.
It helps upgrade/conversion project members meet tight downtime requirements by providing easy to consume analytics and tailored downtime minimization advices and simulation from continuously updated knowledge base curated by upgrade/conversion experts.
How does it work?
The Software Update Manager (SUM) collects runtime statistics in the UPGANA.XML file. They can be send to SAP along with the SUM feedback form at the end of your Upgrade or Conversion run.


An automated algorithm in the cloud backend processes the data and presents them after approximately three hours. This step is fully automated and doesn't require any interaction from your side.
Finally you are ready to analyze your data and identify potential downtime savings.
How to get this app?
There are two ways entering the app:
- Using the SAP ONE Support Launchpad
- Using the direct link: https://launchpad.support.sap.com/#/downtimeoptimization
If you would like to go for the SAP ONE Support Launchpad then search for the "Technical Downtime Optimization" app. Afterwards add this tile to a group. Now you can see information about the number of maintenance events in the past 365 days as well as the data of the last available event.

Finally you enter the start page and are good to go.

Forgot to send your data?
No problem! With the new upload functionality you are now able to upload your UPGANA.XML and APPLANA.XML file. The processing time of about three hours applies as well.

How to use the app?
On the start screen, set a filter to reduce the number of displayed events or directly choose a desired maintenance event and check the analysis by clicking the event.
The analysis screen is divided into three parts: the header, the time chart and the recommendation part.

The Header
The header of the app always contains information of the displayed maintenance event. Here you will see (1) the installation number, product, host and type of event, as well as information on source and target system including start and end date.
Additionally to that (2) you are able to open the UPGANA.XML and APPLANA.XML files to get more data of the event . Please note, that the APPLANA.XML file is just available for SAP S/4HANA conversions and if created and uploaded manually.
(3) Furthermore you have the possibility to switch the timeline between "Complete upgrade without tool waiting time" and "... with tool waiting time".
The Timeline
The timeline (4) consists of an overall runtime and a detailed analysis.
The overall runtime includes Uptime, Downtime and Postprocessing. The detailed analysis is dependent on one of that parts. As we focus on downtime optimization, we directly switch to the orange part, the "Technical Downtime".
The detailed analysis will now show SUM phases which run during the downtime. When clicking on a downtime phase you will see analysis and recommendation in the recommendation part (5).
The recommendation part
The last part of the app is also divided into three parts.
At the beginning you will read about the chosen phase, its runtime and how to optimize it. Afterwards you see the processes sorted according their duration and the line chart which shows the parallel processes. The granularity of the charts can be adjusted using either more or less bins.
How to check the Financial Data migration runtime?
In order to evaluate the Financial Data Migration runtime choose "Application analytics document" on the top right side of your start screen.

This will direct you to a structured view of the APPLANA.XML file.

In the next version it is planned to have a more detailed analysis on the Financial Data Migration part included into the app.
How to use the Compare View?
The major deliver of release 1.3 was the compare view. You have now the possibility to compare two runs of a recent project. This can be done as follows:
- Select a specific run of a maintenance event

- Press the "Compare View" button in order to choose the event you want to compare

- Select the second event:

- See both events and their runtimes next to each other for better comparison.

Using the compare view you have the chance to check what improvements you achieved. In above example the first run was executed using standard methodology. After implementing downtime decreasing parameter and choosing nZDM method in Software Update Manager the overall SUM downtime has been reduced by 57% with major improvements in Main Import (71%) and Data Conversion (72%).
With the 1.4 update in August 2022 you can now also see the detailed phases and their runtimes.

How to use the Cutover Planning tool?
The major deliver of release 1.5 was the cutover planning tool.
With the Cutover Planner it is possible to create a rough plan for an upcoming maintenance event based on the currently selected event. Adjustments can be made based on the required time windows. Once completed, an export function is available to use the plan in a spreadsheet program.
Note: The Cutover Planning Tool is currently not available for SUM procedures with ZDO.
You can enter the cutover planner in the event of your choice.

In the tool itself you see the most important cutover activities, like:
- Ramp-Up / Ramp-Down
- Buffer Time
- Customer Postprocessing
- Backup
- Financial Downtime

These times can be changed by moving or resizing the blocks directly in the timeline. The orange blocks are proposals and might need to be changed. Durations are rounded to the nearest fifteen minutes.
Summary
Using the Technical Downtime Optimization app you get easy to consume analytics and simulation from an up-to-date knowledge base to evaluate your runtime and detect possible downtime drivers. This tailored downtime minimization advice is included in the SAP support offering and comes with no extra costs.
For more details and updates on new functionality and answers to frequently question, check:
- SAP Note 2881515 - Introduction to the Technical Downtime Optimization App
- SAP Note 3036423 - Frequently Asked Questions about Technical Downtime Optimization App
Andreas Lichtenau
Expert Support Engineer, Premium Hub CoE, Customer Success, SAP SE
- SAP Managed Tags:
- Support Services,
- SAP S/4HANA,
- software logistics toolset,
- Basis Technology,
- Software Logistics
Labels:
22 Comments
You must be a registered user to add a comment. If you've already registered, sign in. Otherwise, register and sign in.
Labels in this area
-
ABAP CDS Views - CDC (Change Data Capture)
2 -
AI
1 -
Analyze Workload Data
1 -
BTP
1 -
Business and IT Integration
2 -
Business application stu
1 -
Business Technology Platform
1 -
Business Trends
1,658 -
Business Trends
93 -
CAP
1 -
cf
1 -
Cloud Foundry
1 -
Confluent
1 -
Customer COE Basics and Fundamentals
1 -
Customer COE Latest and Greatest
3 -
Customer Data Browser app
1 -
Data Analysis Tool
1 -
data migration
1 -
data transfer
1 -
Datasphere
2 -
Event Information
1,400 -
Event Information
66 -
Expert
1 -
Expert Insights
177 -
Expert Insights
299 -
General
1 -
Google cloud
1 -
Google Next'24
1 -
Kafka
1 -
Life at SAP
780 -
Life at SAP
13 -
Migrate your Data App
1 -
MTA
1 -
Network Performance Analysis
1 -
NodeJS
1 -
PDF
1 -
POC
1 -
Product Updates
4,577 -
Product Updates
344 -
Replication Flow
1 -
RisewithSAP
1 -
SAP BTP
1 -
SAP BTP Cloud Foundry
1 -
SAP Cloud ALM
1 -
SAP Cloud Application Programming Model
1 -
SAP Datasphere
2 -
SAP S4HANA Cloud
1 -
SAP S4HANA Migration Cockpit
1 -
Technology Updates
6,873 -
Technology Updates
423 -
Workload Fluctuations
1
Related Content
- Start page of SAP Signavio Process Insights, discovery edition, the 4 pillars and documentation in Technology Blogs by SAP
- IoT - Ultimate Data Cyber Security - with Enterprise Blockchain and SAP BTP 🚀 in Technology Blogs by Members
- Analyze Expensive ABAP Workload in the Cloud with Work Process Sampling in Technology Blogs by SAP
- Unify your process and task mining insights: How SAP UEM by Knoa integrates with SAP Signavio in Technology Blogs by SAP
- Kyma Integration with SAP Cloud Logging. Part 2: Let's ship some traces in Technology Blogs by SAP
Top kudoed authors
| User | Count |
|---|---|
| 40 | |
| 25 | |
| 17 | |
| 14 | |
| 8 | |
| 7 | |
| 7 | |
| 7 | |
| 6 | |
| 6 |