
- SAP Community
- Products and Technology
- Technology
- Technology Blogs by SAP
- Calculation Bar extension for SAP Analytics Cloud ...
Technology Blogs by SAP
Learn how to extend and personalize SAP applications. Follow the SAP technology blog for insights into SAP BTP, ABAP, SAP Analytics Cloud, SAP HANA, and more.
Turn on suggestions
Auto-suggest helps you quickly narrow down your search results by suggesting possible matches as you type.
Showing results for
Advisor
Options
- Subscribe to RSS Feed
- Mark as New
- Mark as Read
- Bookmark
- Subscribe
- Printer Friendly Page
- Report Inappropriate Content
08-07-2020
4:49 PM
I recently fielded a customer request for an SAP Analytics Cloud implementation of the Excel status bar, where basic calculations show up for the current cell selection:
This functionality isn’t currently available in the SAC table component, but I immediately thought of implementing it in an Analytic Application using the power of JavaScript. I’ll share the approach here in case it can be helpful to anyone else, along with some lessons I learned along the way.
Beginning with the end in mind, here is a snapshot of what we will build:
There are 7 calculations and the code only fires when data cells are selected. Let’s get started!
First, we will create an analytic application using the Best Run Juice sample model that comes with SAC.

I hope you find this SAP Analytics Cloud ‘Calculation Bar’ useful. Feel free to use it in your own projects and drop me a line in the comments if you have other ideas for analytic application extensions.
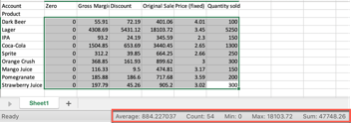
Status bar in Excel
This functionality isn’t currently available in the SAC table component, but I immediately thought of implementing it in an Analytic Application using the power of JavaScript. I’ll share the approach here in case it can be helpful to anyone else, along with some lessons I learned along the way.
Beginning with the end in mind, here is a snapshot of what we will build:

Calculation Bar you will have at the end
There are 7 calculations and the code only fires when data cells are selected. Let’s get started!
First, we will create an analytic application using the Best Run Juice sample model that comes with SAC.
- Click the menu icon, create, analytic application
- Add a table component, rename it to Table_Calc, and bind it to the model in Samples > BestRunJuice_SampleModel
- Add ‘Product’ to the row axis, and add all of the 5 measures to account on the column axis
- Enable ‘Show only Leaves in Widget’ for the Product dimension by modifying the hierarchy properties:

- Next, let’s disable scaling of measures so we can spot check our work in the end. This is for display purposes only, as the API we will use to get the values operates on the unformatted values. Select the table, click styling, and set Scale to ‘Unformatted’

- Apply a filter on Date = “Dec H2/2016” and Store = “Ozzy” just to keep the numbers under control.
- Create a Calculated Measure calculation called ‘Zero’ with a value of 0 to demonstrate the Average excluding 0 method

- Add a text box component, rename it to Calc_Bar, and uncheck the ‘Show this item at view time’ option. This keeps the calculation bar hidden until we have values to populate it with.

- Now we get to write some code! Modify the ‘On Select’ event of Table_Calc as follows:
if (Table_Calc.getSelections().length > 1) {

	var ar = Calc.getNumArray(Table_Calc.getSelections());

	Calc.setStatusBar(ar, Calc_Bar);

}
And just like that we’re done!
Just kidding … most of the work comes in creating the Calc object and script functions, which we will tackle in a minute. All you need to know about this code block is that it won’t fire unless more than 1 cell is selected, and that the rest of the blog will focus on creating the ‘Calc’ script object and its functions. - Let’s create the following object and functions:Using this structure (pro tip: max, min, and sum have the same structure. Create one and duplicate it for the others)
Name
Return Type
Set as Array
Arg 1
Arg 1 Type
Arg 1 Set as Array
Arg 2
Arg 2 Type
getNumArray
number
YES
sel
Selection
YES
max
number
NO
exec
number
YES
min
number
NO
exec
number
YES
setStatusBar
void
NO
ar
number
YES
statusTextBoxName
Text
sum
number
NO
exec
number
YES
- A few notes based on my experience up to this point. This structure could be refactored to do all of the calculations (max, min, sum) in a single function that returns an array with 3 (or 7) values. I left them separate here to keep everything modular.For the setStatusBar function, statusTextBoxName accepts a Text object so we don’t have to hardcode the name of the component in the function. It might be superfluous, but I wanted to keep the script functions generic wherever possible.
- Enter the following code for ‘getNumArray’:
var ar = ArrayUtils.create(Type.number);


	for(var i=0;i<sel.length;i++) {

		var singleSel = sel[i];

		if (Table_Calc.getDataSource().getData(singleSel)) {

			if (Table_Calc.getDataSource().getData(singleSel).formattedValue !== "–") {

				ar.push(ConvertUtils.stringToNumber(Table_Calc.getDataSource().getData(singleSel).rawValue));

			}

		}

	};

return ar;
This function parses the user selection in the table and pushes the raw (unformatted) values into a number array. It is the foundation for the rest of the functions. We loop through every cell in the selection, and if the value is a non-null number, include it in the returned array. - Enter the following for ‘max’:
var max = ArrayUtils.create(Type.number);

for (var i=0;i<exec.length;i++) {

	if (max.length === 0) {

		max.push(exec[i]);

	}

	if (exec[i]>max[0]) {

		max.splice(0,1,exec[i]);

	}

};

return max[0];
SAC provides the Math.max and Math.min methods, but they do not accept arrays … only 2 values. Proper JavaScript allows the syntax:
Math.max(…array);
But this doesn’t work in the analytic application designer. Hopefully the available JavaScript expands in future releases. For now, I wrote this function that pushes the first value in the number array and compares all the remaining values and updates the max accordingly. - A minor change for the min function:
var min = ArrayUtils.create(Type.number);

for (var i=0;i<exec.length;i++) {

	if (min.length === 0) {

		min.push(exec[i]);

	}

	if (exec[i]<min[0]) {

		min.splice(0,1,exec[i]);

	}

};

return min[0];
- Next, the sum function:
var sum = 0.0;
for (var i=0;i<exec.length;i++) {
sum = sum + exec[i];
};
return sum;
We really want access to array.reduce() here but it isn’t available on the array object. Again, something I hope becomes available in the future. - Finally, the setStatusBar function:
if (ar.length>1) {
var format1 = NumberFormat.create();
format1.setMaximumDecimalPlaces(2);
var sum = Calc.sum(ar);
var min = Calc.min(ar);
var max = Calc.max(ar);
var ar_ex0 = ArrayUtils.create(Type.number);
for(var i=0;i<ar.length;i++){
if (ar[i] !== 0) {
ar_ex0.push(ar[i]);
}
};
var sumText = "Average: " + format1.format(sum/ar.length) + " | " +
" Average (Excluding 0): " + format1.format(sum/ar_ex0.length) + " | " +
" Count: " + format1.format(ar.length) + " | " +
" Sum: " + format1.format(sum) + " | " +
" Min: " + format1.format(min) + " | " +
" Max: " + format1.format(max) + " | " +
" Range: " + format1.format(max - min);
statusTextBoxName.applyText(sumText);
statusTextBoxName.setVisible(true);
}
else {
statusTextBoxName.setVisible(false);
}
This is the longest function, where we do the calculations and update the text component with the results. We also apply a number format to prevent crazy floating-point precisions. I put the logic to calculate average without zeros here as well, though it could be refactored like the other calculations.
Now the final result:
I hope you find this SAP Analytics Cloud ‘Calculation Bar’ useful. Feel free to use it in your own projects and drop me a line in the comments if you have other ideas for analytic application extensions.
- SAP Managed Tags:
- SAP Analytics Cloud,
- JavaScript
Labels:
2 Comments
You must be a registered user to add a comment. If you've already registered, sign in. Otherwise, register and sign in.
Labels in this area
-
ABAP CDS Views - CDC (Change Data Capture)
2 -
AI
1 -
Analyze Workload Data
1 -
BTP
1 -
Business and IT Integration
2 -
Business application stu
1 -
Business Technology Platform
1 -
Business Trends
1,658 -
Business Trends
91 -
CAP
1 -
cf
1 -
Cloud Foundry
1 -
Confluent
1 -
Customer COE Basics and Fundamentals
1 -
Customer COE Latest and Greatest
3 -
Customer Data Browser app
1 -
Data Analysis Tool
1 -
data migration
1 -
data transfer
1 -
Datasphere
2 -
Event Information
1,400 -
Event Information
66 -
Expert
1 -
Expert Insights
177 -
Expert Insights
296 -
General
1 -
Google cloud
1 -
Google Next'24
1 -
Kafka
1 -
Life at SAP
780 -
Life at SAP
13 -
Migrate your Data App
1 -
MTA
1 -
Network Performance Analysis
1 -
NodeJS
1 -
PDF
1 -
POC
1 -
Product Updates
4,577 -
Product Updates
342 -
Replication Flow
1 -
RisewithSAP
1 -
SAP BTP
1 -
SAP BTP Cloud Foundry
1 -
SAP Cloud ALM
1 -
SAP Cloud Application Programming Model
1 -
SAP Datasphere
2 -
SAP S4HANA Cloud
1 -
SAP S4HANA Migration Cockpit
1 -
Technology Updates
6,873 -
Technology Updates
420 -
Workload Fluctuations
1
Related Content
- Improving Time Management in SAP S/4HANA Cloud: A GenAI Solution in Technology Blogs by SAP
- IoT - Ultimate Data Cyber Security - with Enterprise Blockchain and SAP BTP 🚀 in Technology Blogs by Members
- Unify your process and task mining insights: How SAP UEM by Knoa integrates with SAP Signavio in Technology Blogs by SAP
- Kyma Integration with SAP Cloud Logging. Part 2: Let's ship some traces in Technology Blogs by SAP
- Consolidation Extension for SAP Analytics Cloud – Automated Eliminations and Adjustments (part 1) in Technology Blogs by Members
Top kudoed authors
| User | Count |
|---|---|
| 37 | |
| 25 | |
| 17 | |
| 13 | |
| 7 | |
| 7 | |
| 7 | |
| 6 | |
| 6 | |
| 6 |