Process Monitor (ProcMon) is a tool for monitoring real-time system activities on the level of the file system, the registry, and network operations. This blog describes how to use ProcMon to collect these system activities and save them to a local file. The data collected by this tool can be very useful for troubleshooting purposes. Therefore, it is especially useful for the SAP support.
Download and start ProcMon
First, you must download the latest version of ProcMon and extract the ProcessMonitor.zip file to a directory on your local system, for example C:\Tools.
The tool can be downloaded from Microsoft by using the following link: https://docs.microsoft.com/en-us/sysinternals/downloads/procmon.
Then, you have to extract the archive file and you can start ProcMon by running the Procmon64.exe. After you have confirmed the license dialog on the first run, you will see the main window of ProcMon and a dialog showing a list of the defined Process Monitor Filters. Reset the list of filters (use button "Reset") and close this dialog window with the button Ok.

Warning: If your filter list contains an "Include" filter, ProcMon will only display/monitor data that matches this rule! All other data will be discarded. In the example below, ProcMon will only display data for processes, which contain netsh within the Process Name!

Optional: If you want to be sure that there is no misconfiguration of the filter list you can safely remove all the preconfigured filters. Doing this ProcMon will collect all data it can get.

Capturing events with ProcMon can be very expensive in terms of resources. for this reason, we recommend disabling capturing by pressing the magnifier button in the toolbar on the top, or use the shortcut Ctrl + E. The capturing is disabled if there the magnifier symbol shows a red cross:

Additionally, you can also clear the list of collected data by pressing Ctrl +X or using the action Edit - Clear Display from the main menu.
Prepare the scenario to be monitored
Now you can prepare the scenario you want to monitor with ProcMon. In this example we will monitor Notepad.exe, but you can also try to monitor the SWPM or other Windows applications.
After you have set up the desired scenario, switch back and enable the capturing with ProcMon by pressing the magnifier button in the toolbar or using the shortcut Ctrl + E. The red cross on the magnifier button will disappear.

Do not close the ProcMon window!
Run the prepared scenario, collect the data and save the data
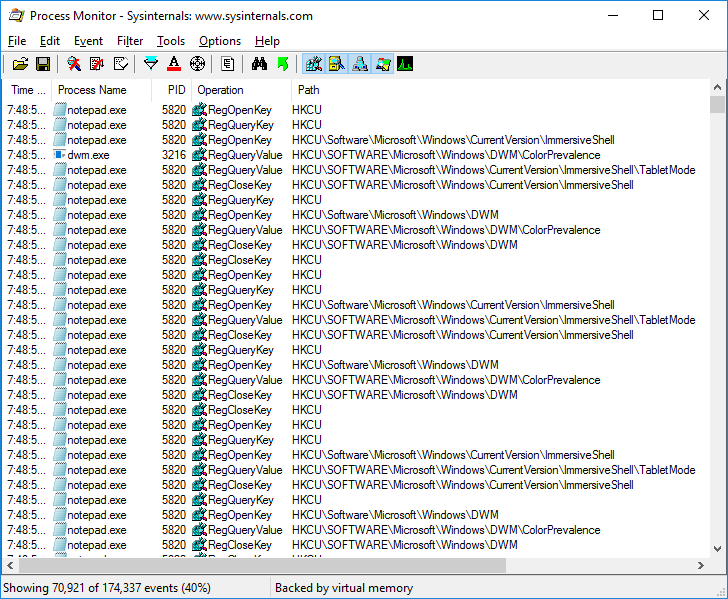
Now you can run the scenario which you want to monitor. As soon as you have finished the scenario, for example, because the issue you want to monitor has occurred, switch back to the ProcMon window and stop the capturing. You will see a very, very long list of events:
The collected data then can be stored to a local file. To do this, press the Save Button from the toolbar (Shortcut Ctrl + S). We recommend using the following options from the Save To Dialog:
- Events to Save: All events
- Format: Native Process Monitor Format (PML)

If you want to send the collected data via E-Mail or to upload the file to a web page, we recommend compressing the PML file, for example using ZIP or a similar archive file format.
Conclusion
This blog post describes how to use the ProcMon tool from Microsoft to collect real-time system activities and how to store them into a PML file. Then, this file can be attached to a customer incident as an additional input for the SAP support.
For more details on ProcMon, please see SAP Note 2346255 - Usage of the ProcessMonitor tool to analyze support issues for SAP NetWeaver Application S....
