
- SAP Community
- Products and Technology
- Technology
- Technology Blogs by Members
- SAP on Azure: Quantifying your Region Choice
Technology Blogs by Members
Explore a vibrant mix of technical expertise, industry insights, and tech buzz in member blogs covering SAP products, technology, and events. Get in the mix!
Turn on suggestions
Auto-suggest helps you quickly narrow down your search results by suggesting possible matches as you type.
Showing results for
etdittri
Explorer
Options
- Subscribe to RSS Feed
- Mark as New
- Mark as Read
- Bookmark
- Subscribe
- Printer Friendly Page
- Report Inappropriate Content
07-06-2020
4:54 AM
Introduction
In my previous blog, within the context of a Single Global SAP Instance, I have highlighted the significance of choosing the correct Azure region for an SAP system that will be accessed by a geographically dispersed user-base; and touched on a global network strategy, supported by Azure technologies to simply global deployments.
For those customers who are implementing a single global instance of SAP S/4HANA, or who are planning deployment of SAP on Azure with a geographically dispersed userbase, this point-of-view article goes a step further.
This document aims to guide on a best practice process to obtain inputs into defining your Azure Region Strategy and provide a practical analysis method to quantify your Azure region choice for global SAP solutions.

The document covers:
- More detail on the criteria to evaluate the choice of appropriate Azure Region
- The Analysis Model and associated weightings
- Colour-Coding of an Azure Region (including instructions on how to collect latency data)
- Collating the results
In this blog, we will use the example of Contoso Ltd (briefly touched on in the previous blog), and how they have successfully quantified their region choice as part of their SAP on Azure Business Case.
To recap: Contoso Ltd is a fictional company that is planning to centralize all Finance Operations in a new single instance deployment of SAP S/4HANA. They are operating across the globe. Their data sovereignty and security policies dictate that they data cannot be stored in the Asia-Pacific geo.
Contoso requires True Regional DR, whilst minimizing Cloud Infrastructure costs. Their S/4HANA Sizing suggest a HANA requirement of 2.8TB.
This requirement can easily be served by the Azure M-Series virtual machine. Their Front-end Strategy is to minimize the dependence on SAPGUI.
1. Evaluation Criteria
Choosing the most suitable Azure Region for a Single Global SAP instance is a daunting task, but the following evaluation criteria could inform your strategy.
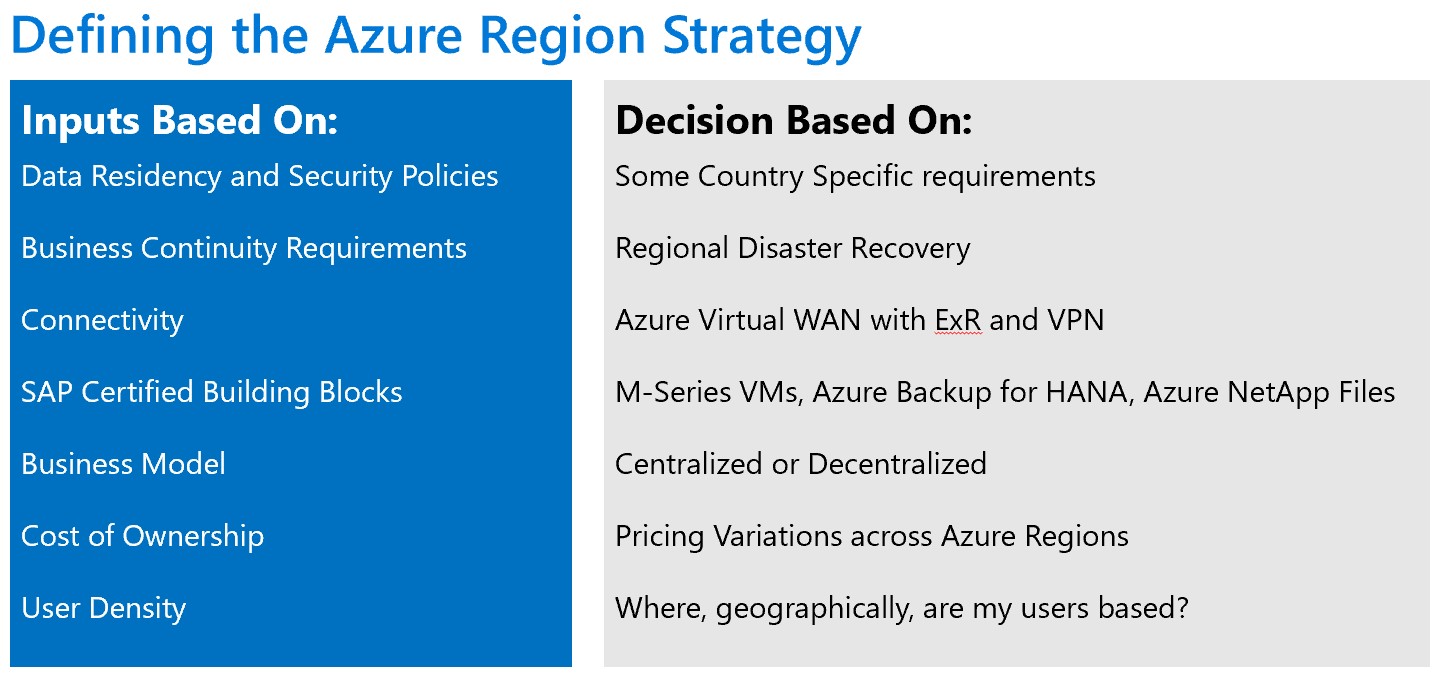
Details on each criteria is provided within my previous blog. Here, each of the criteria is explained below within the context of quantifying the region choice. Not every criterion is as important as the other, and some shape our strategy more so than others. Below is an overview of which criteria will form part of the region analysis.
1.1 Data Residency and Security
This input criterion has the power to override any other success criteria. Neither Microsoft, nor the author of this blog, can be involved with customer decisions, and it is highly recommended that every customer evaluates all Country or Region specifics to identify any blockers that will prohibit a specific Azure Region. We will therefore omit this criterion from the scoring and weighting but keep the ‘override’ control in place.
1.2 Business Continuity
Based on Contoso LTD’s requirement for true Regional DR, the recommendation is to leverage Microsoft’s standard Regional Deployment architecture pattern (Availability Sets for HA – 99.95% with DR across Azure paired regions).
There are no constraints in this evaluation criteria, and all options should score evenly, unless there are missing SAP certified blocks in the default paired region.
1.3 Network Connectivity
Based on Contoso’s requirement to provide the best user experience and ensuring integrations are operating as normal. This input criteria will inform our strategy on two evaluation criteria: End-User Connectivity and Azure Backbone Connectivity (or inter-region connectivity)
- End-User Network connectivity tests will need to be conducted to collect sample data points. These data points will be used in the options analysis under ‘End-User Latencies’. This analysis will resemble a ‘worst case’ scenario.
- Azure inter-region latencies will be evaluated under ‘Azure Backbone Latencies’. This analysis will resemble a ‘best case’ scenario.
1.4 SAP Certified Building Blocks
Contoso’s, S/4HANA solution will be built according to reference architecture for SAP HANA on Virtual Machines. Initial sizing suggests roll-out requirements that are based on Mv1 with projected growth indicating a requirement for Mv2 virtual Machines after 3 years.
This criterion will be used in our analysis, but it will not be scored. See this criterion as a ‘filter’ to reduce the potential number of Azure Region options and to identify the sub-set of Paired Regions that will be scored.
For a region to qualify for analysis, the primary and paired region should both be ‘SAP-Capable’ (i.e have Mv1 and Mv2 Series Virtual Machines available). To view all azure regions and the services they run, please visit: https://azure.microsoft.com/en-us/global-infrastructure/services/
The following table lists the filtering process based on SAP Certified Building Blocks for Contoso.
| Geo | Primary Region | Paired Region | SAP Capable |
| Asia-Pacific | East Asia (Hong Kong) | Southeast Asia (Singapore) | East Asia Mv1 only |
| Australia | Australia East | Australia Southeast | Yes |
| Australia | Australia Central | Australia Central 2 | Mv1 only |
| Brazil | Brazil South | South Central US | Yes |
| Canada | Canada Central | Canada East | Mv1 only |
| China | China North | China East | Mv1 only |
| China | China North 2 | China East 2 | Mv1 only |
| Europe | North Europe (Ireland) | West Europe (Netherlands) | Yes |
| France | France Central | France South | No |
| Germany | Germany Central | Germany Northeast | No |
| India | Central India | South India | Mv1 only |
| India | West India | South India | Mv1 only |
| Japan | Japan East | Japan West | Japan West Mv1 Only |
| Korea | Korea Central | Korea South | Mv1 only |
| Americas | East US | West US | Yes |
| Americas | East US 2 | Central US | Central US Mv1 Only |
| Americas | North Central US | South Central US | Yes |
| Americas | West US 2 | West Central US | No |
| Norway | Norway East | Norway West | Mv2 only |
| South Africa | South Africa North | South Africa West | Mv1 only |
| Switzerland | Switzerland North | Switzerland West | Mv1 only |
| UK | UK West | UK South | UK West Mv1 only |
For illustration purposes, after applying our Mv1 and Mv2 ‘filters’, we now have a subset of 4 geo’s and 8 regions to evaluate:
| Selected Region Scope for Evaluation | ||
| Geo | Region 1 | Region 2 |
| Asia Pacific | East Asia (Hong Kong) | Southeast Asia (Singapore) |
| Australia | Australia East | Australia Southeast |
| Europe | North Europe (Ireland) | West Europe (Netherlands) |
| Americas | East US | West US |
1.5 Business Model
This criterion will be omitted for the evaluation. A single global instance implies a new centralized business model.
1.6 Cost of Ownership
This criterion will form part of the evaluation. However, detailed TCO analysis will not form scope of this specific activity and is usually separate deliverable under a more detailed Architecture Design Session and TCO analysis.
1.7 User Density
For the purpose of this analysis, we are introducing a new metric that we will use to quantify the region choice. User density is simply the number of users in a specific geography. This will be included in the evaluation. The rationale here is that a region in closer proximity to larger user-bases should score higher in the analysis.
2. Analysis Model
To quantify an Azure region choice, we will use a simple, but effective mechanism to guide our decision-making. We will leverage Pugh’s Decision Matrix based on weighted scoring.
As discussed in Section 1, the following criteria will be used to evaluate the best suited region or regions. Note this is a mathematical exercise, and the results can be overridden by Data Sovereignty or Security Principles.
The following graphic summarizes how to build the base analysis model based on short-list of Azure regions to measure on the specific evaluation criteria.

The 3 Azure Regions with the highest weighted score will form the short-list of preferred deployment choice (unless overridden by data considerations)
3. Significance of Criteria: Weightings and Scoring
3.1 Weighting and Scoring
All weightings in the following section are subjective and it is highly recommended that anyone evaluating an Azure Region choice spends time and effort on deciding how significant each of the criteria is to your business. For some customers, cost of ownership could be more significant than others, or other customers might place a higher emphasis on user densities.
Contoso decided to introduce 3 categories of significance. Low, Medium and High, each with a simple multiplier:
- Low Weighted Criteria has a multiplier of 1
- Medium Weighted Criteria has a multiplier of 2
- High Weighted Criteria has a multiplier of 3
Note that each customer should decide what significance and weighting they should apply based on your unique functional and non-functional requirements.
The following section highlights the significance of each evaluation criteria as per Contoso’s requirements.
3.1.1 Business Continuity:
Weighting: Medium
Justification: True regional DR using Azure Paired Regions is a key Non-Functional Requirement
Scoring:
| SAP Capable Region | Points |
| Fully Compliant | 2 |
| Partially Compliant | 1 |
| Non-Compliant | 0 |
3.1.2 Network Connectivity – Azure Backbone Latencies
Weighting: High
Justification: End-User performance across the globe is very important. Contoso requires SAP traffic to traverse the azure backbone securely.
Scoring: Azure inter-region latencies will be scored according to a simple colour-coded region analysis. The colour-coding is explained a bit later.
| Region Colour | Points |
| Red | 1 |
| Amber | 2 |
| Green | 3 |
3.1.3 Network Connectivity – End User Latencies
Rating: High
Justification: End-user latencies represent our worst-case scenario and is very important to Contoso.
Scoring: Azure inter-region latencies will be scored according to a simple colour-coded region analysis. The colour-coding is explained a bit later.
| Region Colour | Points |
| Red | 1 |
| Amber | 2 |
| Green | 3 |
3.1.4 User Density
Rating: Medium
Justification: User density will form part of the evaluation on a geographical level, not a regional level. The following table illustrates the Contoso User distribution based on Geographical Area.
| Geography | User-base | % of Users |
| Asia (Hong Kong) | 50 | 4 |
| Southeast Asia | 700 | 28 |
| Americas | 900 | 36 |
| Europe | 500 | 20 |
| Australia | 300 | 12 |
Scoring: For Contoso’s user density, we will use the following points system to assign scored to region pairs.
| Density | Points |
| Less than 15% of users | 1 |
| Between 15% and 25% | 2 |
| More than 25% of users | 3 |
3.1.5 Cost of Ownership
Rating: Low
Justification: TCO is important to Contoso, but not as important as providing low-latency seamless and pleasant user experiences.
Scoring: Initial Scoring TCO will be based on a rule-of-thumb to create the shortlist of regions. It is highly recommended to complete a detailed consumption model once the shortlist has been established. The scoring for our analysis model does not consider exchange rate fluctuations or customer specific pricing.
| Geography | Points |
| Asia | 1 |
| Europe | 2 |
| US | 3 |
If the scoring is to be challenged, a new scoring mechanism can easily be incorporated. Public statistics are available here:
https://azureprice.net/Home/Region.
4. Color-Coding Regions for Latencies
The colour-coding process allows us to assign a simple score to a specific azure region based on a ‘pseudo triangulation’ and averaging of latencies.
4.1 Azure Backbone Latencies
The subset of regions that Contoso is evaluating was analyzed and color-coded as follows, based on the information Microsoft published here: https://docs.microsoft.com/en-us/azure/networking/azure-network-latency
Step 1: Contoso created a similar matrix based on their subset of regions for evaluation. Each Latency was colour -coded based on the following rationale:
| Red | Yellow | Green | |
| Weighting | 1 | 2 | 3 |
| Latency | >180ms | <180ms | <100ms |
The resulting output:

Step 2: Count the Latency colours
| Latency Colour Count | Red | Yellow | Green |
| East Asia | 3 | 3 | 1 |
| Southeast Asia | 1 | 3 | 3 |
| Australia East | 3 | 2 | 2 |
| Australia Southeast | 3 | 2 | 2 |
| East US | 4 | 0 | 3 |
| West US | 0 | 7 | 1 |
| North Europe | 3 | 2 | 2 |
| West Europe | 3 | 2 | 2 |
Step 3: Weigh up your options and colour-code your result-set
We use a weighted score (again), where red latencies are least favorable (x1), amber latencies the middle ground (x2) and green latencies are most favorable (x3). The result-set is split into the top, medium and lowest scores, and then a colour assigned accordingly.
| Weighted Scores | Red | Yellow | Green | Total | Region Colour |
| East Asia | 3 | 6 | 3 | 12 | red |
| Southeast Asia | 1 | 6 | 9 | 16 | green |
| Australia East | 3 | 4 | 6 | 13 | amber |
| Australia Southeast | 3 | 4 | 6 | 13 | amber |
| East US | 4 | 0 | 9 | 13 | amber |
| gWest US | 0 | 14 | 3 | 17 | green |
| North Europe | 3 | 4 | 6 | 13 | amber |
| West Europe | 3 | 4 | 6 | 13 | amber |
5.10 End User Latencies
To colour-code Azure regions according to end-user latencies, the process will differ slightly from the colour-coding process for Azure inter-region latencies. We will use average latencies measured from end-user locations to each of the regions in our subset that we are analyzing.
4.1.1 Instructions to Collect Connectivity Data
This section provides a step-by-step process on how to collect latency statistics from various Contoso Location to various azure regions.
a) Azure Speed (public latency test tool)
This article uses examples of the data captured and does not represent any specific real-life scenario. It does however provide the reader the ability to conduct a real-life exercise by measuring actual latencies using azurespeed.com, a publicly available latency test utility.
The same results can be achieved by using niping, but that requires a niping server running in each region you would like to analyze. For more detail on niping, please refer to SAP Note 500235 - Network Diagnosis with NIPING
b) Prepare the data capture
The data capture needs to be executed from a collection of representative user locations, such as Headquarters, remote offices and even from mobile workstations (over your corporate VPN as an example)
- Navigate to https://www.azurespeed.com/Azure/Latency
- Select the Regions we have shortlisted above in Section 1.4

- Let the latency test run for approximately two or three minutes
- Scroll down to the ‘Latency Test’ Results

- Lastly, record the results into the ‘End User Data Collection’ sheet as follows before colour coding based on the average latencies.

Note – colour coding end-user latencies based on averages, assumes the following thresholds of average latencies:
- Avg Less than 160ms: Green
- Avg Between 160ms and 200ms: Amber
- Avg More than 200ms: Red
6. Results
6.1 Results disclaimer:
The completed analysis model will contain weighted scores for each region. Please note that neither Microsoft, nor the author of this blog can take responsibility or accountability for the accuracy of the results, as the output of the model greatly depends on customer specific input and weightings.
This blog is purely providing an evaluation model for Contoso to own and use. The majority of the input and scoring, as well as agreeing the specific weightings will fall under Contoso’s responsibility.
6.2 Contoso’s Region Analysis Unit Scores:
After scoring each region against the evaluation criteria, it is important to record your unit scores. The Following graphic illustrates how Contoso has scored each region:

6.3 Contoso’s Region Analysis Weighted Scoring Results:
Contoso has spent a lot of time internally evaluating the significance of each evaluation criteria and assign a multiplier to calculate the weighted scores of each Azure Region. They have also activated the ‘override’ on data sovereignty and security, based on their internal data classification policies which prohibits data to be stored in Southeast Asia.

The results have been calculated, and based on the weighted scoring, West US scored the highest, followed by East US and then Southeast Asia (which incidentally has been vetoed based on the data sovereignty override). The Board has approved West US as Primary Region, with its default paired Region East US for Disaster recovery.

7. Conclusion
Selecting the best azure region for your SAP deployment does not have to be rocket science. Using a simple, weighted scoring analysis, it is now very easy to quantify an Azure Region Choice based on multiple criteria, each which has a different impact to your business.
8. Postscript
The example spreadsheet used in Contoso’s region analysis can be downloaded from GitHub here. All customers can use this as a starting point to start planning your Azure Region Strategy for a globally dispersed user base.
- SAP Managed Tags:
- SAP HANA,
- SAP NetWeaver,
- SAP S/4HANA,
- Cloud
1 Comment
You must be a registered user to add a comment. If you've already registered, sign in. Otherwise, register and sign in.
Labels in this area
-
"automatische backups"
1 -
"regelmäßige sicherung"
1 -
"TypeScript" "Development" "FeedBack"
1 -
505 Technology Updates 53
1 -
ABAP
14 -
ABAP API
1 -
ABAP CDS Views
2 -
ABAP CDS Views - BW Extraction
1 -
ABAP CDS Views - CDC (Change Data Capture)
1 -
ABAP class
2 -
ABAP Cloud
2 -
ABAP Development
5 -
ABAP in Eclipse
1 -
ABAP Platform Trial
1 -
ABAP Programming
2 -
abap technical
1 -
absl
2 -
access data from SAP Datasphere directly from Snowflake
1 -
Access data from SAP datasphere to Qliksense
1 -
Accrual
1 -
action
1 -
adapter modules
1 -
Addon
1 -
Adobe Document Services
1 -
ADS
1 -
ADS Config
1 -
ADS with ABAP
1 -
ADS with Java
1 -
ADT
2 -
Advance Shipping and Receiving
1 -
Advanced Event Mesh
3 -
AEM
1 -
AI
7 -
AI Launchpad
1 -
AI Projects
1 -
AIML
9 -
Alert in Sap analytical cloud
1 -
Amazon S3
1 -
Analytical Dataset
1 -
Analytical Model
1 -
Analytics
1 -
Analyze Workload Data
1 -
annotations
1 -
API
1 -
API and Integration
3 -
API Call
2 -
API security
1 -
Application Architecture
1 -
Application Development
5 -
Application Development for SAP HANA Cloud
3 -
Applications and Business Processes (AP)
1 -
Artificial Intelligence
1 -
Artificial Intelligence (AI)
5 -
Artificial Intelligence (AI) 1 Business Trends 363 Business Trends 8 Digital Transformation with Cloud ERP (DT) 1 Event Information 462 Event Information 15 Expert Insights 114 Expert Insights 76 Life at SAP 418 Life at SAP 1 Product Updates 4
1 -
Artificial Intelligence (AI) blockchain Data & Analytics
1 -
Artificial Intelligence (AI) blockchain Data & Analytics Intelligent Enterprise
1 -
Artificial Intelligence (AI) blockchain Data & Analytics Intelligent Enterprise Oil Gas IoT Exploration Production
1 -
Artificial Intelligence (AI) blockchain Data & Analytics Intelligent Enterprise sustainability responsibility esg social compliance cybersecurity risk
1 -
ASE
1 -
ASR
2 -
ASUG
1 -
Attachments
1 -
Authorisations
1 -
Automating Processes
1 -
Automation
2 -
aws
2 -
Azure
1 -
Azure AI Studio
1 -
Azure API Center
1 -
Azure API Management
1 -
B2B Integration
1 -
Backorder Processing
1 -
Backup
1 -
Backup and Recovery
1 -
Backup schedule
1 -
BADI_MATERIAL_CHECK error message
1 -
Bank
1 -
BAS
1 -
basis
2 -
Basis Monitoring & Tcodes with Key notes
2 -
Batch Management
1 -
BDC
1 -
Best Practice
1 -
bitcoin
1 -
Blockchain
3 -
bodl
1 -
BOP in aATP
1 -
BOP Segments
1 -
BOP Strategies
1 -
BOP Variant
1 -
BPC
1 -
BPC LIVE
1 -
BTP
12 -
BTP Destination
2 -
Business AI
1 -
Business and IT Integration
1 -
Business application stu
1 -
Business Application Studio
1 -
Business Architecture
1 -
Business Communication Services
1 -
Business Continuity
1 -
Business Data Fabric
3 -
Business Partner
12 -
Business Partner Master Data
10 -
Business Technology Platform
2 -
Business Trends
4 -
CA
1 -
calculation view
1 -
CAP
4 -
Capgemini
1 -
CAPM
1 -
Catalyst for Efficiency: Revolutionizing SAP Integration Suite with Artificial Intelligence (AI) and
1 -
CCMS
2 -
CDQ
12 -
CDS
2 -
Cental Finance
1 -
Certificates
1 -
CFL
1 -
Change Management
1 -
chatbot
1 -
chatgpt
3 -
CL_SALV_TABLE
2 -
Class Runner
1 -
Classrunner
1 -
Cloud ALM Monitoring
1 -
Cloud ALM Operations
1 -
cloud connector
1 -
Cloud Extensibility
1 -
Cloud Foundry
4 -
Cloud Integration
6 -
Cloud Platform Integration
2 -
cloudalm
1 -
communication
1 -
Compensation Information Management
1 -
Compensation Management
1 -
Compliance
1 -
Compound Employee API
1 -
Configuration
1 -
Connectors
1 -
Consolidation Extension for SAP Analytics Cloud
2 -
Control Indicators.
1 -
Controller-Service-Repository pattern
1 -
Conversion
1 -
Cosine similarity
1 -
cryptocurrency
1 -
CSI
1 -
ctms
1 -
Custom chatbot
3 -
Custom Destination Service
1 -
custom fields
1 -
Customer Experience
1 -
Customer Journey
1 -
Customizing
1 -
cyber security
3 -
cybersecurity
1 -
Data
1 -
Data & Analytics
1 -
Data Aging
1 -
Data Analytics
2 -
Data and Analytics (DA)
1 -
Data Archiving
1 -
Data Back-up
1 -
Data Flow
1 -
Data Governance
5 -
Data Integration
2 -
Data Quality
12 -
Data Quality Management
12 -
Data Synchronization
1 -
data transfer
1 -
Data Unleashed
1 -
Data Value
8 -
database tables
1 -
Datasphere
3 -
datenbanksicherung
1 -
dba cockpit
1 -
dbacockpit
1 -
Debugging
2 -
Defender
1 -
Delimiting Pay Components
1 -
Delta Integrations
1 -
Destination
3 -
Destination Service
1 -
Developer extensibility
1 -
Developing with SAP Integration Suite
1 -
Devops
1 -
digital transformation
1 -
Documentation
1 -
Dot Product
1 -
DQM
1 -
dump database
1 -
dump transaction
1 -
e-Invoice
1 -
E4H Conversion
1 -
Eclipse ADT ABAP Development Tools
2 -
edoc
1 -
edocument
1 -
ELA
1 -
Embedded Consolidation
1 -
Embedding
1 -
Embeddings
1 -
Employee Central
1 -
Employee Central Payroll
1 -
Employee Central Time Off
1 -
Employee Information
1 -
Employee Rehires
1 -
Enable Now
1 -
Enable now manager
1 -
endpoint
1 -
Enhancement Request
1 -
Enterprise Architecture
1 -
ESLint
1 -
ETL Business Analytics with SAP Signavio
1 -
Euclidean distance
1 -
Event Dates
1 -
Event Driven Architecture
1 -
Event Mesh
2 -
Event Reason
1 -
EventBasedIntegration
1 -
EWM
1 -
EWM Outbound configuration
1 -
EWM-TM-Integration
1 -
Existing Event Changes
1 -
Expand
1 -
Expert
2 -
Expert Insights
2 -
Exploits
1 -
Fiori
14 -
Fiori Elements
2 -
Fiori SAPUI5
12 -
Flask
1 -
Full Stack
8 -
Funds Management
1 -
General
1 -
General Splitter
1 -
Generative AI
1 -
Getting Started
1 -
GitHub
8 -
Grants Management
1 -
GraphQL
1 -
groovy
1 -
GTP
1 -
HANA
6 -
HANA Cloud
2 -
Hana Cloud Database Integration
2 -
HANA DB
2 -
HANA XS Advanced
1 -
Historical Events
1 -
home labs
1 -
HowTo
1 -
HR Data Management
1 -
html5
8 -
HTML5 Application
1 -
Identity cards validation
1 -
idm
1 -
Implementation
1 -
input parameter
1 -
instant payments
1 -
Integration
3 -
Integration Advisor
1 -
Integration Architecture
1 -
Integration Center
1 -
Integration Suite
1 -
intelligent enterprise
1 -
iot
1 -
Java
1 -
job
1 -
Job Information Changes
1 -
Job-Related Events
1 -
Job_Event_Information
1 -
joule
4 -
Journal Entries
1 -
Just Ask
1 -
Kerberos for ABAP
8 -
Kerberos for JAVA
8 -
KNN
1 -
Launch Wizard
1 -
Learning Content
2 -
Life at SAP
5 -
lightning
1 -
Linear Regression SAP HANA Cloud
1 -
Loading Indicator
1 -
local tax regulations
1 -
LP
1 -
Machine Learning
2 -
Marketing
1 -
Master Data
3 -
Master Data Management
14 -
Maxdb
2 -
MDG
1 -
MDGM
1 -
MDM
1 -
Message box.
1 -
Messages on RF Device
1 -
Microservices Architecture
1 -
Microsoft Universal Print
1 -
Middleware Solutions
1 -
Migration
5 -
ML Model Development
1 -
Modeling in SAP HANA Cloud
8 -
Monitoring
3 -
MTA
1 -
Multi-Record Scenarios
1 -
Multiple Event Triggers
1 -
Myself Transformation
1 -
Neo
1 -
New Event Creation
1 -
New Feature
1 -
Newcomer
1 -
NodeJS
3 -
ODATA
2 -
OData APIs
1 -
odatav2
1 -
ODATAV4
1 -
ODBC
1 -
ODBC Connection
1 -
Onpremise
1 -
open source
2 -
OpenAI API
1 -
Oracle
1 -
PaPM
1 -
PaPM Dynamic Data Copy through Writer function
1 -
PaPM Remote Call
1 -
PAS-C01
1 -
Pay Component Management
1 -
PGP
1 -
Pickle
1 -
PLANNING ARCHITECTURE
1 -
Popup in Sap analytical cloud
1 -
PostgrSQL
1 -
POSTMAN
1 -
Prettier
1 -
Process Automation
2 -
Product Updates
4 -
PSM
1 -
Public Cloud
1 -
Python
4 -
python library - Document information extraction service
1 -
Qlik
1 -
Qualtrics
1 -
RAP
3 -
RAP BO
2 -
Record Deletion
1 -
Recovery
1 -
recurring payments
1 -
redeply
1 -
Release
1 -
Remote Consumption Model
1 -
Replication Flows
1 -
research
1 -
Resilience
1 -
REST
1 -
REST API
2 -
Retagging Required
1 -
Risk
1 -
Rolling Kernel Switch
1 -
route
1 -
rules
1 -
S4 HANA
1 -
S4 HANA Cloud
1 -
S4 HANA On-Premise
1 -
S4HANA
3 -
S4HANA_OP_2023
2 -
SAC
10 -
SAC PLANNING
9 -
SAP
4 -
SAP ABAP
1 -
SAP Advanced Event Mesh
1 -
SAP AI Core
8 -
SAP AI Launchpad
8 -
SAP Analytic Cloud Compass
1 -
Sap Analytical Cloud
1 -
SAP Analytics Cloud
4 -
SAP Analytics Cloud for Consolidation
3 -
SAP Analytics Cloud Story
1 -
SAP analytics clouds
1 -
SAP API Management
1 -
SAP BAS
1 -
SAP Basis
6 -
SAP BODS
1 -
SAP BODS certification.
1 -
SAP BTP
21 -
SAP BTP Build Work Zone
2 -
SAP BTP Cloud Foundry
6 -
SAP BTP Costing
1 -
SAP BTP CTMS
1 -
SAP BTP Innovation
1 -
SAP BTP Migration Tool
1 -
SAP BTP SDK IOS
1 -
SAP Build
11 -
SAP Build App
1 -
SAP Build apps
1 -
SAP Build CodeJam
1 -
SAP Build Process Automation
3 -
SAP Build work zone
10 -
SAP Business Objects Platform
1 -
SAP Business Technology
2 -
SAP Business Technology Platform (XP)
1 -
sap bw
1 -
SAP CAP
2 -
SAP CDC
1 -
SAP CDP
1 -
SAP CDS VIEW
1 -
SAP Certification
1 -
SAP Cloud ALM
4 -
SAP Cloud Application Programming Model
1 -
SAP Cloud Integration for Data Services
1 -
SAP cloud platform
8 -
SAP Companion
1 -
SAP CPI
3 -
SAP CPI (Cloud Platform Integration)
2 -
SAP CPI Discover tab
1 -
sap credential store
1 -
SAP Customer Data Cloud
1 -
SAP Customer Data Platform
1 -
SAP Data Intelligence
1 -
SAP Data Migration in Retail Industry
1 -
SAP Data Services
1 -
SAP DATABASE
1 -
SAP Dataspher to Non SAP BI tools
1 -
SAP Datasphere
9 -
SAP DRC
1 -
SAP EWM
1 -
SAP Fiori
3 -
SAP Fiori App Embedding
1 -
Sap Fiori Extension Project Using BAS
1 -
SAP GRC
1 -
SAP HANA
1 -
SAP HCM (Human Capital Management)
1 -
SAP HR Solutions
1 -
SAP IDM
1 -
SAP Integration Suite
9 -
SAP Integrations
4 -
SAP iRPA
2 -
SAP LAGGING AND SLOW
1 -
SAP Learning Class
1 -
SAP Learning Hub
1 -
SAP Master Data
1 -
SAP Odata
2 -
SAP on Azure
2 -
SAP PartnerEdge
1 -
sap partners
1 -
SAP Password Reset
1 -
SAP PO Migration
1 -
SAP Prepackaged Content
1 -
SAP Process Automation
2 -
SAP Process Integration
2 -
SAP Process Orchestration
1 -
SAP S4HANA
2 -
SAP S4HANA Cloud
1 -
SAP S4HANA Cloud for Finance
1 -
SAP S4HANA Cloud private edition
1 -
SAP Sandbox
1 -
SAP STMS
1 -
SAP successfactors
3 -
SAP SuccessFactors HXM Core
1 -
SAP Time
1 -
SAP TM
2 -
SAP Trading Partner Management
1 -
SAP UI5
1 -
SAP Upgrade
1 -
SAP Utilities
1 -
SAP-GUI
8 -
SAP_COM_0276
1 -
SAPBTP
1 -
SAPCPI
1 -
SAPEWM
1 -
sapmentors
1 -
saponaws
2 -
SAPS4HANA
1 -
SAPUI5
5 -
schedule
1 -
Script Operator
1 -
Secure Login Client Setup
8 -
security
9 -
Selenium Testing
1 -
Self Transformation
1 -
Self-Transformation
1 -
SEN
1 -
SEN Manager
1 -
service
1 -
SET_CELL_TYPE
1 -
SET_CELL_TYPE_COLUMN
1 -
SFTP scenario
2 -
Simplex
1 -
Single Sign On
8 -
Singlesource
1 -
SKLearn
1 -
Slow loading
1 -
soap
1 -
Software Development
1 -
SOLMAN
1 -
solman 7.2
2 -
Solution Manager
3 -
sp_dumpdb
1 -
sp_dumptrans
1 -
SQL
1 -
sql script
1 -
SSL
8 -
SSO
8 -
Substring function
1 -
SuccessFactors
1 -
SuccessFactors Platform
1 -
SuccessFactors Time Tracking
1 -
Sybase
1 -
system copy method
1 -
System owner
1 -
Table splitting
1 -
Tax Integration
1 -
Technical article
1 -
Technical articles
1 -
Technology Updates
14 -
Technology Updates
1 -
Technology_Updates
1 -
terraform
1 -
Threats
2 -
Time Collectors
1 -
Time Off
2 -
Time Sheet
1 -
Time Sheet SAP SuccessFactors Time Tracking
1 -
Tips and tricks
2 -
toggle button
1 -
Tools
1 -
Trainings & Certifications
1 -
Transformation Flow
1 -
Transport in SAP BODS
1 -
Transport Management
1 -
TypeScript
3 -
ui designer
1 -
unbind
1 -
Unified Customer Profile
1 -
UPB
1 -
Use of Parameters for Data Copy in PaPM
1 -
User Unlock
1 -
VA02
1 -
Validations
1 -
Vector Database
2 -
Vector Engine
1 -
Visual Studio Code
1 -
VSCode
2 -
VSCode extenions
1 -
Vulnerabilities
1 -
Web SDK
1 -
work zone
1 -
workload
1 -
xsa
1 -
XSA Refresh
1
- « Previous
- Next »
Related Content
- First hand experience at SAP Build Code - Learn, Try it out, Get a badge, SAP Discovery Centre in Technology Blogs by SAP
- BCP: Business Continuity Planning for SAP S/4HANA - made easy with Enterprise Blockchain 🚀 in Technology Blogs by Members
- What's New in the Newly Repackaged SAP Integration Suite, advanced event mesh in Technology Blogs by SAP
- SAP Enterprise Architecture: Let the Use Case find the Blockchain🚀 in Technology Blogs by Members
- Solution for Rubik’s Cube of E-Invoicing in SAP Document and Reporting Compliance in Technology Blogs by Members
Top kudoed authors
| User | Count |
|---|---|
| 8 | |
| 5 | |
| 5 | |
| 4 | |
| 4 | |
| 4 | |
| 4 | |
| 3 | |
| 3 | |
| 3 |