How to
export your synthetic user monitoring data from
SAP Focused Run into your SAP Analytics Cloud tenant via OData APIs to manage your
service level objectives.

Synthetic User Monitoring (SUM) of
SAP Focused RUN and
SAP Analytics Cloud gives you the perfect operations platform to ensure that your critical business-applications perform as expected and meet service level objectives for end-user performances:
- Synthetic User Monitoring: Measure and monitor applications performance.
- Operation Control Center: Display aggregated views for applications performance.
- SAP Analytics Cloud: Build service level report distributed in your organisation.
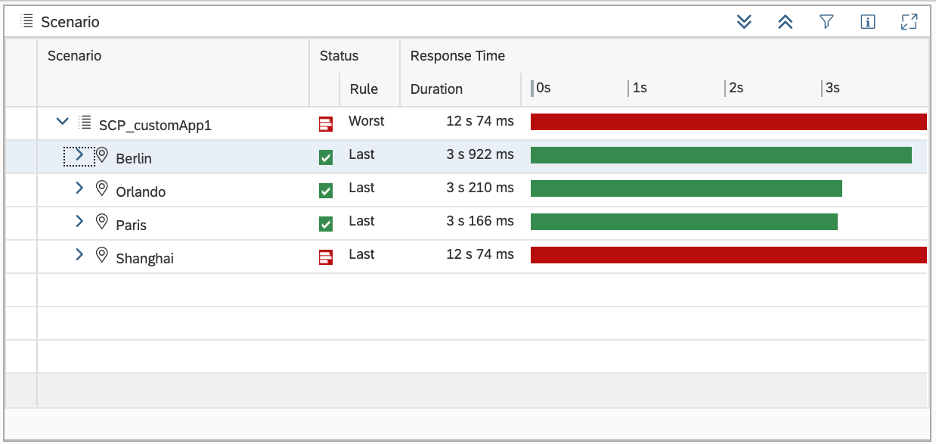
Step 1: Create an OCC Dashboard
Synthetic User Monitoring (SUM) data are visualised in an OCC dashboard with corresponding service level objectives:

Step 2: Connect to the OData interfaces
To build SLR reports in the SAP Analytics Cloud, Synthetic User Monitoring (SUM) data are exported to your SLR platform by using the
OData interfaces of your Focused RUN systems:
- /sap/opu/odata/sap/frn_fi_dp_srv
Looking at the
metadata of the OData interface, we can see that several entity set are defined:
- http(s)://<frunhost>:<frunport>/sap/opu/odata/sap/frn_fi_dp_srv/$metadata
The OData entity
SeriesSac is designed for SAP Analytics Cloud export model.

The OData Service requires two parameters:
IdDashboard,
IdGadget with the following format:
- http(s)://<frunhost>:<frunport>/sap/opu/odata/sap/frn_fi_dp_srv/SeriesSacSet?$filter=IdDashboard eq '<Page Id>' and IdGadget eq '<View Id>'
Step 3: Select the OData parameters
To retrieve the two key properties, after creating a gadget, you should enable the “
discoverable” flag in the personalisation tab of your OCC dashboard.
The key properties are accessible via the key icon to save two information:
Paged Id and
View Id:

Step 4: Retrieve the OData Dimensions values
The EntitySet with name “
SeriesSacSet” is an instance of the EntityType “SeriesSac” with the following
dimensions:

Common Time Dimensions
Name |
Description |
Resolution |
Gadget’s resolution (YEAR, MONTH, WEEK, DAY, HOUR) |
Timestamp |
Timestamp corresponding to one single data point of a time series, with format YYYYMMDDHHMNSS
- If gadget’s resolution is YEAR => YYYY0101000000
- If gadget’s resolution is MONTH => YYYYMM01000000
- If gadget’s resolution is WEEK => YYYYMMDD000000 (where DD is the 1st day of the week)
- If gadget’s resolution is DAY or below => YYYYMMDD000000
|
Date |
Day corresponding to one or several data points of a time series, with format: YYYYMMDD
- If gadget’s resolution is YEAR => YYYY
- If gadget’s resolution is MONTH => YYYYMM
- If gadget’s resolution is WEEK => YYYYMMDD (where DD is the 1st day of the week)
- If gadget’s resolution is DAY or below => YYYYMMDD
|
Week |
If gadget’s resolution is WEEK, HOUR, DAY or RAW, this dimension contains the week number of a data point; it is empty otherwise. |
Week Day |
If gadget’s resolution is DAY or below, this dimension contains the week day number of a data point; it is empty otherwise. |
Hour |
If gadget’s resolution is HOUR or below, this dimension contains the hour (00-23); it is empty otherwise. Hour under 10 start with character ‘0’ to guaranty correct sorting in the charts |
Common Dimensions
Name |
Description |
Filter |
Dashboard Id |
Unique id of the dashboard |
Yes |
Dashboard Title |
Title of the dashboard |
|
Gadget Id |
Unique id of the gadget |
Yes |
Gadget Title |
Title of the gadget |
|
Name |
OCC query legend |
|
Query Number |
Position of the OCC query in the gadget, starting from 1 (only visible queries are exported) |
|
Source |
Technical name of the data provider used by the OCC query |
|
G2Y |
Parameter G2Y in the OCC Query |
|
Y2R |
Parameter Y2R in the OCC Query |
|
Trend |
Attribute TREND of OCC query |
|
Aggregation |
Attribute SLA of OCC query |
|
Value |
Value of the data point |
|
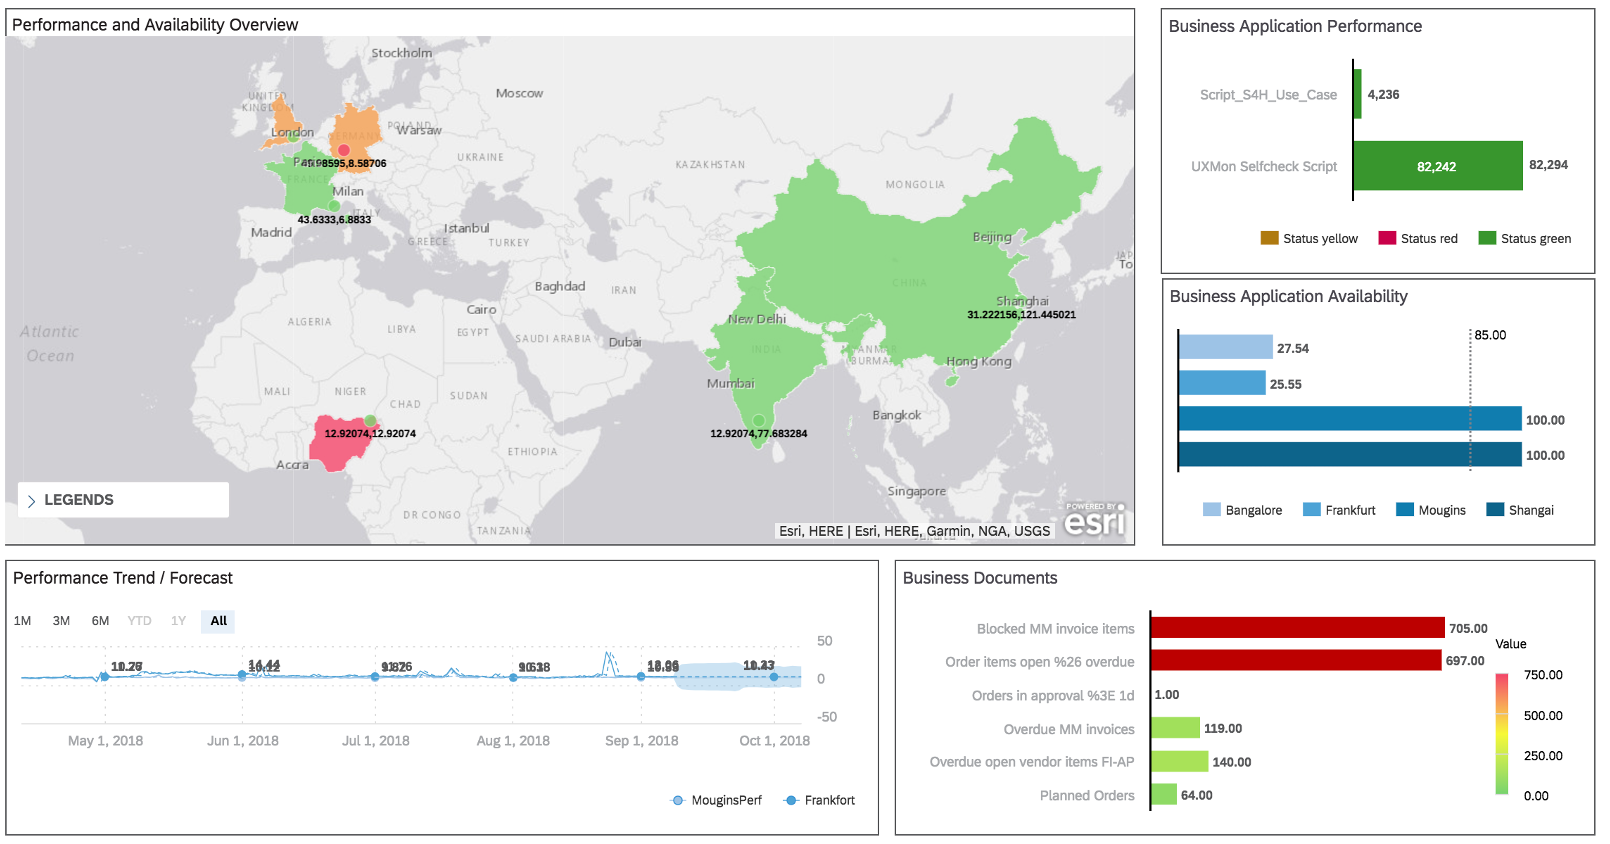
Step 5: Create a SAP Analytics Cloud story
From your SAP Analytic Cloud tenant, you can consume the OData service to create your custom story to manage your service level objectives.
Related blogs:
https://blogs.sap.com/2020/04/08/application-performance-monitoring-with-focused-run/
Thanks for reading.
