
- SAP Community
- Products and Technology
- Enterprise Resource Planning
- ERP Blogs by Members
- S/4 Hana Embedded Analytics Applications
Enterprise Resource Planning Blogs by Members
Gain new perspectives and knowledge about enterprise resource planning in blog posts from community members. Share your own comments and ERP insights today!
Turn on suggestions
Auto-suggest helps you quickly narrow down your search results by suggesting possible matches as you type.
Showing results for
former_member68
Discoverer
Options
- Subscribe to RSS Feed
- Mark as New
- Mark as Read
- Bookmark
- Subscribe
- Printer Friendly Page
- Report Inappropriate Content
06-04-2020
4:41 PM
PURPOSE
The purpose of this blog is to share the embedded analytic capabilities leveraging basic applications to shape of embedded analytics. This blog will guide you how to use Fiori tools or frameworks in order to create interactive and responsive applications based on specific LOBs.
INTRODUCTION
S/4 HANA embedded analytics is direct real-time analysis in S/4 HANA using Fiori applications, which means it enables operational reporting on live transactional data.
Modern User Interface, Fiori is a set of role-based applications that provide real time analytics on S4 HANA by consuming core data services. The consumption of these CDS views is controlled using annotations and O-data services used as data providers to the applications. Annotations are additional metadata enrich CDS data models with further information’s. CDS views exposed as O-data services and are.
There are number of Fiori framework and tools, but here I will touch base only the basic frameworks being used
In order to leverage embedded analytical capability, basic frameworks provided are:
1) Smart Business Framework
2) Analysis Path Framework
SMART BUSINESS FRAMEWORK
SAP Smart Business cockpit is framework of analytical offering by SAP, providing user insight in operational data Users can analyze on this KPIs /OPIs and use its drilling down capabilities with specific dimensions in a definite Line of business.Bringing together the Analytic content from multiple Business system be it on premise or on demand into one single launchpad
SAP Smart Business provides predefined scenarios for different LOBs and industry with import KPIs for business users. In addition, it provides customer the provision to define their own KPIs. Smart business provides a set of fiori applications to define KPIs, evaluations and drill down configurations
There are two section in smart business.
KPI Modeler
KPI Modeler is a tool, which comprise of bunch of applications enabling user to design their KPI tiles and provide a fair space to manipulate or calculate these Key performance Indicators according to market changes or current usages immediately.
These designing consumes the Core data services from the ABAP Stack as a data source in order to reuse the same for new reporting requirements on fiori.The data models (VDMs) defined at ABAP Layer can be using information views from HANA database directly or Core data services defined implicitly on purpose of SAP data source extractor.
Elements and Control point
Steps for building a Smart Business KPI framework
How to build KPI tiles
ANALYSIS PATH FRAMEWORK
Analysis Path Framework (APF) is an easy to use tool helps build and enhance interactive data explorations, basically bridging the gap between analytics and operations. These applications are only configurable and can be run on the fly provided a data model is defined already. Configurations can be done based on a given data model (from VDM) in its Modeler.
Most interesting fact about APF isn’t limited to the NetWeaver (operational data), can be leveraged on top of BW on HANA (Strategical data).APF can use below data sources to consume OData
APF Configuration Modeler
The APF modeler is an application offered by SAP allows you to create your own APF application in classic ways:
Business users could navigate data iteratively by configuring an analysis paths with a series of steps. Data selections can be done through the Filter facets or from the specific analysis step on the fly. When a selection are done to a specific Analysis step, all the subsequent steps are effected and reduced with selections done in prior step. Users can interactively explore data step by step and investigate the root causes.
Elements and Control Point
Build own application
SUMMARY AND CONCLUSION
Thanks for reading .
Enjoy Analytics embedded in S/4 HANA!
The purpose of this blog is to share the embedded analytic capabilities leveraging basic applications to shape of embedded analytics. This blog will guide you how to use Fiori tools or frameworks in order to create interactive and responsive applications based on specific LOBs.
INTRODUCTION
S/4 HANA embedded analytics is direct real-time analysis in S/4 HANA using Fiori applications, which means it enables operational reporting on live transactional data.
Modern User Interface, Fiori is a set of role-based applications that provide real time analytics on S4 HANA by consuming core data services. The consumption of these CDS views is controlled using annotations and O-data services used as data providers to the applications. Annotations are additional metadata enrich CDS data models with further information’s. CDS views exposed as O-data services and are.
There are number of Fiori framework and tools, but here I will touch base only the basic frameworks being used
In order to leverage embedded analytical capability, basic frameworks provided are:
1) Smart Business Framework
2) Analysis Path Framework
SMART BUSINESS FRAMEWORK
SAP Smart Business cockpit is framework of analytical offering by SAP, providing user insight in operational data Users can analyze on this KPIs /OPIs and use its drilling down capabilities with specific dimensions in a definite Line of business.Bringing together the Analytic content from multiple Business system be it on premise or on demand into one single launchpad
SAP Smart Business provides predefined scenarios for different LOBs and industry with import KPIs for business users. In addition, it provides customer the provision to define their own KPIs. Smart business provides a set of fiori applications to define KPIs, evaluations and drill down configurations
There are two section in smart business.
- Runtime (KPI Tile and Drilldown) - SAP provides E2E insight action scenarios based on Real time KPIs for Business users where they have flexibility to do their analysis based on predefined datasets
- Design time (KPI Modeler) - In order to simplify KPI Solutions, SAP provides no. of Fiori apps for modelling of KPI allowing users to define and adapt smart business content.
KPI Modeler
KPI Modeler is a tool, which comprise of bunch of applications enabling user to design their KPI tiles and provide a fair space to manipulate or calculate these Key performance Indicators according to market changes or current usages immediately.
These designing consumes the Core data services from the ABAP Stack as a data source in order to reuse the same for new reporting requirements on fiori.The data models (VDMs) defined at ABAP Layer can be using information views from HANA database directly or Core data services defined implicitly on purpose of SAP data source extractor.

Elements and Control point
- Responsiveness - Smart Business pages are responsive and supported best on desktop computers
- Layout - The page consists of an object header and a chart area.
- Tiles - Main area to be customized.
- Chart container - Provides a toolbar with generic functions for tables and charts based on the Viz Frame control
- Interactions - At the top right side contains the name of the KPI and the filter symbol, which is filter are allows to filter runtime or while configuring.In the header area the name of the evaluation, the aggregated KPI, and tiles with micro charts are displayed.Mini chart are the other tiles display information on separate KPIs that might be related or of interest. By clicking on these tiles, the user can navigate to the respective KPIs.The chart area below has a toolbar at its top offering standard interactions. You can switch between different views, chart types and toggle with legend.
- Visualization - The graphical representation of the reporting properties visible to Business user on the fly.

Steps for building a Smart Business KPI framework
- First define a KPI (use o-data services, entity set and the measure value)
- Evaluate KPI Definition
- Configure the Tile
- Configure the Drilldown
- Publish to Fiori Catalog
How to build KPI tiles
ANALYSIS PATH FRAMEWORK
Analysis Path Framework (APF) is an easy to use tool helps build and enhance interactive data explorations, basically bridging the gap between analytics and operations. These applications are only configurable and can be run on the fly provided a data model is defined already. Configurations can be done based on a given data model (from VDM) in its Modeler.
Most interesting fact about APF isn’t limited to the NetWeaver (operational data), can be leveraged on top of BW on HANA (Strategical data).APF can use below data sources to consume OData
- Calculation views
- ABAP CDS views
- BW OData queries
APF Configuration Modeler
The APF modeler is an application offered by SAP allows you to create your own APF application in classic ways:
- Create own app from scratch as a fiori app
- Import from other fiori apps
- Import SAP APF content and adapt them
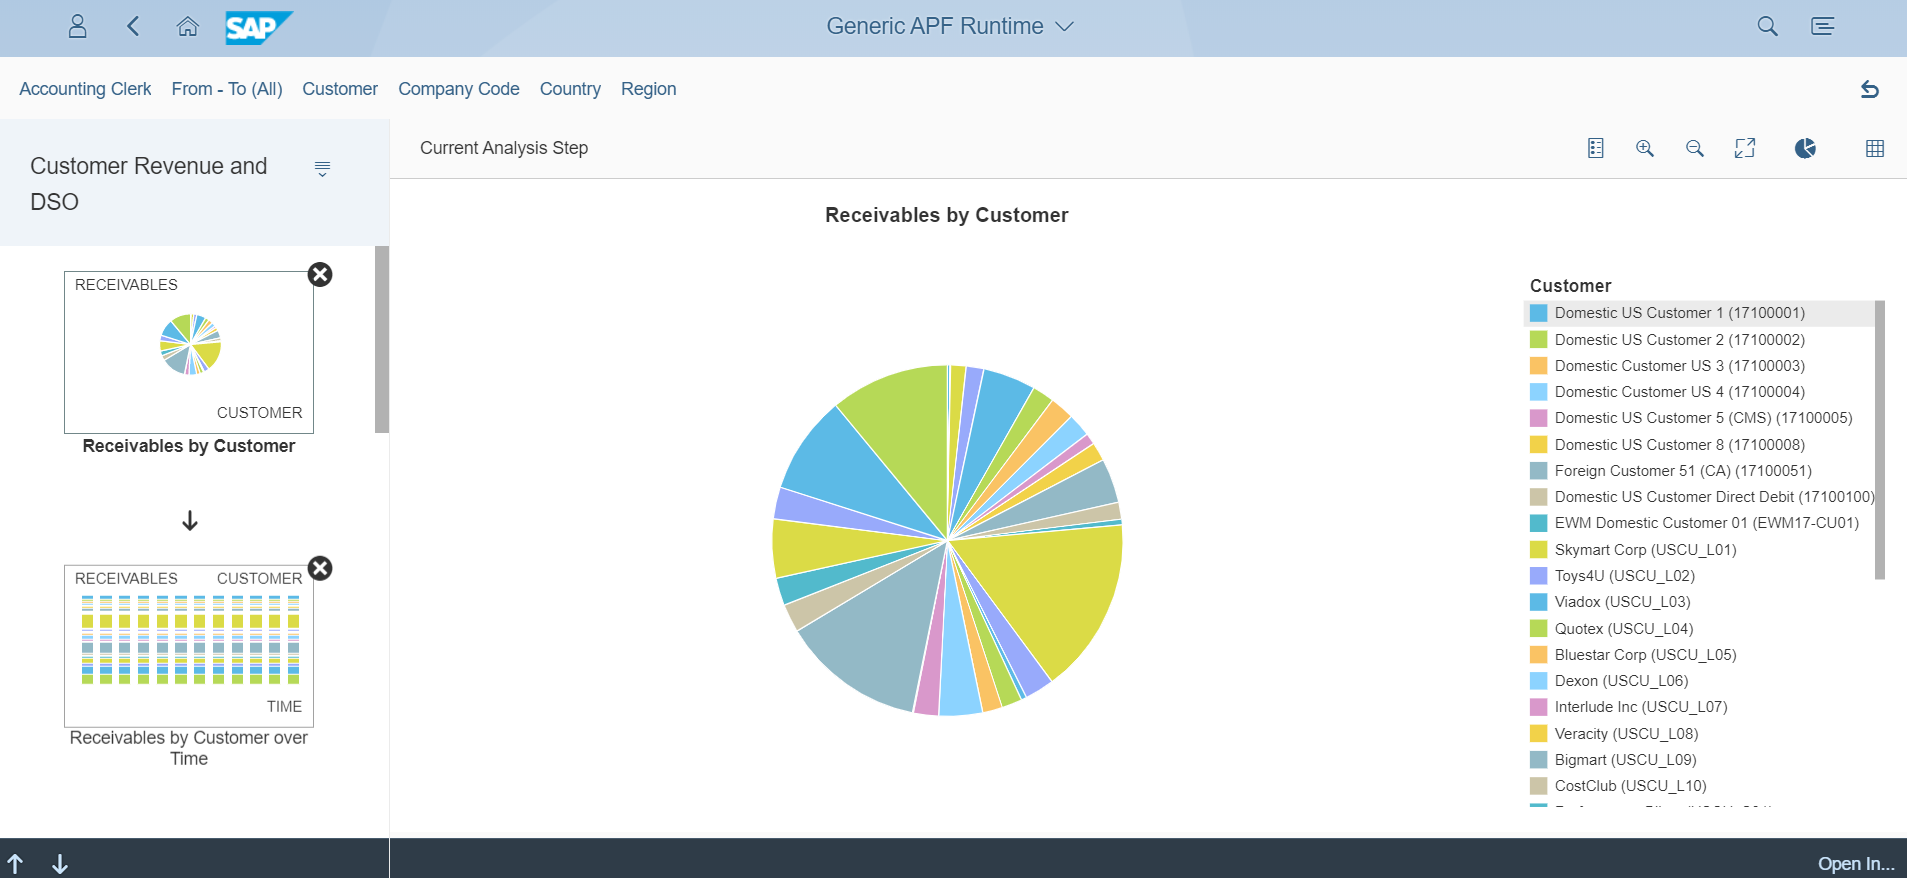
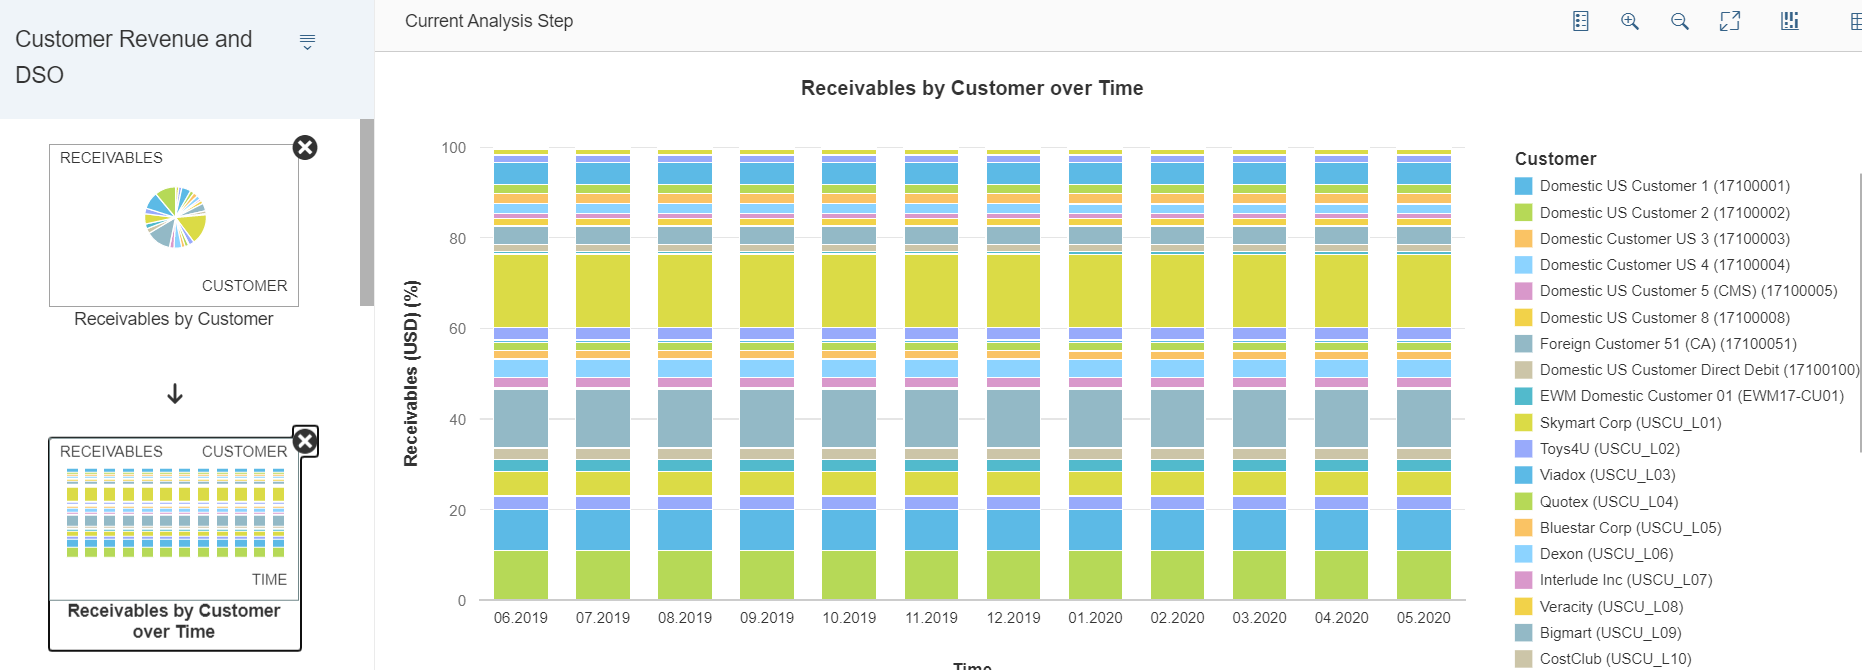
Business users could navigate data iteratively by configuring an analysis paths with a series of steps. Data selections can be done through the Filter facets or from the specific analysis step on the fly. When a selection are done to a specific Analysis step, all the subsequent steps are effected and reduced with selections done in prior step. Users can interactively explore data step by step and investigate the root causes.
Elements and Control Point
- Response and adaptability
- APF-based apps are responsive and supported on both desktop or tablet devices.
- Layout of the page
- The header area incorporates the filter sections, toolbar and the title of the application
- Analysis path display - UI area where thumbnails of all analysis steps are displayed
- The analysis step display – UI area where charts or tables for definite step is displayed
- The footer toolbar – Any further navigation to other applications is possible
- Interactions between charts
- Smart filter bars or individual filters when applied result to a generic restriction applied to all analysis path.
- The analysis path display is the area which gives a snapshot to all analysis steps that are defined in form of thumbnails. Helps users toggled between the steps.
- Analysis path display area gives a full picture of the analysis path selected from the set of thumbnails
- Add Analysis step button opens the gallery of the category, its included mini steps and representations giving a flexible parameter to add further steps on the fly
- Analysis Path can be created saved deleted and printed from APF runtime.
- Configurations and mapping
- Configuration tile’s main frames are Filters, Categories and Navigation targets
- Filter can be configurable either by an individual filter or a smart filter bar
- Configuring a tile is easy by adding your own category and representations
- Category is the set of related step build on O-data services (data-source) to display the data based on graphical representations. O-data request handling is taken care by APF automatically
- Content app prebuilt by SAP can be very well imported and extend it as per one’s need.
- Integration with Others
- Integration and navigation to other Fiori applications are feasible with APF
- Smart Business Framework allows launching of APF based application can be launched as a part Smart Business framework. Filter defined in Smart KPI could be handed over parameter for APF based applications.
- APF gives a flexibility configuring navigation Targets, allowing user jump other applications to view additional information of interest or to act in transactional Apps.
Build own application
SUMMARY AND CONCLUSION
- SAP S/4HANA embedded analytics is the collection of all analytics features in S/4HANA that enables operational reporting on live data.
- In order to leverage embedded analytical capability SAP provides fiori framework
- A complete overview on frameworks like smart business and Analysis path framework
- Build or create own fiori applications leveraging these frameworks
- Consumption of CDS views is controlled using “annotations” and there are analytics specific annotations and o data services.
Thanks for reading .
Enjoy Analytics embedded in S/4 HANA!
- SAP Managed Tags:
- SAP Fiori,
- SAP S/4HANA,
- SAP S/4HANA Embedded Analytics
3 Comments
You must be a registered user to add a comment. If you've already registered, sign in. Otherwise, register and sign in.
Labels in this area
-
"mm02"
1 -
A_PurchaseOrderItem additional fields
1 -
ABAP
1 -
ABAP Extensibility
1 -
ACCOSTRATE
1 -
ACDOCP
1 -
Adding your country in SPRO - Project Administration
1 -
Advance Return Management
1 -
AI and RPA in SAP Upgrades
1 -
Approval Workflows
1 -
ARM
1 -
ASN
1 -
Asset Management
1 -
Associations in CDS Views
1 -
auditlog
1 -
Authorization
1 -
Availability date
1 -
Azure Center for SAP Solutions
1 -
AzureSentinel
2 -
Bank
1 -
BAPI_SALESORDER_CREATEFROMDAT2
1 -
BRF+
1 -
BRFPLUS
1 -
Bundled Cloud Services
1 -
business participation
1 -
Business Processes
1 -
CAPM
1 -
Carbon
1 -
Cental Finance
1 -
CFIN
1 -
CFIN Document Splitting
1 -
Cloud ALM
1 -
Cloud Integration
1 -
condition contract management
1 -
Connection - The default connection string cannot be used.
1 -
Custom Table Creation
1 -
Customer Screen in Production Order
1 -
Data Quality Management
1 -
Date required
1 -
Decisions
1 -
desafios4hana
1 -
Developing with SAP Integration Suite
1 -
Direct Outbound Delivery
1 -
DMOVE2S4
1 -
EAM
1 -
EDI
2 -
EDI 850
1 -
EDI 856
1 -
EHS Product Structure
1 -
Emergency Access Management
1 -
Energy
1 -
EPC
1 -
Find
1 -
FINSSKF
1 -
Fiori
1 -
Flexible Workflow
1 -
Gas
1 -
Gen AI enabled SAP Upgrades
1 -
General
1 -
generate_xlsx_file
1 -
Getting Started
1 -
HomogeneousDMO
1 -
IDOC
2 -
integration
1 -
Learning Content
2 -
LogicApps
2 -
low touchproject
1 -
Maintenance
1 -
management
1 -
Material creation
1 -
Material Management
1 -
MD04
1 -
MD61
1 -
methodology
1 -
Microsoft
2 -
MicrosoftSentinel
2 -
Migration
1 -
MRP
1 -
MS Teams
2 -
MT940
1 -
Newcomer
1 -
Notifications
1 -
Oil
1 -
open connectors
1 -
Order Change Log
1 -
ORDERS
2 -
OSS Note 390635
1 -
outbound delivery
1 -
outsourcing
1 -
PCE
1 -
Permit to Work
1 -
PIR Consumption Mode
1 -
PIR's
1 -
PIRs
1 -
PIRs Consumption
1 -
PIRs Reduction
1 -
Plan Independent Requirement
1 -
Premium Plus
1 -
pricing
1 -
Primavera P6
1 -
Process Excellence
1 -
Process Management
1 -
Process Order Change Log
1 -
Process purchase requisitions
1 -
Product Information
1 -
Production Order Change Log
1 -
Purchase requisition
1 -
Purchasing Lead Time
1 -
Redwood for SAP Job execution Setup
1 -
RISE with SAP
1 -
RisewithSAP
1 -
Rizing
1 -
S4 Cost Center Planning
1 -
S4 HANA
1 -
S4HANA
3 -
Sales and Distribution
1 -
Sales Commission
1 -
sales order
1 -
SAP
2 -
SAP Best Practices
1 -
SAP Build
1 -
SAP Build apps
1 -
SAP Cloud ALM
1 -
SAP Data Quality Management
1 -
SAP Maintenance resource scheduling
2 -
SAP Note 390635
1 -
SAP S4HANA
2 -
SAP S4HANA Cloud private edition
1 -
SAP Upgrade Automation
1 -
SAP WCM
1 -
SAP Work Clearance Management
1 -
Schedule Agreement
1 -
SDM
1 -
security
2 -
Settlement Management
1 -
soar
2 -
SSIS
1 -
SU01
1 -
SUM2.0SP17
1 -
SUMDMO
1 -
Teams
2 -
User Administration
1 -
User Participation
1 -
Utilities
1 -
va01
1 -
vendor
1 -
vl01n
1 -
vl02n
1 -
WCM
1 -
X12 850
1 -
xlsx_file_abap
1 -
YTD|MTD|QTD in CDs views using Date Function
1
- « Previous
- Next »
Related Content
- The Role of SAP Business AI in the Chemical Industry. Overview in Enterprise Resource Planning Blogs by SAP
- Futuristic Aerospace or Defense BTP Data Mesh Layer using Collibra, Next Labs ABAC/DAM, IAG and GRC in Enterprise Resource Planning Blogs by Members
- SAP S/4HANA Cloud Extensions with SAP Build Best Practices: An Expert Roundtable in Enterprise Resource Planning Blogs by SAP
- Enhancing Performance in SAP Web Applications: Strategies and Best Practices in Enterprise Resource Planning Blogs by Members
- Demystifying Transformers and Embeddings: Some GenAI Concepts in Enterprise Resource Planning Blogs by SAP
Top kudoed authors
| User | Count |
|---|---|
| 2 | |
| 2 | |
| 2 | |
| 2 | |
| 1 | |
| 1 | |
| 1 | |
| 1 | |
| 1 | |
| 1 |