
- SAP Community
- Products and Technology
- Technology
- Technology Blogs by SAP
- Analyzing Crime in Boston (Pre and Post COVID-19) ...
Technology Blogs by SAP
Learn how to extend and personalize SAP applications. Follow the SAP technology blog for insights into SAP BTP, ABAP, SAP Analytics Cloud, SAP HANA, and more.
Turn on suggestions
Auto-suggest helps you quickly narrow down your search results by suggesting possible matches as you type.
Showing results for
jasonyeung
Explorer
Options
- Subscribe to RSS Feed
- Mark as New
- Mark as Read
- Bookmark
- Subscribe
- Printer Friendly Page
- Report Inappropriate Content
05-28-2020
2:12 AM
Last week, I wrote a blog to understand the spread of COVID-19 in Boston and the overall effectiveness of their preventative treatments to help curb the spread. Based on this analysis, my natural next question was to understand the social impact of our shelter-in-place orders. This lead me to wanting to analyze the impact that COVID-19 is having on crime rates. The City of Boston publishes all of their crime data and mass.gov publishes all of their COVID-19 data.
For this analysis, I used both SAP Data Warehouse Cloud and SAP Analytics Cloud to see where the data would take me. For those of you not familiar, SAP Data Warehouse Cloud is SAP's newest enterprise class cloud Data Warehousing solution. It allows you to easily connect, join, and wrangle data together and SAP Analytics Cloud, which is nicely integrated into Data Warehouse Cloud, allows you to ask-and-answer any question in this newly procured data set.
Using SAP Data Warehouse Cloud, I was able to easily combine this crime data with my COVID-19 data model that I had created last week. Starting from the easiest-to-hardest questions, here's what I found...
How many police "incidents" occurred in Boston?
The data set includes all incidents from 2016 and beyond. If you look at the average number of police incidents, you can see that 2020 has a sharp decrease from previous years. 13.5% decrease, to be exact.
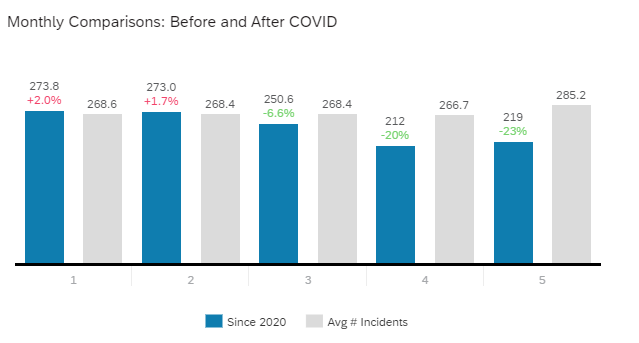
If we drill down by month, we can see a sharp dip in March, April, and May - compared to the same periods in prior years.
And if we wanted to see a longer month-over-month trend, we can easily see that while there's a lot of seasonality to crime incidents, the last three months have been true outliers.
And finally, if we super-impose the number of new COVID-19 cases with the total number of incidents, we can see an interesting trend, in that these lowering crime rates coincided with the rise of COVID-19 cases.
Where and When are these incidents occurring?
Not surprisingly, we can see the same downwards trends across all police districts...
Across all days...
And all times.
So, at an aggregate level, our shelter-in-place orders have dramatically lowered our crime rates. But have they?
Where Has Crime Gone Up?
Below are three charts. The one on the left shows the average number of daily incidents over the past 4 years. The one in the middle shows the average number of daily incidents since March 1st. And the one on the right shows the incidents that have increased the most.
Another way to visualize the data is the following. What's most disturbing is that the incidents that have increased the most (aside from medical assistance) are all assault and disputes related incidents - that pop off the screen.
What Data Variables Lead to Violent Crimes?
The last interesting nugget is that I wanted to use some augmented analytics capabilities to understand which variables lead to higher and more violent crimes - to make our analysis and our conclusions more relevant. Using SAP's advanced analytics capabilities, I ran a classification algorithm to see which variables (or columns in our data set) were most likely to lead to these types of crimes. In the visual below, we can see that the reporting area, time of day, and street are the three most important variables.

recommending to analyze.
What does this mean?
Data is everywhere and all around us. But without analytics, data is just data. Turning data into analytics with tools like SAP Data Warehouse Cloud and SAP Analytics Cloud helps arms you with actionable information to make better and more informed decisions. For the City of Boston, it can provide a more meaningful way to publicize and to provide transparency into all of the good work that these brave men and women are doing to serve the public.
Want to learn more?
Use the comments sections to ask questions and learn more...
For this analysis, I used both SAP Data Warehouse Cloud and SAP Analytics Cloud to see where the data would take me. For those of you not familiar, SAP Data Warehouse Cloud is SAP's newest enterprise class cloud Data Warehousing solution. It allows you to easily connect, join, and wrangle data together and SAP Analytics Cloud, which is nicely integrated into Data Warehouse Cloud, allows you to ask-and-answer any question in this newly procured data set.
Using SAP Data Warehouse Cloud, I was able to easily combine this crime data with my COVID-19 data model that I had created last week. Starting from the easiest-to-hardest questions, here's what I found...
How many police "incidents" occurred in Boston?
The data set includes all incidents from 2016 and beyond. If you look at the average number of police incidents, you can see that 2020 has a sharp decrease from previous years. 13.5% decrease, to be exact.

If we drill down by month, we can see a sharp dip in March, April, and May - compared to the same periods in prior years.
And if we wanted to see a longer month-over-month trend, we can easily see that while there's a lot of seasonality to crime incidents, the last three months have been true outliers.

And finally, if we super-impose the number of new COVID-19 cases with the total number of incidents, we can see an interesting trend, in that these lowering crime rates coincided with the rise of COVID-19 cases.

Where and When are these incidents occurring?
Not surprisingly, we can see the same downwards trends across all police districts...

Across all days...

And all times.

So, at an aggregate level, our shelter-in-place orders have dramatically lowered our crime rates. But have they?
Where Has Crime Gone Up?
Below are three charts. The one on the left shows the average number of daily incidents over the past 4 years. The one in the middle shows the average number of daily incidents since March 1st. And the one on the right shows the incidents that have increased the most.

Another way to visualize the data is the following. What's most disturbing is that the incidents that have increased the most (aside from medical assistance) are all assault and disputes related incidents - that pop off the screen.

What Data Variables Lead to Violent Crimes?
The last interesting nugget is that I wanted to use some augmented analytics capabilities to understand which variables lead to higher and more violent crimes - to make our analysis and our conclusions more relevant. Using SAP's advanced analytics capabilities, I ran a classification algorithm to see which variables (or columns in our data set) were most likely to lead to these types of crimes. In the visual below, we can see that the reporting area, time of day, and street are the three most important variables.
recommending to analyze.
What does this mean?
Data is everywhere and all around us. But without analytics, data is just data. Turning data into analytics with tools like SAP Data Warehouse Cloud and SAP Analytics Cloud helps arms you with actionable information to make better and more informed decisions. For the City of Boston, it can provide a more meaningful way to publicize and to provide transparency into all of the good work that these brave men and women are doing to serve the public.
Want to learn more?
Use the comments sections to ask questions and learn more...
Labels:
You must be a registered user to add a comment. If you've already registered, sign in. Otherwise, register and sign in.
Labels in this area
-
ABAP CDS Views - CDC (Change Data Capture)
2 -
AI
1 -
Analyze Workload Data
1 -
BTP
1 -
Business and IT Integration
2 -
Business application stu
1 -
Business Technology Platform
1 -
Business Trends
1,661 -
Business Trends
91 -
CAP
1 -
cf
1 -
Cloud Foundry
1 -
Confluent
1 -
Customer COE Basics and Fundamentals
1 -
Customer COE Latest and Greatest
3 -
Customer Data Browser app
1 -
Data Analysis Tool
1 -
data migration
1 -
data transfer
1 -
Datasphere
2 -
Event Information
1,400 -
Event Information
66 -
Expert
1 -
Expert Insights
178 -
Expert Insights
292 -
General
1 -
Google cloud
1 -
Google Next'24
1 -
Kafka
1 -
Life at SAP
784 -
Life at SAP
12 -
Migrate your Data App
1 -
MTA
1 -
Network Performance Analysis
1 -
NodeJS
1 -
PDF
1 -
POC
1 -
Product Updates
4,577 -
Product Updates
336 -
Replication Flow
1 -
RisewithSAP
1 -
SAP BTP
1 -
SAP BTP Cloud Foundry
1 -
SAP Cloud ALM
1 -
SAP Cloud Application Programming Model
1 -
SAP Datasphere
2 -
SAP S4HANA Cloud
1 -
SAP S4HANA Migration Cockpit
1 -
Technology Updates
6,886 -
Technology Updates
415 -
Workload Fluctuations
1
Related Content
- Kyma Integration with SAP Cloud Logging. Part 2: Let's ship some traces in Technology Blogs by SAP
- 体验更丝滑!SAP 分析云 2024.07 版功能更新 in Technology Blogs by SAP
- What’s New in SAP Analytics Cloud Release 2024.08 in Technology Blogs by SAP
- ML- Linear Regression definition , implementation scenarios in HANA in Technology Blogs by Members
- SAP Sustainability Footprint Management: Q1-24 Updates & Highlights in Technology Blogs by SAP
Top kudoed authors
| User | Count |
|---|---|
| 29 | |
| 21 | |
| 10 | |
| 7 | |
| 7 | |
| 6 | |
| 6 | |
| 5 | |
| 5 | |
| 5 |