
- SAP Community
- Products and Technology
- Technology
- Technology Blogs by SAP
- Visualize S/4HANA CDS View with SAP Datasphere
Technology Blogs by SAP
Learn how to extend and personalize SAP applications. Follow the SAP technology blog for insights into SAP BTP, ABAP, SAP Analytics Cloud, SAP HANA, and more.
Turn on suggestions
Auto-suggest helps you quickly narrow down your search results by suggesting possible matches as you type.
Showing results for
Advisor
Options
- Subscribe to RSS Feed
- Mark as New
- Mark as Read
- Bookmark
- Subscribe
- Printer Friendly Page
- Report Inappropriate Content
05-26-2020
5:11 AM
(Japanese version)
In the previous blog, I made a connection to S/4HANA, on premise SAP HANA, and SAP HANA Cloud from the SAP Datasphere.
In this blog, I will visualize the data of CDS Views in S/4HANA through the SAP Datasphere.
I will follow the steps below:
First, select "Data Builder" from the menu icon on the left and select the Space where the connection is created.
Click "New Graphical View" to create a new view.
In the left pane, you can select data sources of the view from both Repository (tables and views on SAP Datasphere) and Sources (objects on the source systems). In this blog, I will select "Sources" to directly connect to CDS View on S/4HANA.
If you select "Sources", the list of defined connections is displayed. Open the S/4HANA connection "S41" and you can see that we can extract data from ABAP tables, BAPI procedures and Extractors.
In addition, when you open "Extractor", you can see that you can select "ABAP CDS View, BW (technical contents), HANA and SAPI (extractors generally used for BW).
When you open "ABAP CDS", you will see folders divided alphabetically and the CDS Views which can extract data (annotation "@Analytics.dataExtraction.enabled" is set to "true") are displayed.
In this blog, I will select "CMMPOITMDX$F - Data Extraction View for PO Item". Drag and drop it into the middle pane.
The CDS View has been imported. Enter "Business Name" and "Technical Name" in the "Properties" on the right. Select"Analytical Dataset" for "Type" and "ON" for "Allow Consumption" to visualize the data.
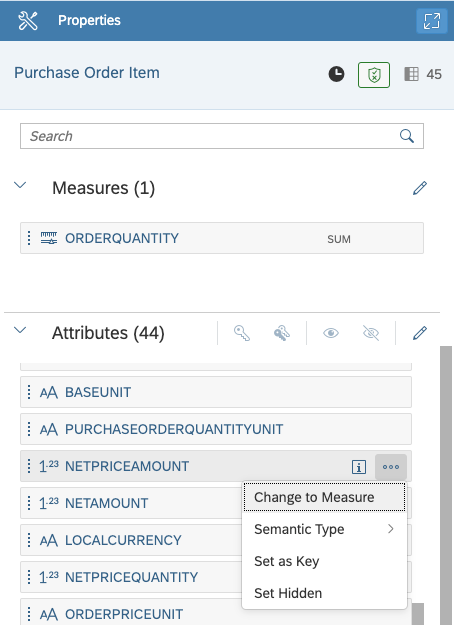
"Measure" is required because it is set to "Analytical Dataset". Set the numerical item to be aggregated / calculated as "Measure". Click the "..." icon on the right of the field name and select "Change to Measure".
Field is set as "Measure". The aggregation type is "SUM" in order to summary the data.
In addition, you can define further configurations such as hierarchy, calculation column, filter, join with other table, etc. However, this blog will leave it as it is, save and deploy it.
Select a target and click "Data Preview" to display a preview of the data. At this point, the data is not stored in the SAP Datasphere, but connect to the source system (S/4HANA) each time.
Click "Preview SQL" to display SQL statement for data preview.
Go back to "Data Builder", the saved "Graphical View" and source tables used by the view are displayed in the list.
You can create a report (story) for the Graphical View created in the previous step. In this case, you will access S/4HANA every time you request data.
On the other hand, you can also replicate the data to SAP Datasphere for better performance. In this blog, I will try to replicate data.
* At present (May 2020), only data replication is possible, but a data flow function is planned to be available within this year (2020), which enables so-called ETL processing that performs data transformation while extracting and loading data.
From the menu icon on the left, select "Data Integration Monitor".
The table you created earlier (the table that references CDS View) is displayed. You can select "Remote" and "Replicated" in the "Data Access" column.
Now change the setting to "Replicate".
You can select "None" and "Real-Time" as the "Data Frequency". Here, I will select 'None'.
Data replication started.
Data replication completed.
Return to the Graphical View again to preview the data. You can see that the data preview can be executed faster.

Finally, create a story using the created Graphical View as a source. Various graphical visualizations are possible using the functions of SAP Analytics Cloud.
In this blog, I will try to create a simple story. Select "Story Builder" from the menu icon on the left. Spaces will be displayed and select the space in which the Graphical View was created.

Click "Create Story" to create a new story.

In the data source selection screen, select the Graphical View which was created before.
You can create story using various components like chart, table, geo map, etc.
In this blog, I will use chart as an example. Select measures and attributes to visualize.
Save the story once completed.
I have introduced the flow of importing S/4HANA CDS View data into SAP Datasphere and visualizing it.
With SAP Datasphere, you have seen that it is possible to create data models, replicate data, and visualize data with a single tool and this enables flexible and quick data visualization and utilization.
This time, we simply visualized one data (one CDS View), but it is also possible to realize complicated data transformation (definition of joins, calculation items, hierarchy definition, etc.) and create more graphical story. I would like to introduce those on another blog.
Overview
In the previous blog, I made a connection to S/4HANA, on premise SAP HANA, and SAP HANA Cloud from the SAP Datasphere.
In this blog, I will visualize the data of CDS Views in S/4HANA through the SAP Datasphere.
I will follow the steps below:
- Create Graphical View
- Replicate data from S/4HANA to SAP Datasphere
- Create a story
1. Create Graphical View
First, select "Data Builder" from the menu icon on the left and select the Space where the connection is created.

Click "New Graphical View" to create a new view.

In the left pane, you can select data sources of the view from both Repository (tables and views on SAP Datasphere) and Sources (objects on the source systems). In this blog, I will select "Sources" to directly connect to CDS View on S/4HANA.
If you select "Sources", the list of defined connections is displayed. Open the S/4HANA connection "S41" and you can see that we can extract data from ABAP tables, BAPI procedures and Extractors.
In addition, when you open "Extractor", you can see that you can select "ABAP CDS View, BW (technical contents), HANA and SAPI (extractors generally used for BW).

When you open "ABAP CDS", you will see folders divided alphabetically and the CDS Views which can extract data (annotation "@Analytics.dataExtraction.enabled" is set to "true") are displayed.

In this blog, I will select "CMMPOITMDX$F - Data Extraction View for PO Item". Drag and drop it into the middle pane.

The CDS View has been imported. Enter "Business Name" and "Technical Name" in the "Properties" on the right. Select"Analytical Dataset" for "Type" and "ON" for "Allow Consumption" to visualize the data.

"Measure" is required because it is set to "Analytical Dataset". Set the numerical item to be aggregated / calculated as "Measure". Click the "..." icon on the right of the field name and select "Change to Measure".
Field is set as "Measure". The aggregation type is "SUM" in order to summary the data.

In addition, you can define further configurations such as hierarchy, calculation column, filter, join with other table, etc. However, this blog will leave it as it is, save and deploy it.

Select a target and click "Data Preview" to display a preview of the data. At this point, the data is not stored in the SAP Datasphere, but connect to the source system (S/4HANA) each time.

Click "Preview SQL" to display SQL statement for data preview.

Go back to "Data Builder", the saved "Graphical View" and source tables used by the view are displayed in the list.

2. Replicate Data
You can create a report (story) for the Graphical View created in the previous step. In this case, you will access S/4HANA every time you request data.
On the other hand, you can also replicate the data to SAP Datasphere for better performance. In this blog, I will try to replicate data.
* At present (May 2020), only data replication is possible, but a data flow function is planned to be available within this year (2020), which enables so-called ETL processing that performs data transformation while extracting and loading data.
From the menu icon on the left, select "Data Integration Monitor".
The table you created earlier (the table that references CDS View) is displayed. You can select "Remote" and "Replicated" in the "Data Access" column.
- Remote: Have no data in SAP Datasphere and access the source system every time
- Replicate: Replicate data from source system to SAP Datasphere
Now change the setting to "Replicate".

You can select "None" and "Real-Time" as the "Data Frequency". Here, I will select 'None'.
- None : Stores the data as a snapshot. SAP Datasphere will not be updated even if the data source is updated unless the snapshot is updated
- Real-Time : Replicate changes that occur in the source system to SAP Datasphere in real-time

Data replication started.

Data replication completed.

Return to the Graphical View again to preview the data. You can see that the data preview can be executed faster.
3. Create Story
Finally, create a story using the created Graphical View as a source. Various graphical visualizations are possible using the functions of SAP Analytics Cloud.
In this blog, I will try to create a simple story. Select "Story Builder" from the menu icon on the left. Spaces will be displayed and select the space in which the Graphical View was created.
Click "Create Story" to create a new story.
In the data source selection screen, select the Graphical View which was created before.

You can create story using various components like chart, table, geo map, etc.

In this blog, I will use chart as an example. Select measures and attributes to visualize.

Save the story once completed.

Conclusion
I have introduced the flow of importing S/4HANA CDS View data into SAP Datasphere and visualizing it.
With SAP Datasphere, you have seen that it is possible to create data models, replicate data, and visualize data with a single tool and this enables flexible and quick data visualization and utilization.
This time, we simply visualized one data (one CDS View), but it is also possible to realize complicated data transformation (definition of joins, calculation items, hierarchy definition, etc.) and create more graphical story. I would like to introduce those on another blog.
- SAP Managed Tags:
- SAP Analytics Cloud,
- SAP Datasphere,
- SAP S/4HANA
Labels:
1 Comment
You must be a registered user to add a comment. If you've already registered, sign in. Otherwise, register and sign in.
Labels in this area
-
ABAP CDS Views - CDC (Change Data Capture)
2 -
AI
1 -
Analyze Workload Data
1 -
BTP
1 -
Business and IT Integration
2 -
Business application stu
1 -
Business Technology Platform
1 -
Business Trends
1,661 -
Business Trends
88 -
CAP
1 -
cf
1 -
Cloud Foundry
1 -
Confluent
1 -
Customer COE Basics and Fundamentals
1 -
Customer COE Latest and Greatest
3 -
Customer Data Browser app
1 -
Data Analysis Tool
1 -
data migration
1 -
data transfer
1 -
Datasphere
2 -
Event Information
1,400 -
Event Information
65 -
Expert
1 -
Expert Insights
178 -
Expert Insights
282 -
General
1 -
Google cloud
1 -
Google Next'24
1 -
Kafka
1 -
Life at SAP
784 -
Life at SAP
11 -
Migrate your Data App
1 -
MTA
1 -
Network Performance Analysis
1 -
NodeJS
1 -
PDF
1 -
POC
1 -
Product Updates
4,577 -
Product Updates
330 -
Replication Flow
1 -
RisewithSAP
1 -
SAP BTP
1 -
SAP BTP Cloud Foundry
1 -
SAP Cloud ALM
1 -
SAP Cloud Application Programming Model
1 -
SAP Datasphere
2 -
SAP S4HANA Cloud
1 -
SAP S4HANA Migration Cockpit
1 -
Technology Updates
6,886 -
Technology Updates
408 -
Workload Fluctuations
1
Related Content
- Integrate C4P-Resource Management with SAP Analytics Cloud or SAP DataSphere in Technology Blogs by SAP
- SAP Datasphere News in March in Technology Blogs by SAP
- Connect & Visualize: SAP Datasphere with Qlik Sense in Technology Blogs by Members
- Recap — SAP Data Unleashed 2024 in Technology Blogs by Members
- Exploring Datasphere & BW Bridge : Technical Insights in Technology Blogs by Members
Top kudoed authors
| User | Count |
|---|---|
| 13 | |
| 11 | |
| 11 | |
| 10 | |
| 9 | |
| 7 | |
| 6 | |
| 5 | |
| 5 | |
| 5 |