
- SAP Community
- Products and Technology
- Enterprise Resource Planning
- ERP Blogs by Members
- SAP S/4HANA Cloud : Shades of Embedded Analytics i...
Enterprise Resource Planning Blogs by Members
Gain new perspectives and knowledge about enterprise resource planning in blog posts from community members. Share your own comments and ERP insights today!
Turn on suggestions
Auto-suggest helps you quickly narrow down your search results by suggesting possible matches as you type.
Showing results for
taranam
Contributor
Options
- Subscribe to RSS Feed
- Mark as New
- Mark as Read
- Bookmark
- Subscribe
- Printer Friendly Page
- Report Inappropriate Content
05-10-2020
4:11 PM
In continuation to last blog “Key Takeaways on CDS Views : SAP S/4HANA Cloud“ ; in this we will cover Embedded Analytics in SAP S/4HANA Cloud . Using CDS views, we can build dashboards in just 5 mins, that too without any coding with simply drag and drop!! We will also uncover additional features available in Cloud as compared to On Premise version (1909 FPS00).
Now Business users can create apps on the fly using Reporting apps available in SAP S/4HANA Cloud. Let’s quickly go through options available in SAP S/4HANA Cloud and Fiori apps/options that you should be aware of :
In SAP S/4HANA Cloud, with this end users can create reports by simply using drag and drop functionality. From “View Browser” app you can create application over released analytical queries with the ‘Query’ category type. Users can also analyze their data easily via query designer. There are 2 flavors of the same as shown below
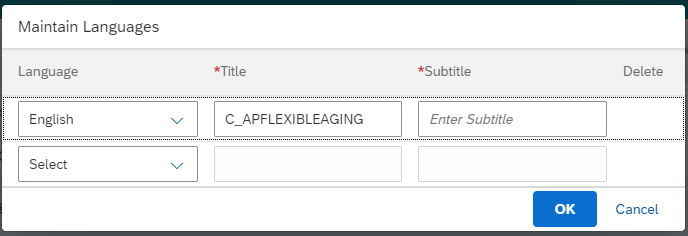
When you click on Create application -> Multi-Dimensional Report; fill in Title and Subtitle.
Once you click on “Ok”; an app id and quick link are generated and available in application ID column. You can click on the application id and assign it to Catalog using “Custom Catalog Extension” app for it to be visible on your FLP.
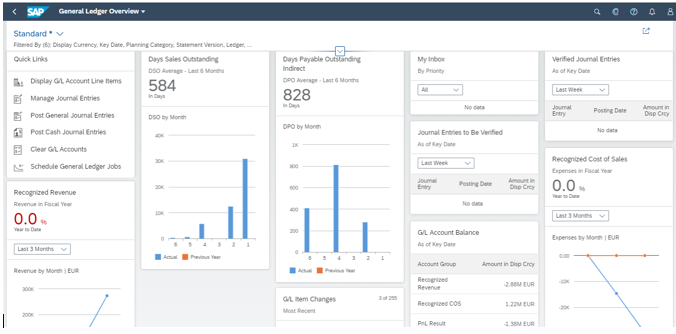
Once the catalog is assigned; you will see the Tile created in the assigned catalog.On clicking tile you will see the report like below.

The Query Browser app displays all the authorized published queries that are created in Custom Analytical Queries app and SAP authorized released queries. You can select any of the query and click on "Open for Analysis". That will open the Query for analysis in Design Studio .

With KPI Modeler the Super-users can define and create Fiori tiles which will contain the Key performance indicators, crucially important to the organization. Single platform for creating all analytical applications using KPIs, reports, and stories.
You can use the Standard KPIs or you can create your own .The app has KPIs , Reports and Stories out of the box as well .
Summary : In this Blog we covered some of Fiori apps that user can leverage to create dashboards in S/4HANA Cloud ... No coding and beautiful reports and dashboards are ready for use using these apps :).
Before we start with Output Management in Cloud ; lets see how it differs from On Premise. Please refer my blog SAP S/4HANA Cloud Output Management: Variations in Cloud vs On Premise for the same.
Regards
Taranam
Now Business users can create apps on the fly using Reporting apps available in SAP S/4HANA Cloud. Let’s quickly go through options available in SAP S/4HANA Cloud and Fiori apps/options that you should be aware of :
Multi-Dimensional Reports:
In SAP S/4HANA Cloud; you have Create Application option but in On-Premise version this option is not there from “View Browser” app.
In SAP S/4HANA Cloud, with this end users can create reports by simply using drag and drop functionality. From “View Browser” app you can create application over released analytical queries with the ‘Query’ category type. Users can also analyze their data easily via query designer. There are 2 flavors of the same as shown below

When you click on Create application -> Multi-Dimensional Report; fill in Title and Subtitle.
Once you click on “Ok”; an app id and quick link are generated and available in application ID column. You can click on the application id and assign it to Catalog using “Custom Catalog Extension” app for it to be visible on your FLP.
Once the catalog is assigned; you will see the Tile created in the assigned catalog.On clicking tile you will see the report like below.

- You can drag and drop dimensions into columns/rows to display the graph.
- You can also download the data from here
- Multi-Dimensional Report using Web Dynpro Template :Both function the same way except that the latter creates applications that support users with special needs. Some of the details or the displays pertaining to the applications may be available to users with screen readers and users of keyboard-only navigation.
Analytical Query :
- In both versions On-Premise as well as Cloud , you can create Analytical Query from Fiori app "View Browser" as well over views where Data Category = Cube/Dimension and Status = Released .
- Or you can create using Fiori app " Custom Analytical Query"
- Or you can use any of standard available analytical queries
- This displays the report in Design Studio
Query Browser:
The Query Browser app displays all the authorized published queries that are created in Custom Analytical Queries app and SAP authorized released queries. You can select any of the query and click on "Open for Analysis". That will open the Query for analysis in Design Studio .
Overview Pages :
- From end user perspective there are pre-delivered Overview Pages which user can use to see the dashboards.You can find all the OVP’s available in Fiori Library by filtering on UI Technology
- SAP Fiori Overview Pages are also extremely flexible and personalizable.
- You can rearrange cards simply by drag and drop
- You can hide cards using Manage cards option from user menu . Click on manage cards will show all the cards for this OVP ; you can hide any unwanted card from here by deselecting radio button .

Manage KPI and Reports
In SAP S/4HANA Cloud; you have "Stories" in addition to KPIs and Reports in "Manage KPI and Reports" fiori app but in On-Premise version this option is not there yet. In SAP S/4HANA Cloud SAC is embedded with 1911 release; for more details refer to very good blog by Rolf here.
Also you don't have the "Data Analyzer" option yet in S/4HANA On Premise version .
With Cloud 2005 SAP is further bringing enhanced navigation with embedded SAC related dashboards/reports. For details check here.
With KPI Modeler the Super-users can define and create Fiori tiles which will contain the Key performance indicators, crucially important to the organization. Single platform for creating all analytical applications using KPIs, reports, and stories.
You can use the Standard KPIs or you can create your own .The app has KPIs , Reports and Stories out of the box as well .

- Generic Drilldown: To create drilldown based on KPI ; you can create Report of generic drill down that makes use of custom/standard KPIs.
- ALP is an SAP Fiori element which uses business key performance indicators to create analytical dashboards with KPIs, charts, tables, and visual filters. ALP is driven by SAP UI annotations. You can create report having dashboards with just few clicks .
- Data Analyzer, a ready-to-run service for analytical queries, is integrated into SAP S/4HANA to provide an ad hoc query analysis experience to the end user. With Data Analyzer, you can visualize and report on analytical queries in SAP Analytics Cloud without model creation.
- How to use Data Analyzer option is very well explained in blog post "Embedded Analytics: SAP Analytics Cloud in SAP S/4HANA Cloud – How to create Data Analyzer Report"
- You can
- Analyze analytical queries on the fly
- Navigate, analyze, and filter data
- You can assign tile format while assigning application to the data analyzer . Based on which catalog you assign the application to ; you can see the tile under the same.
- Stories: Stories are raw data that transforms into powerful visualizations to help you drive business performance and make data-driven decisions about your business. You can use Out of box stories given by SAP / You can create your own stories ; very well explained by Avinash Kumar in his blog "Embedded Analytics: SAP Analytics Cloud in SAP S/4HANA Cloud – How to create your own Dashboard or S...".You can configure a story with a wide selection of charts and tables that best display the selected measure. Using the designer panel, you can refine the objects, change the chart type and add new objects.
Summary : In this Blog we covered some of Fiori apps that user can leverage to create dashboards in S/4HANA Cloud ... No coding and beautiful reports and dashboards are ready for use using these apps :).
Before we start with Output Management in Cloud ; lets see how it differs from On Premise. Please refer my blog SAP S/4HANA Cloud Output Management: Variations in Cloud vs On Premise for the same.
Regards
Taranam
- SAP Managed Tags:
- SAP S/4HANA Embedded Analytics,
- SAP S/4HANA Public Cloud
4 Comments
You must be a registered user to add a comment. If you've already registered, sign in. Otherwise, register and sign in.
Labels in this area
-
"mm02"
1 -
A_PurchaseOrderItem additional fields
1 -
ABAP
1 -
ABAP Extensibility
1 -
ACCOSTRATE
1 -
ACDOCP
1 -
Adding your country in SPRO - Project Administration
1 -
Advance Return Management
1 -
AI and RPA in SAP Upgrades
1 -
Approval Workflows
1 -
ARM
1 -
ASN
1 -
Asset Management
1 -
Associations in CDS Views
1 -
auditlog
1 -
Authorization
1 -
Availability date
1 -
Azure Center for SAP Solutions
1 -
AzureSentinel
2 -
Bank
1 -
BAPI_SALESORDER_CREATEFROMDAT2
1 -
BRF+
1 -
BRFPLUS
1 -
Bundled Cloud Services
1 -
business participation
1 -
Business Processes
1 -
CAPM
1 -
Carbon
1 -
Cental Finance
1 -
CFIN
1 -
CFIN Document Splitting
1 -
Cloud ALM
1 -
Cloud Integration
1 -
condition contract management
1 -
Connection - The default connection string cannot be used.
1 -
Custom Table Creation
1 -
Customer Screen in Production Order
1 -
Data Quality Management
1 -
Date required
1 -
Decisions
1 -
desafios4hana
1 -
Developing with SAP Integration Suite
1 -
Direct Outbound Delivery
1 -
DMOVE2S4
1 -
EAM
1 -
EDI
2 -
EDI 850
1 -
EDI 856
1 -
EHS Product Structure
1 -
Emergency Access Management
1 -
Energy
1 -
EPC
1 -
Find
1 -
FINSSKF
1 -
Fiori
1 -
Flexible Workflow
1 -
Gas
1 -
Gen AI enabled SAP Upgrades
1 -
General
1 -
generate_xlsx_file
1 -
Getting Started
1 -
HomogeneousDMO
1 -
IDOC
2 -
integration
1 -
Learning Content
2 -
LogicApps
2 -
low touchproject
1 -
Maintenance
1 -
management
1 -
Material creation
1 -
Material Management
1 -
MD04
1 -
MD61
1 -
methodology
1 -
Microsoft
2 -
MicrosoftSentinel
2 -
Migration
1 -
MRP
1 -
MS Teams
2 -
MT940
1 -
Newcomer
1 -
Notifications
1 -
Oil
1 -
open connectors
1 -
Order Change Log
1 -
ORDERS
2 -
OSS Note 390635
1 -
outbound delivery
1 -
outsourcing
1 -
PCE
1 -
Permit to Work
1 -
PIR Consumption Mode
1 -
PIR's
1 -
PIRs
1 -
PIRs Consumption
1 -
PIRs Reduction
1 -
Plan Independent Requirement
1 -
Premium Plus
1 -
pricing
1 -
Primavera P6
1 -
Process Excellence
1 -
Process Management
1 -
Process Order Change Log
1 -
Process purchase requisitions
1 -
Product Information
1 -
Production Order Change Log
1 -
Purchase requisition
1 -
Purchasing Lead Time
1 -
Redwood for SAP Job execution Setup
1 -
RISE with SAP
1 -
RisewithSAP
1 -
Rizing
1 -
S4 Cost Center Planning
1 -
S4 HANA
1 -
S4HANA
3 -
Sales and Distribution
1 -
Sales Commission
1 -
sales order
1 -
SAP
2 -
SAP Best Practices
1 -
SAP Build
1 -
SAP Build apps
1 -
SAP Cloud ALM
1 -
SAP Data Quality Management
1 -
SAP Maintenance resource scheduling
2 -
SAP Note 390635
1 -
SAP S4HANA
2 -
SAP S4HANA Cloud private edition
1 -
SAP Upgrade Automation
1 -
SAP WCM
1 -
SAP Work Clearance Management
1 -
Schedule Agreement
1 -
SDM
1 -
security
2 -
Settlement Management
1 -
soar
2 -
SSIS
1 -
SU01
1 -
SUM2.0SP17
1 -
SUMDMO
1 -
Teams
2 -
User Administration
1 -
User Participation
1 -
Utilities
1 -
va01
1 -
vendor
1 -
vl01n
1 -
vl02n
1 -
WCM
1 -
X12 850
1 -
xlsx_file_abap
1 -
YTD|MTD|QTD in CDs views using Date Function
1
- « Previous
- Next »
Related Content
- SAP S/4HANA Cloud Public Edition 财务-成本会计常见热点问题汇总FAQ in Enterprise Resource Planning Blogs by SAP
- Demystifying Transformers and Embeddings: Some GenAI Concepts in Enterprise Resource Planning Blogs by SAP
- Embedded Analytics standard content available for the Cloud for Customer data in S4 hana system in Enterprise Resource Planning Q&A
- Continuous Influence Session SAP S/4HANA Cloud, private edition: Results Review Cycle for Q4 2023 in Enterprise Resource Planning Blogs by SAP
- Airline community content available on SAP Analytics Cloud in Enterprise Resource Planning Blogs by SAP
Top kudoed authors
| User | Count |
|---|---|
| 2 | |
| 2 | |
| 2 | |
| 2 | |
| 1 | |
| 1 | |
| 1 | |
| 1 | |
| 1 | |
| 1 |