
- SAP Community
- Products and Technology
- Technology
- Technology Blogs by SAP
- Performance ABSL Trace - New functionality in 2005...
Technology Blogs by SAP
Learn how to extend and personalize SAP applications. Follow the SAP technology blog for insights into SAP BTP, ABAP, SAP Analytics Cloud, SAP HANA, and more.
Turn on suggestions
Auto-suggest helps you quickly narrow down your search results by suggesting possible matches as you type.
Showing results for
Advisor
Options
- Subscribe to RSS Feed
- Mark as New
- Mark as Read
- Bookmark
- Subscribe
- Printer Friendly Page
- Report Inappropriate Content
05-05-2020
7:07 AM
Hello All,
Partners can now generate a performance trace from SAP cloud application studio ,which will help you to analyze the execution time of a script and the time taken by the following individual constructs within a script.
“Prerequisite: The script files need to be reactivated after the 2005 upgrade before performance traces can be taken”.
Constructs Supported:
This functionality is the extension of the current tracer and you just need to do the normal tracing buy executing your custom actions or determinations from the front -end UI.Once the trace is completed you can click on get trace details and then you will see a new tab called "Performance Trace" which is added in this 2005 release.
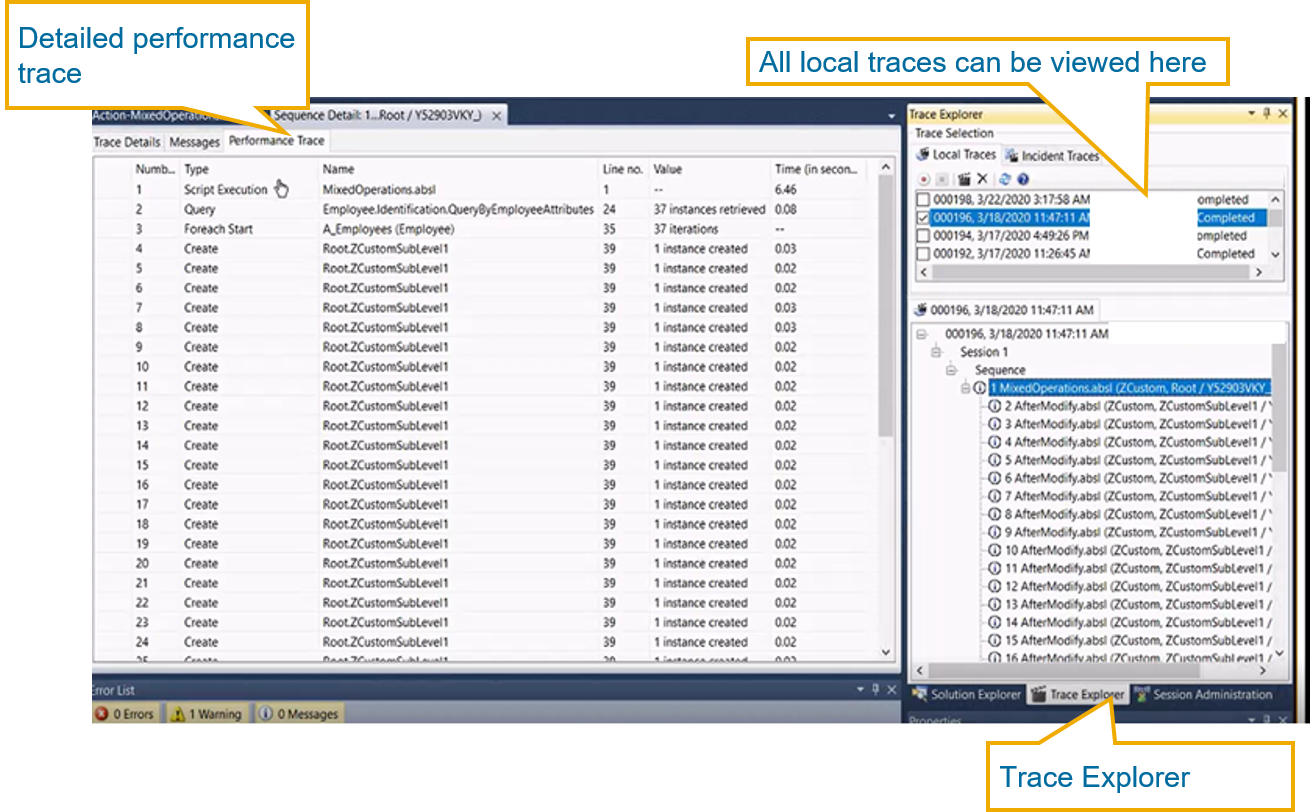
To view the detailed analysis of script execution, follow below steps:
2. Execute the normal business flow and end trace.

3. Navigate to the Trace Explorer tab and select a particular trace to see the details and In the Performance Trace tab, you can see the detailed analysis of script execution.
How to Perform ABSL performance trace for ODATA services:
You have to create CBO or XBO and enhance your ABSL logic in any of the scripts.
As shown below in the sample example we have enhanced Opportunity BO and created After- Modify and Before Save scripts. In After modify we are creating, querying and using foreach loop for an instance.
Open Trace Explorer and start Tracing as explained above. Below is the screen shot on how to start trace.
You can see that in below example trace has been activated for my development user.
Now Execute Post call through Postman for executing above ABSL logic and maintain same user (development SDK user) in Authorization for post call.
Once Post call is Executed, Go back to Cloud Application Studio and stop Tracing and View latest Trace
Double click on Trace for ABSL logic of your solution and Go to Performance Trace tab
Note: Traces would be shown for all ABSL of all activated solutions in particular tenant which gets executed.
In Performance Trace tab, Check Execution time for Full script and also for different Constructs used in Scripts.
How to perform ABSL performance trace for MDRO
Define ABSL logic in your Custom Action ABSL of Custom Business Object (CBO) and create MassDataRun.run on the same CBO.
Below are some screen shots explaining the same:
Login to the C4C/BYD front end application and execute the MDRO run and wait the application log is finished successfully.
Check the MDRO action is the trace explorer sequence and double click on Trace for ABSL logic of your solution and Go to Performance Trace tab as explained earlier.
NOTE - The performance tracer can collect data/info for maximum of 15 min, It is best to stop the tracer after 15min in Cloud Application Studio and then analyze the data captured to get more insights on what the custom implementation is doing.
Advantages
For example you are using a foreach loop, in your performance trace the foreach start will show the number of the instances retrieved by a query or action with the absl line number and foreach End will explain you total time taken to execute the loop.
For more details please refer to our SAP help documentation whats new section -Performance Trace of script using trace explorer
Hope the enhance version of tracking feature with "Performance trace" will be helpful for all of you.
Note
This feature is not applicable for offline ABSL.
Regards
Anant
Partners can now generate a performance trace from SAP cloud application studio ,which will help you to analyze the execution time of a script and the time taken by the following individual constructs within a script.
“Prerequisite: The script files need to be reactivated after the 2005 upgrade before performance traces can be taken”.
Constructs Supported:
- Query
- Create
- Mass Create
- Foreach Loops
- Standard/custom action calls
- Only Custom reuse library function
This functionality is the extension of the current tracer and you just need to do the normal tracing buy executing your custom actions or determinations from the front -end UI.Once the trace is completed you can click on get trace details and then you will see a new tab called "Performance Trace" which is added in this 2005 release.
To view the detailed analysis of script execution, follow below steps:
- Navigate to Debug Windows Trace Explorer.

2. Execute the normal business flow and end trace.
3. Navigate to the Trace Explorer tab and select a particular trace to see the details and In the Performance Trace tab, you can see the detailed analysis of script execution.
How to Perform ABSL performance trace for ODATA services:
You have to create CBO or XBO and enhance your ABSL logic in any of the scripts.
As shown below in the sample example we have enhanced Opportunity BO and created After- Modify and Before Save scripts. In After modify we are creating, querying and using foreach loop for an instance.
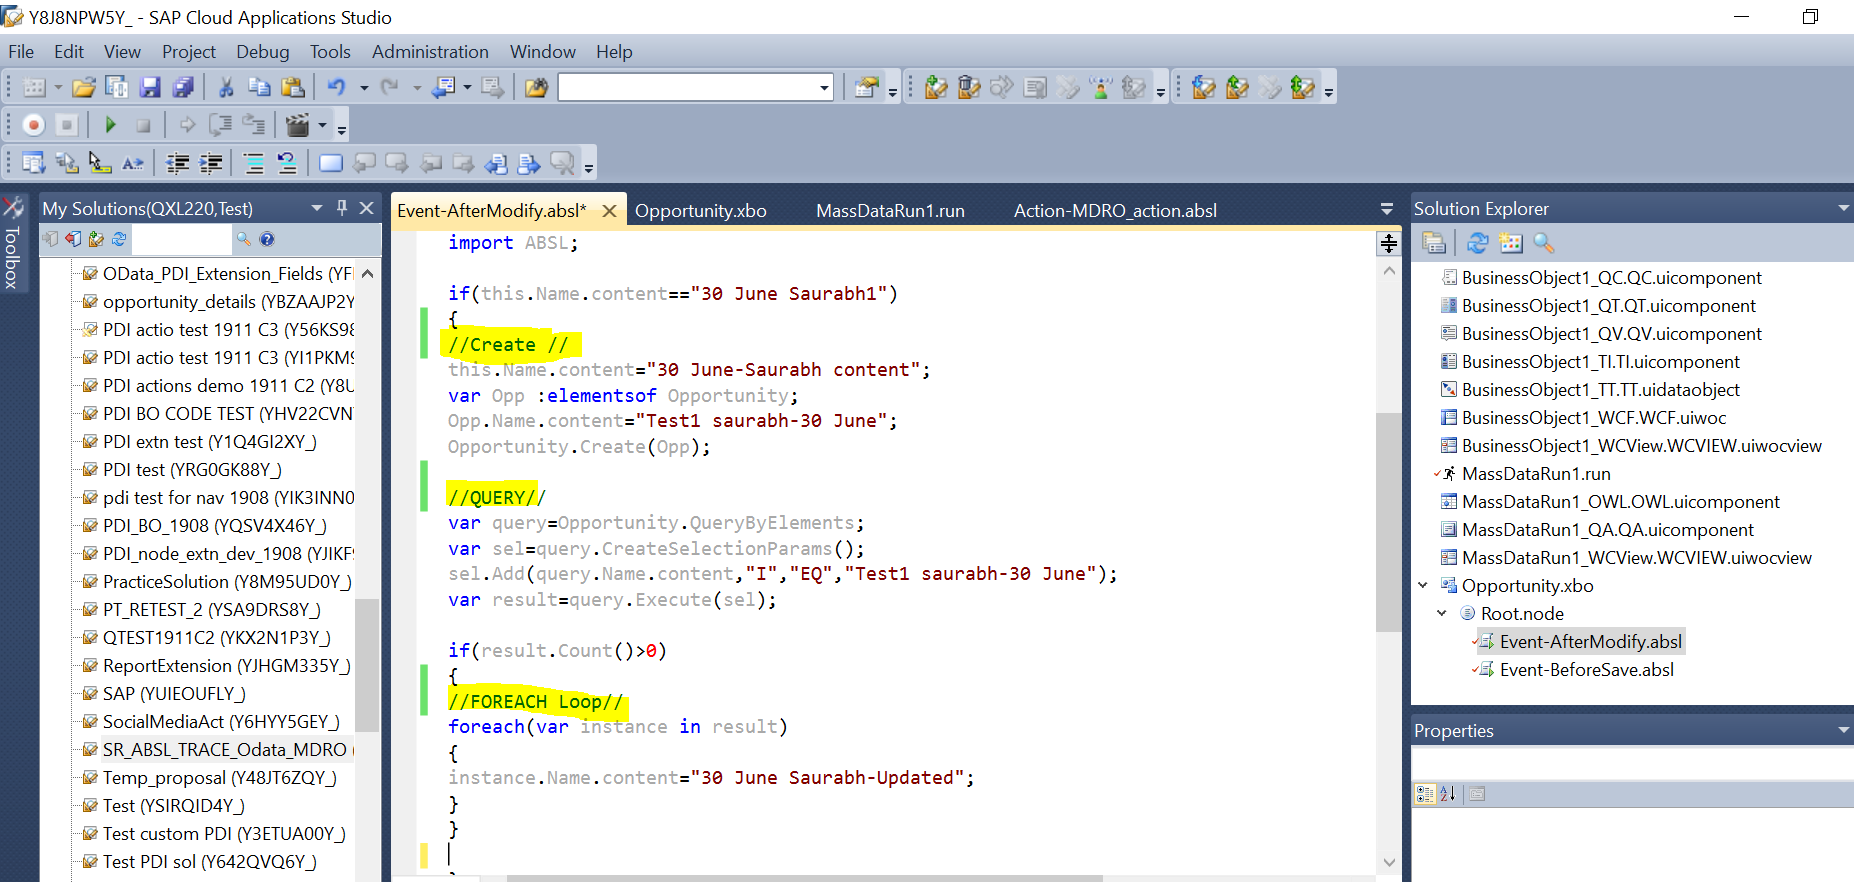
Enhanced ABSL Logic
Open Trace Explorer and start Tracing as explained above. Below is the screen shot on how to start trace.

Trace explorer
You can see that in below example trace has been activated for my development user.
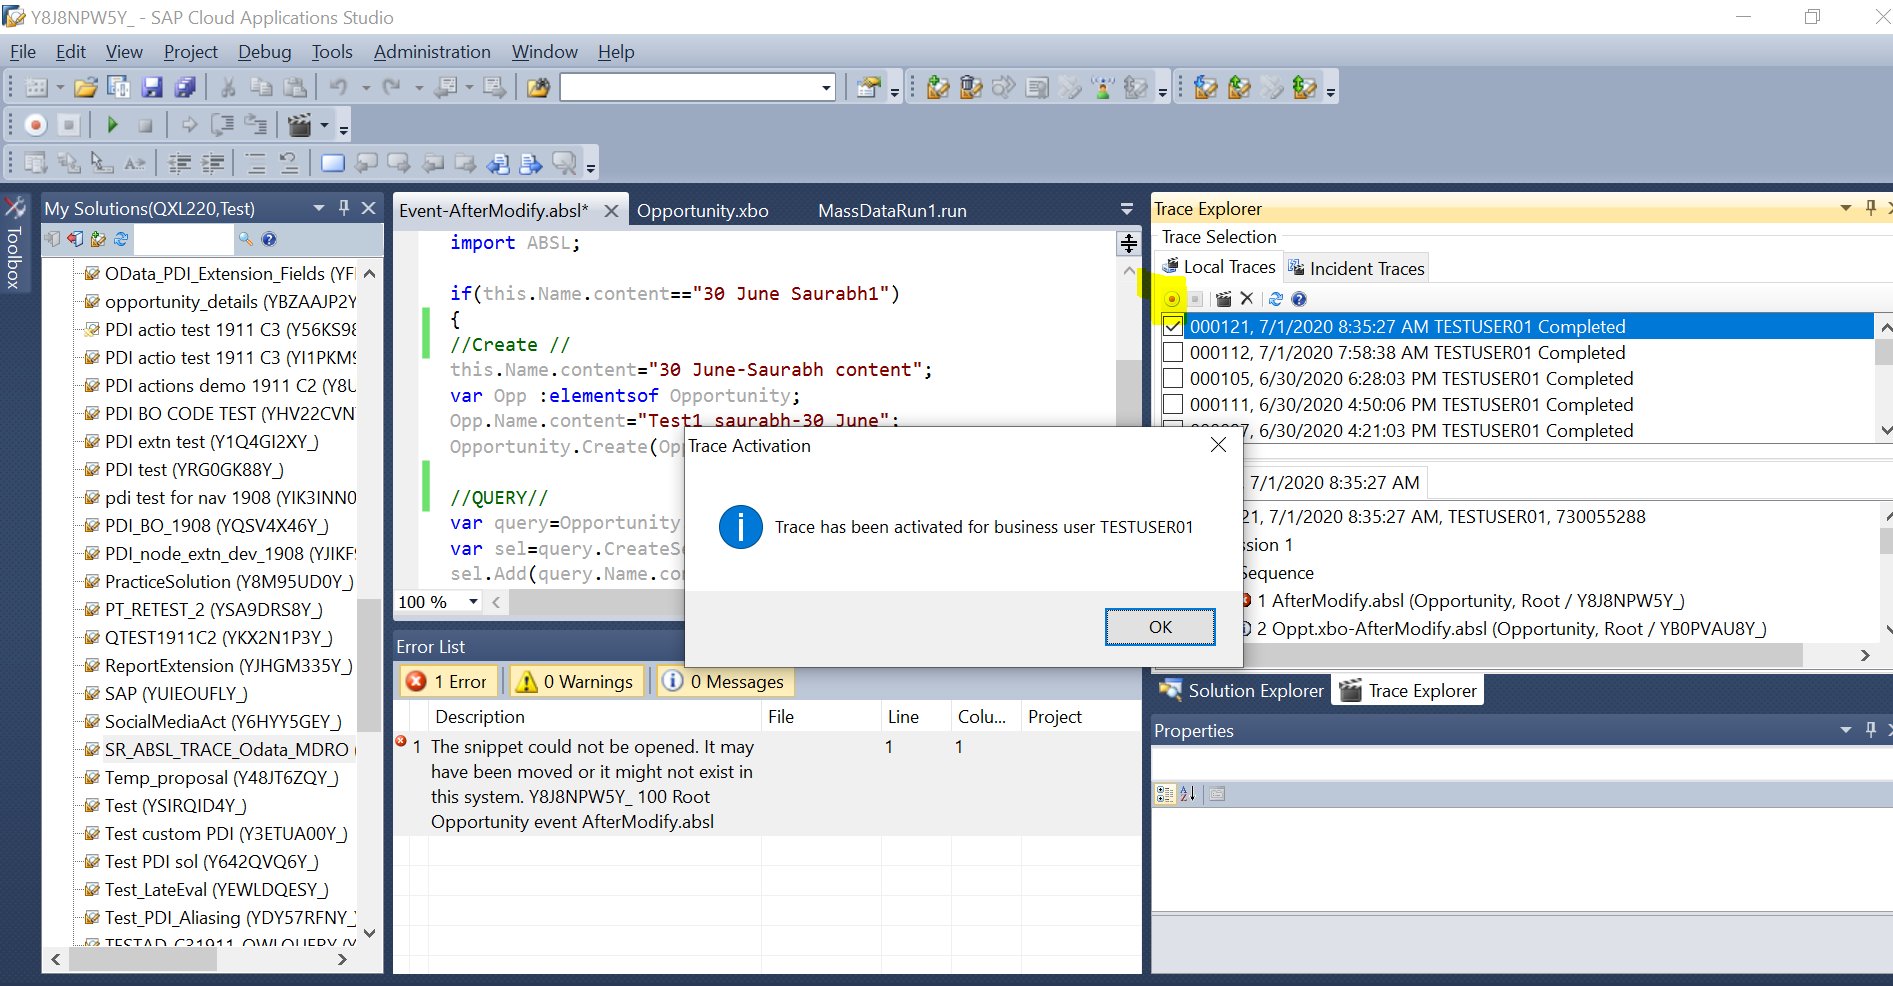
Trace set for User
Now Execute Post call through Postman for executing above ABSL logic and maintain same user (development SDK user) in Authorization for post call.

Testing in Postman tool
Once Post call is Executed, Go back to Cloud Application Studio and stop Tracing and View latest Trace

Check the latest trace for your dev user
Double click on Trace for ABSL logic of your solution and Go to Performance Trace tab
Note: Traces would be shown for all ABSL of all activated solutions in particular tenant which gets executed.
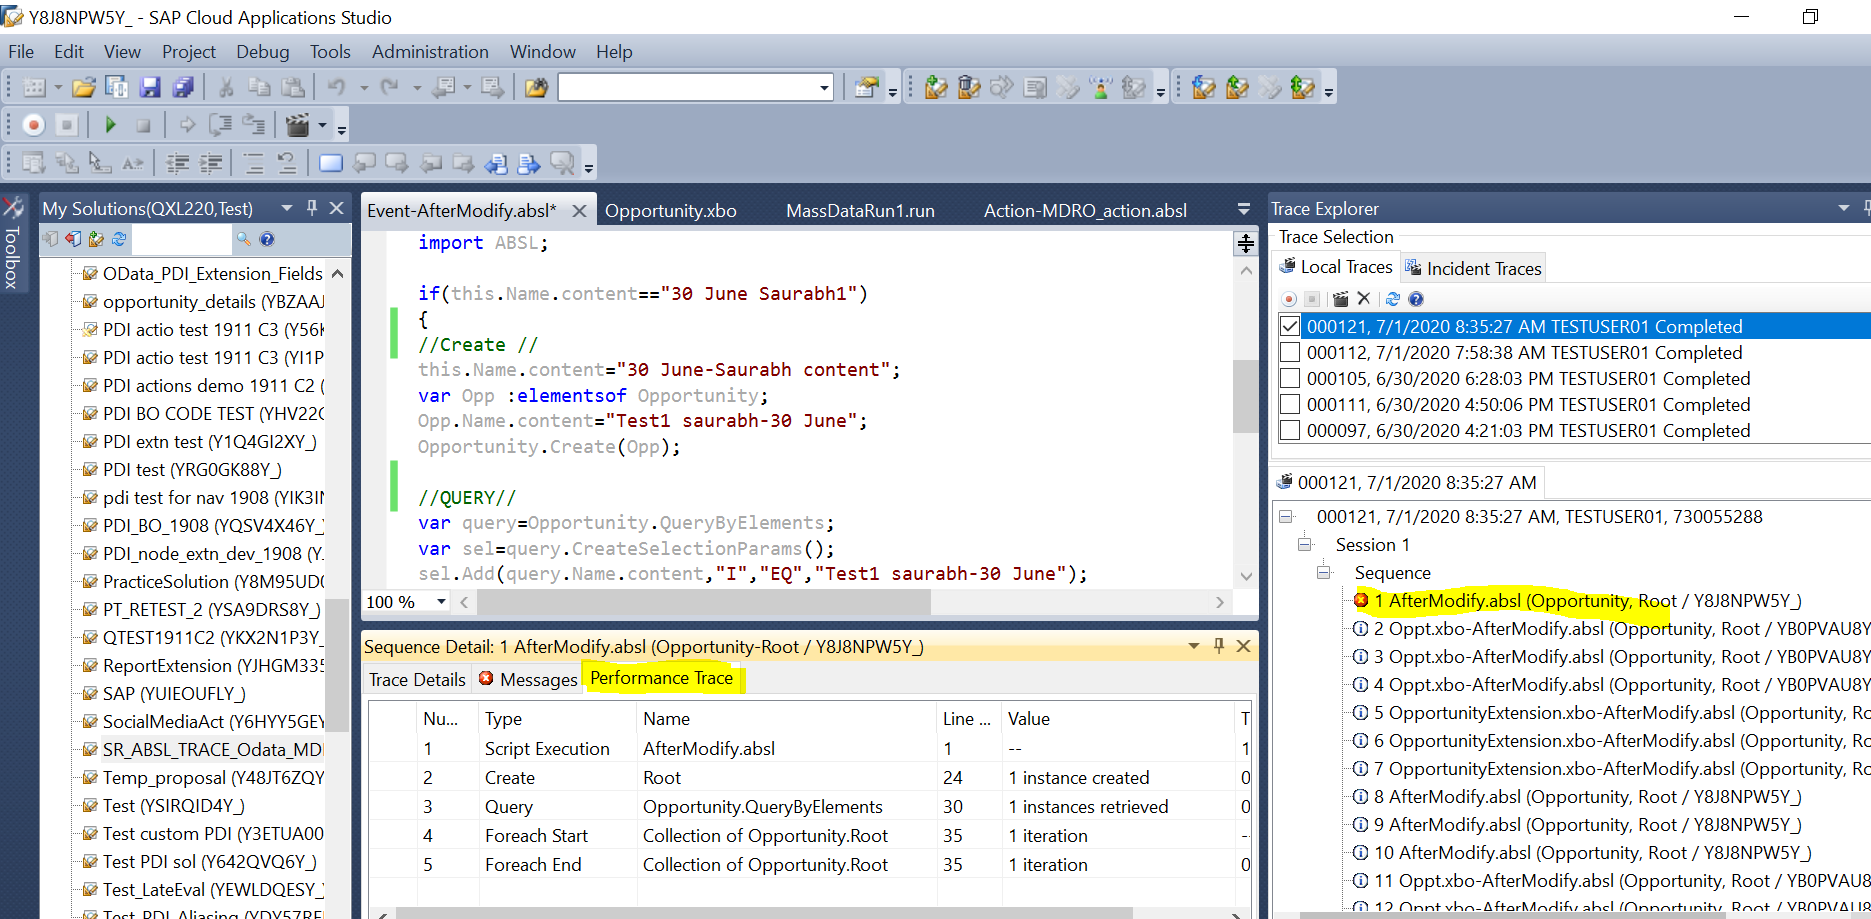
Trace Sequence
In Performance Trace tab, Check Execution time for Full script and also for different Constructs used in Scripts.

Performance trace
How to perform ABSL performance trace for MDRO
Define ABSL logic in your Custom Action ABSL of Custom Business Object (CBO) and create MassDataRun.run on the same CBO.
- Start Tracing in trace explorer
- Execute MDR run from the UI (login to UI with same user as SDK user)
- Once Execution of custom action ABSL is done (In SDK Stop Tracing )
- Check Performance Trace for Custom Action ABSL as shown above steps.
Below are some screen shots explaining the same:
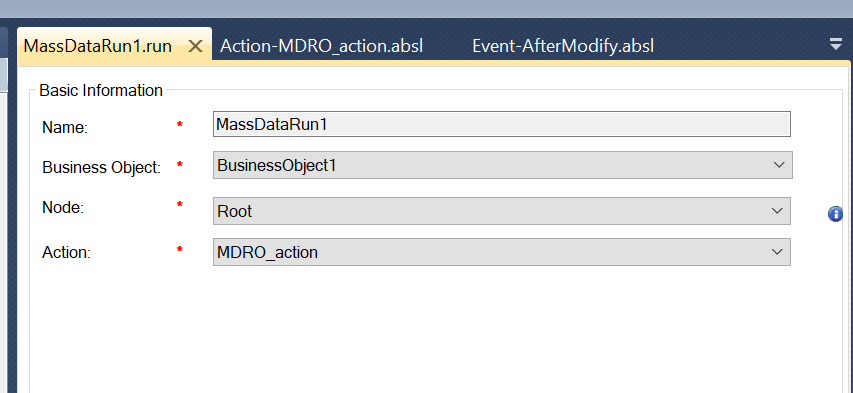
MDRO Action
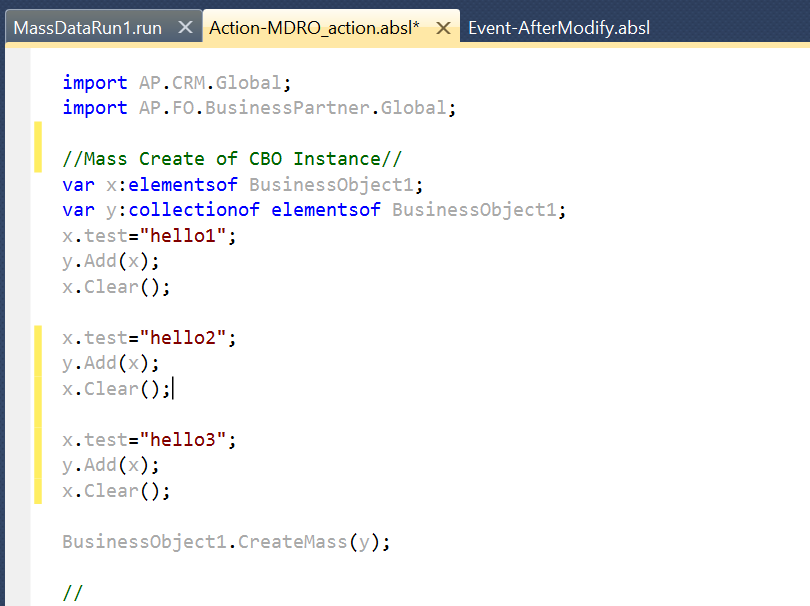
Action ABSL

Activate the trace for your user
Login to the C4C/BYD front end application and execute the MDRO run and wait the application log is finished successfully.

Execute the MDRO from UI
Check the MDRO action is the trace explorer sequence and double click on Trace for ABSL logic of your solution and Go to Performance Trace tab as explained earlier.
NOTE - The performance tracer can collect data/info for maximum of 15 min, It is best to stop the tracer after 15min in Cloud Application Studio and then analyze the data captured to get more insights on what the custom implementation is doing.
Advantages
- Performance trace is an actual run-time tracer which will calculate the total time taken for execution a script time in seconds.
- It also explains you in detail about the type of Construct, name of the construct, the line number of the corresponding absl script and the number of instances retrieved by the operation.
- If you see any Add on is causing performance issue in your system this functionality will help you to find out which Constructs are taking more time.
For example you are using a foreach loop, in your performance trace the foreach start will show the number of the instances retrieved by a query or action with the absl line number and foreach End will explain you total time taken to execute the loop.
For more details please refer to our SAP help documentation whats new section -Performance Trace of script using trace explorer
Hope the enhance version of tracking feature with "Performance trace" will be helpful for all of you.
Note
This feature is not applicable for offline ABSL.
Regards
Anant
Labels:
6 Comments
You must be a registered user to add a comment. If you've already registered, sign in. Otherwise, register and sign in.
Labels in this area
-
ABAP CDS Views - CDC (Change Data Capture)
2 -
AI
1 -
Analyze Workload Data
1 -
BTP
1 -
Business and IT Integration
2 -
Business application stu
1 -
Business Technology Platform
1 -
Business Trends
1,661 -
Business Trends
86 -
CAP
1 -
cf
1 -
Cloud Foundry
1 -
Confluent
1 -
Customer COE Basics and Fundamentals
1 -
Customer COE Latest and Greatest
3 -
Customer Data Browser app
1 -
Data Analysis Tool
1 -
data migration
1 -
data transfer
1 -
Datasphere
2 -
Event Information
1,400 -
Event Information
64 -
Expert
1 -
Expert Insights
178 -
Expert Insights
270 -
General
1 -
Google cloud
1 -
Google Next'24
1 -
Kafka
1 -
Life at SAP
784 -
Life at SAP
11 -
Migrate your Data App
1 -
MTA
1 -
Network Performance Analysis
1 -
NodeJS
1 -
PDF
1 -
POC
1 -
Product Updates
4,578 -
Product Updates
323 -
Replication Flow
1 -
RisewithSAP
1 -
SAP BTP
1 -
SAP BTP Cloud Foundry
1 -
SAP Cloud ALM
1 -
SAP Cloud Application Programming Model
1 -
SAP Datasphere
2 -
SAP S4HANA Cloud
1 -
SAP S4HANA Migration Cockpit
1 -
Technology Updates
6,886 -
Technology Updates
395 -
Workload Fluctuations
1
Related Content
- Top Picks: Innovations Highlights from SAP Business Technology Platform (Q1/2024) in Technology Blogs by SAP
- SAP Disclosure Management for EFRAG taxonomy in Technology Q&A
- Data Flows - The Python Script Operator and why you should avoid it in Technology Blogs by Members
- Deep dive into Q4 2023, What’s New in SAP Cloud ALM for Implementation Blog Series in Technology Blogs by SAP
- CONFIG.READ_CALUCATED_MEMBER_VALUES in Technology Q&A
Top kudoed authors
| User | Count |
|---|---|
| 11 | |
| 10 | |
| 10 | |
| 10 | |
| 8 | |
| 7 | |
| 7 | |
| 7 | |
| 7 | |
| 6 |