
- SAP Community
- Products and Technology
- Technology
- Technology Blogs by SAP
- SAP HANA Cloud: What’s New (and Changed) – Monitor...
Technology Blogs by SAP
Learn how to extend and personalize SAP applications. Follow the SAP technology blog for insights into SAP BTP, ABAP, SAP Analytics Cloud, SAP HANA, and more.
Turn on suggestions
Auto-suggest helps you quickly narrow down your search results by suggesting possible matches as you type.
Showing results for
Product and Topic Expert
Options
- Subscribe to RSS Feed
- Mark as New
- Mark as Read
- Bookmark
- Subscribe
- Printer Friendly Page
- Report Inappropriate Content
04-20-2020
9:32 PM
In the upcoming days and weeks, we will be publishing new tutorial videos about what's new and changed for SAP HANA Cloud. The focus of this series is on system administration with SAP HANA cockpit. For the overview blog about What's New with SAP HANA Cloud Administration, see Questions? Post as comment. Useful? Give us a like and share on social media. Thanks!  |

Video Tutorial
In this second video tutorial about monitoring SAP HANA Cloud with SAP HANA cockpit, we take a look at the remaining cards and apps
- Sessions
- Threads
- Blocked Transactions
- Monitor Statements
- Table Usage
What's Changed?
Compared to the SAP HANA cockpit for SAP HANA platform (on-premise), the following changes have been made:
- Configure Expensive Statement Trace is removed from Monitor Statements as file-based tracing is no longer available for SAP HANA Cloud.
https://youtu.be/SRneoqYkZjU
SAP HANA Cloud - SAP HANA Cockpit: Sessions and Threads
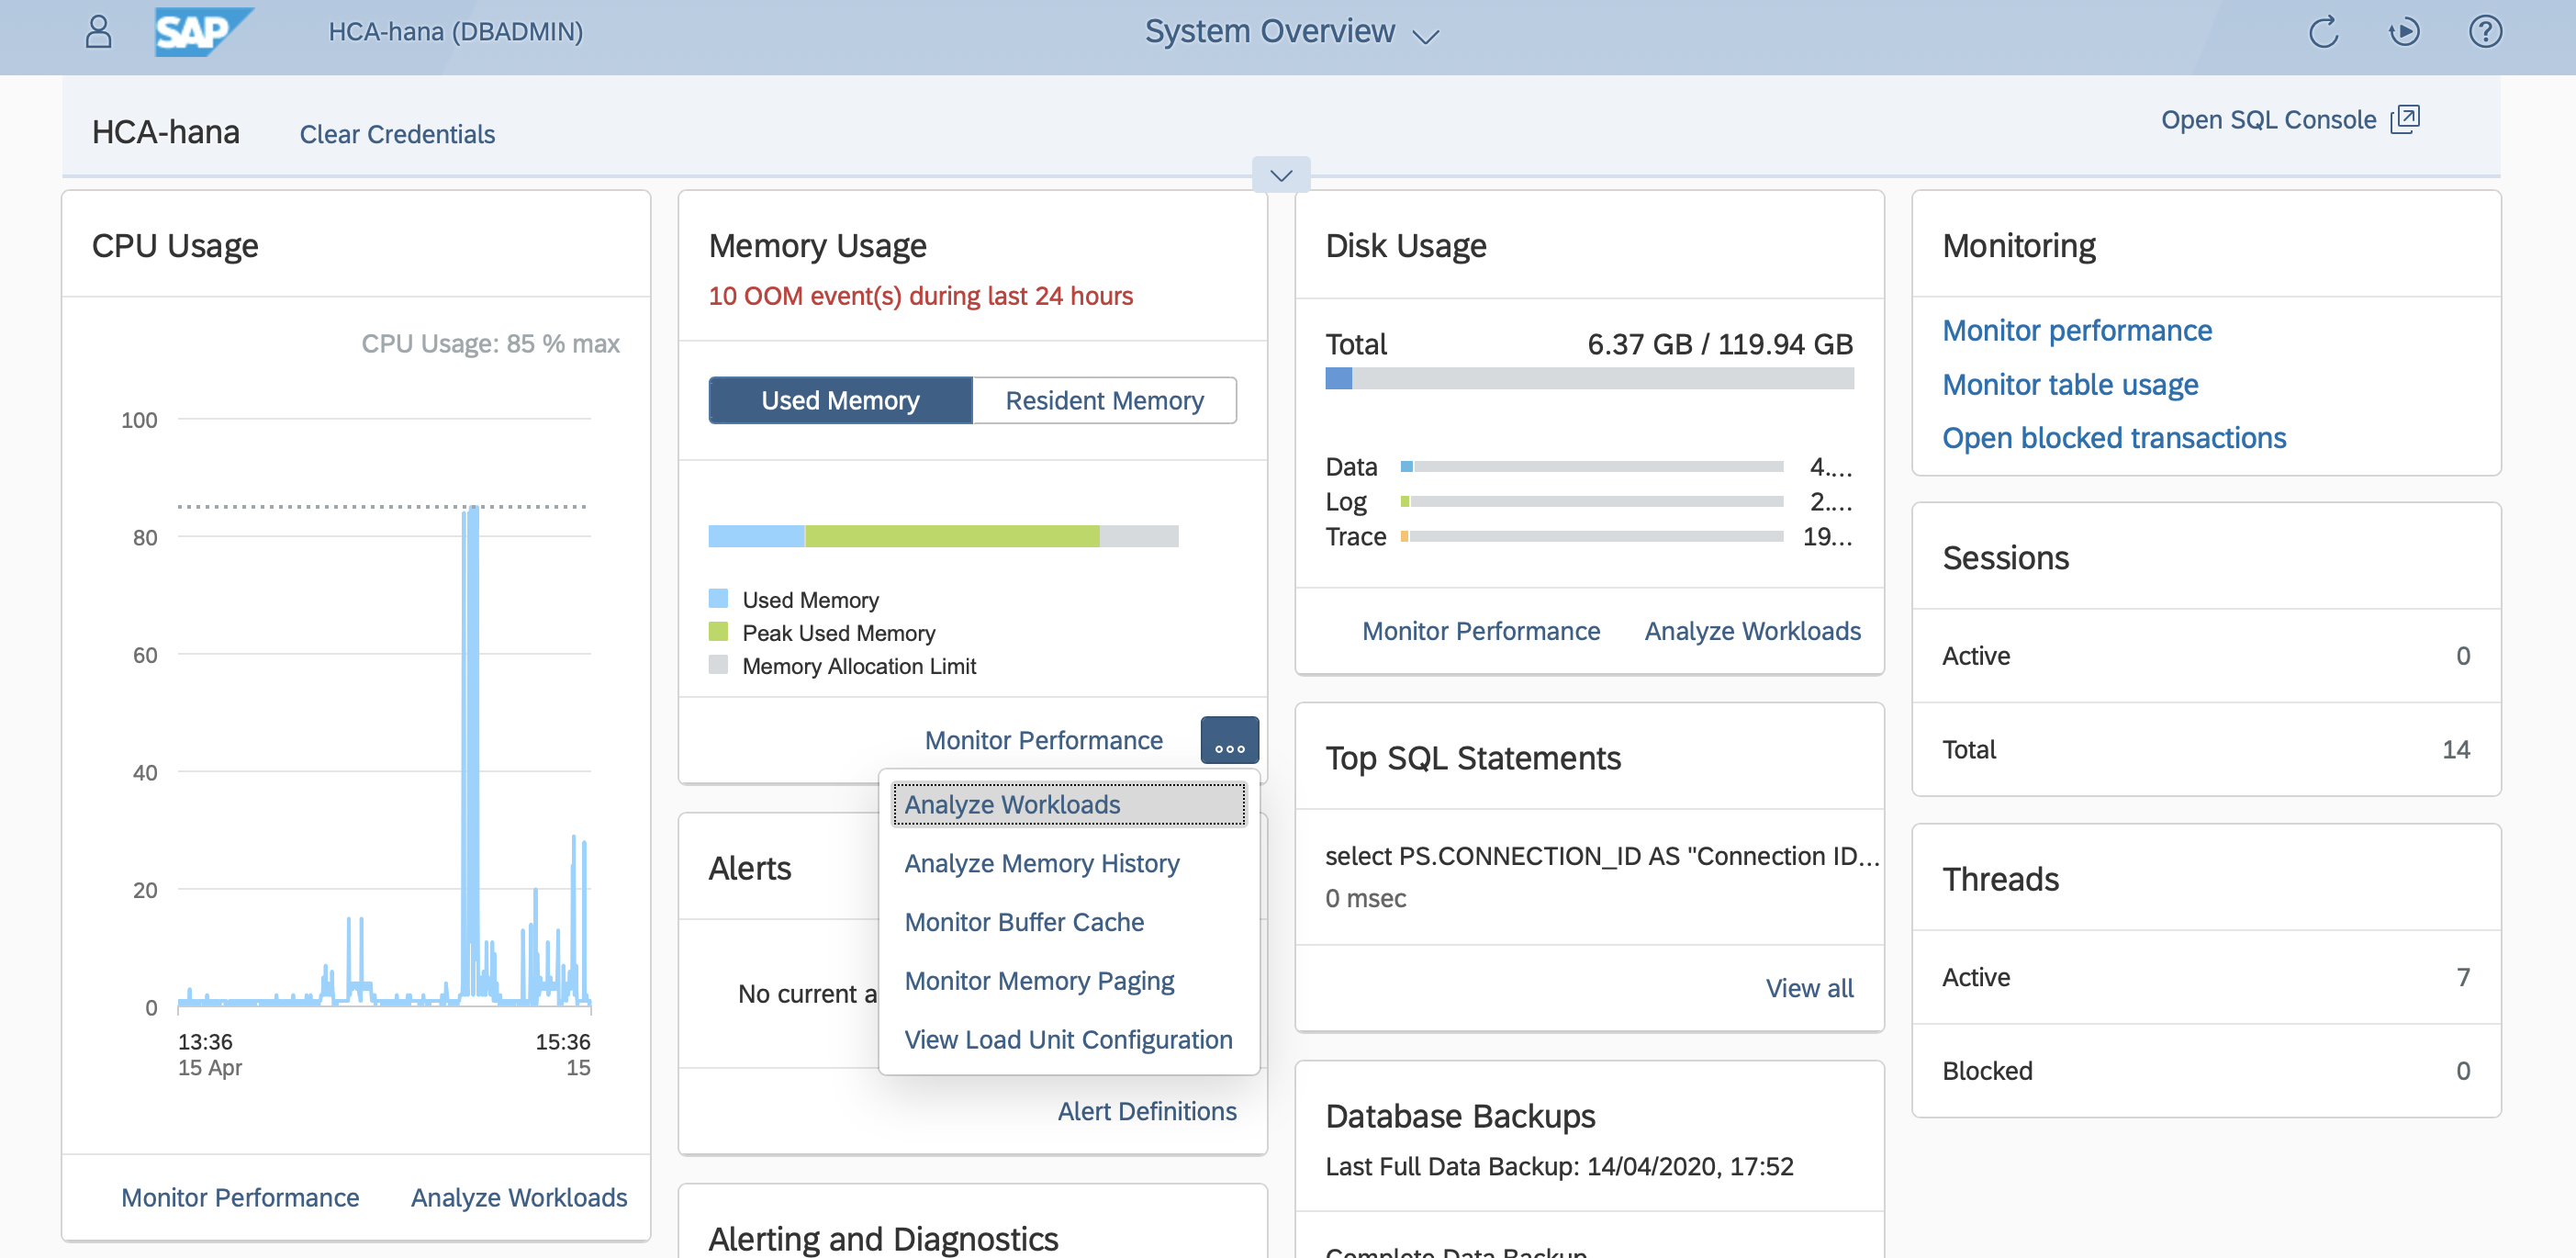
System Overview
Monitoring Sessions, Threads, and SQL Statements
The Monitoring and Administration topic area in System Overview includes
- Sessions
- Threads
- Top SQL Statements (Monitor Statements)
- Monitoring: Open blocked transactions
- Monitoring: Monitor Table Usage
When selected, the cards open the corresponding related apps with the same name.
For the documentation, see
- Cards Available on the System Overview Page
- Monitoring Performance in SAP HANA Cockpit
- Analyzing System Performance, SAP HANA Cloud Administration Guide
System Overview
Sessions
The Sessions app enables us to monitor session activity in the database with detailed information about each session (34 different statistics available for selection). The Summary header shows several aggregates (Top 5). When a session is selected, we can cancel the session (requires SESSION ADMIN system privilege) or navigate to the Threads or the Blocked Transactions app with the same connection ID.
For the documentation, see
- Session Monitoring, Cockpit Guide
- Session-Specific Information for Connections, Administration Guide
Recommended KBAs

Sessions
Threads
The Threads app enables us to monitor thread activity in the database with detailed information about each thread (57 different statistics available for selection). The Summary header shows several aggregates (Top 5). When a thread is selected, we can cancel the operation (requires SESSION ADMIN system privilege) or navigate to the Sessions or the Blocked Transactions app with the same connection ID. In addition, we can request the call stack for a particular thread (use case: SAP Support request).
Recommended KBAs (lists and describes the different type of threads available)

Threads
Blocked Transactions
The Blocked Transaction app enables us to view details information about blocked transactions, when available (51 different statistics available for selection). When a transaction is selected, we can navigate to the Sessions or the Threads app with the same connection ID.
Recommended KBAs

Blocked Transactions
--session 1:

CREATE TABLE X (A INT);

INSERT INTO X VALUES (0);

COMMIT;

-- setting 10 minute timeout

SET TRANSACTION LOCK WAIT TIMEOUT 600000;

UPDATE X SET A = 1;


--session 2:

SELECT A FROM X FOR SHARE LOCK
Simple Test Case
Related Apps
Sessions, Threads, and Blocked Transactions are related apps and we can easily navigate between the apps by using either the lateral navigation menu in the header or the context aware Navigate To ... menu in the footer which preserves the connection ID.

Lateral Navigation

Navigate To...
Monitor Statements
The Monitor Statement app enables us to statement activity in the database with detailed information about each statement (overview, active statements, SQL Plan Cache, Expensive Statements). The Top SQL Statement card on System Overview opens this app.
From the SQL Plan Cache tab, we can save SQL Statement execution plans as PLV files or open the plan directly in SQL Analyzer.
For the documentation, see
- Monitor Statements, Cockpit Guide
Recommended KBAs (lists and describes the different type of threads available)
Overview

Monitor Statements - Overview

Monitor Statements - SQL Plan Cache
Table Usage
The Table Usage app displays a bubble graph (and table view) of the largest column tables in the database. A filter selection can be made on reads, writes, read/writes, and size.
For the documentation, see
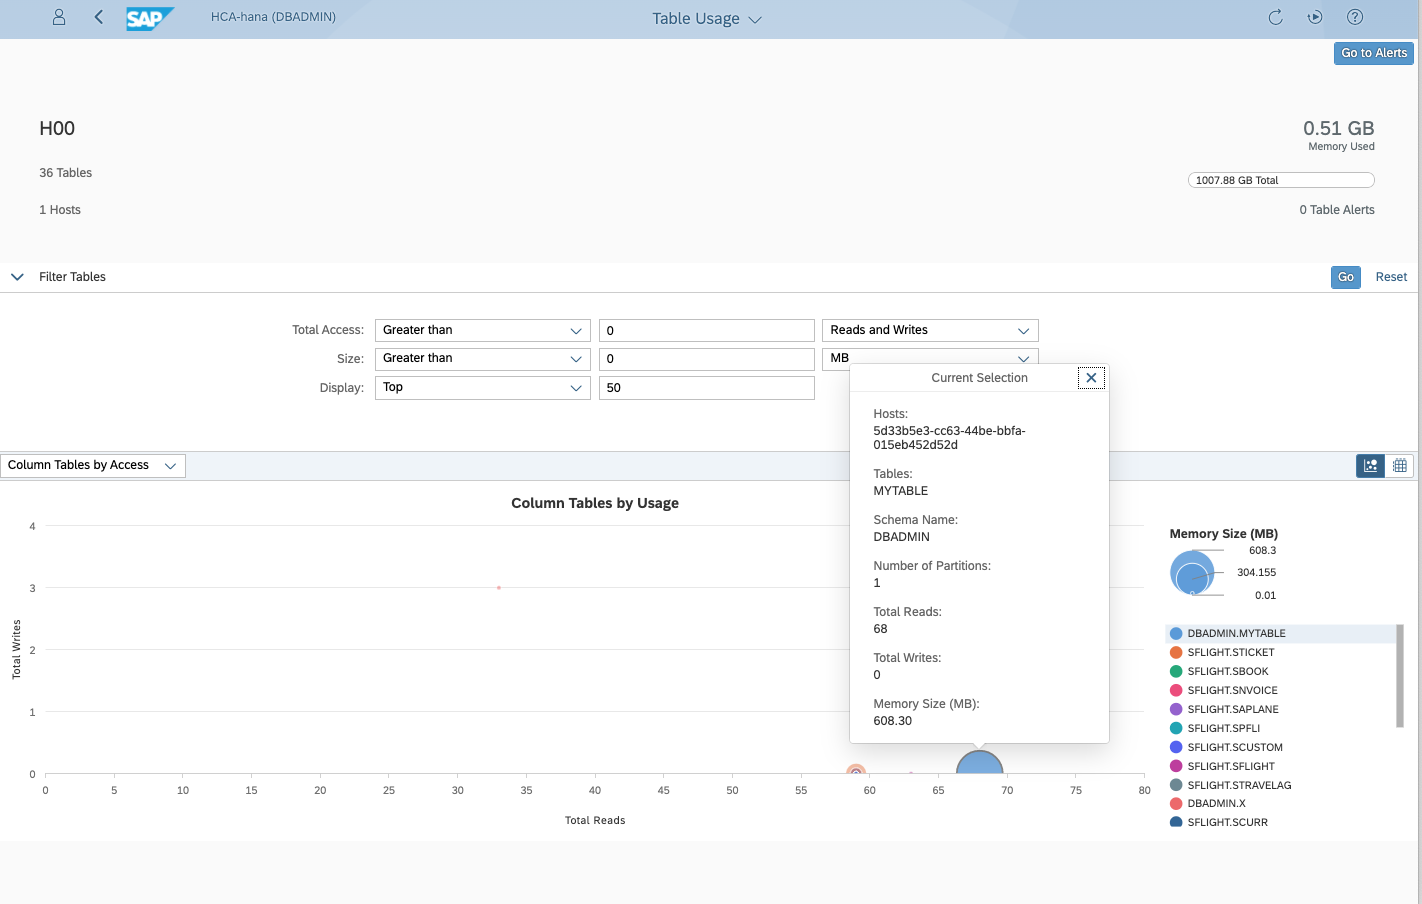
Table Usage
SAP HANA Database Explorer
SQL Console and Statement Library
The information displayed in the Sessions, Threads, and Blocked Transactions apps is populated from M_SESSION_CONTEXT, M_SERVICE_THREADS, and M_BLOCKED_TRANSACTIONS and related system monitoring views, which you can query using the SQL Console in SAP HANA Database Explorer.

SQL Console
Although not specific to SAP HANA Cloud, the Statement Library of the SAP HANA Database Explorer also contains many statements and script that can be useful for performance analysis. Due to changes in the catalog, some statements return errors and require editing.
For the documentation, see
- Use the Statement Library to Administer Your Database, SAP Cloud Platform, SAP HANA Service (not yet available for SAP HANA Cloud)
Recommended KBA

Statement Library
Share and Connect
Questions? Post as comment.
Useful? Give a like and share on social media. Thanks!
If you would like to receive updates, connect with me on
- LinkedIn > linkedin.com/in/dvankempen
- Twitter > @dvankempen
For the author page of SAP Press, visit
For the SAP HANA Cloud e-bite, see
- SAP Managed Tags:
- SAP HANA Cloud,
- SAP HANA,
- SAP HANA service for SAP BTP
Labels:
2 Comments
You must be a registered user to add a comment. If you've already registered, sign in. Otherwise, register and sign in.
Labels in this area
-
ABAP CDS Views - CDC (Change Data Capture)
2 -
AI
1 -
Analyze Workload Data
1 -
BTP
1 -
Business and IT Integration
2 -
Business application stu
1 -
Business Technology Platform
1 -
Business Trends
1,658 -
Business Trends
91 -
CAP
1 -
cf
1 -
Cloud Foundry
1 -
Confluent
1 -
Customer COE Basics and Fundamentals
1 -
Customer COE Latest and Greatest
3 -
Customer Data Browser app
1 -
Data Analysis Tool
1 -
data migration
1 -
data transfer
1 -
Datasphere
2 -
Event Information
1,400 -
Event Information
66 -
Expert
1 -
Expert Insights
177 -
Expert Insights
293 -
General
1 -
Google cloud
1 -
Google Next'24
1 -
Kafka
1 -
Life at SAP
780 -
Life at SAP
13 -
Migrate your Data App
1 -
MTA
1 -
Network Performance Analysis
1 -
NodeJS
1 -
PDF
1 -
POC
1 -
Product Updates
4,577 -
Product Updates
340 -
Replication Flow
1 -
RisewithSAP
1 -
SAP BTP
1 -
SAP BTP Cloud Foundry
1 -
SAP Cloud ALM
1 -
SAP Cloud Application Programming Model
1 -
SAP Datasphere
2 -
SAP S4HANA Cloud
1 -
SAP S4HANA Migration Cockpit
1 -
Technology Updates
6,873 -
Technology Updates
419 -
Workload Fluctuations
1
Related Content
- Hack2Build on Business AI – Highlighted Use Cases in Technology Blogs by SAP
- Analyze Expensive ABAP Workload in the Cloud with Work Process Sampling in Technology Blogs by SAP
- Capture Your Own Workload Statistics in the ABAP Environment in the Cloud in Technology Blogs by SAP
- Workload Analysis for HANA Platform Series - 3. Identify the Memory Consumption in Technology Blogs by SAP
- SAP Datasphere - Space, Data Integration, and Data Modeling Best Practices in Technology Blogs by SAP
Top kudoed authors
| User | Count |
|---|---|
| 35 | |
| 25 | |
| 14 | |
| 7 | |
| 7 | |
| 6 | |
| 6 | |
| 5 | |
| 4 | |
| 4 |