
- SAP Community
- Products and Technology
- Supply Chain Management
- SCM Blogs by Members
- Easy Money with SAP Integrated Business Planning s...
Supply Chain Management Blogs by Members
Learn about SAP SCM software from firsthand experiences of community members. Share your own post and join the conversation about supply chain management.
Turn on suggestions
Auto-suggest helps you quickly narrow down your search results by suggesting possible matches as you type.
Showing results for
former_member67
Member
Options
- Subscribe to RSS Feed
- Mark as New
- Mark as Read
- Bookmark
- Subscribe
- Printer Friendly Page
- Report Inappropriate Content
04-15-2020
1:23 PM

Source: [link to site]
Everybody remembers the scene from the first Terminator movie when young John Connor gets “easy money” from ATM. By reading this post you will learn how SAP IBP can be used by companies to save “Easy Money”.
SAP IBP is said to get rid of the current problems that many companies are facing today: Partial optimization of their supply chain, several tools needed for planning, long runtime, several integrations between systems, separate reporting tool, lots of manual work and so on. IBP is said to be aligned between Sales, Marketing, Manufacturing, Sourcing and Finance. Goal of companies is to create the optimal business plan to drive revenue growth and increase market share. But what does this actually mean within SAP IBP? There are lots of generic presentations about this but I have not found any concrete examples what does this mean in practice. In this post I will show concrete example how the finance part works in standard SAP IBP and how that can support the decisions making process of companies.
Easy Money?
- Supply chain optimization by using cost factors
- Finance view: Visualization of the plans on monetary terms
Supply Chain Optimization with SAP IBP
The goal of supply chain planning in IBP is to create cost optimal plans taking into account all possible constraints. This is enabled by modeling the whole business operating model and network in the system. By using optimization relevant cost factors system will find out the most optimal plan. The objective of optimizer is to minimize the total costs or maximize profit of the supply chain plan. Optimizer uses for example the following penalty key figures as input:
- Non-delivery cost rate
- Production cost (Fixed and per unit rate)
- Transportation cost (Fixed and per unit rate)
- External procurement cost (Fixed and per unit rate)
- Inventory holding cost rate (Per unit rate)
- Safety-stock violation cost (Per unit rate)
I will not go for the details of how supply chain optimizer works. I will concentrate to explain the standard key figures related to showing the planning results on monetary terms (finance view).
Finance View with SAP IBP
First input data that we need to know is the sales price for product / customer level:


Then we need to have the unit price on product / location level. This key figure would most probably to be brought from external system to SAP IBP. This key figure is used to calculate various key figures representing value: Unit cost key figure base planning level is product / location / currency but there is also key figure calculation to calculate the average unit cost on product level. This is needed to calculate product / customer level calculations. Product / location level data can be used to calculate manufacturing plant related costs.
To be able to calculate the revenue and profits for a product and/or customer level we need to know the constrained receipts for a particular customer. Heuristic planning together with manual decisions can be used to plan customer receipts. Also like explained earlier optimization run can be used to derive the constrained customer receipts amount. The customer receipts volumes or production receipts are then used to calculate cost related key figures.
 When we have the constrained volume for the customer then we can calculate the revenue based on the volume and planned price. Calculation is done on product / location / customer level and also summed up on product / customer level:
 To be able to calculate the gross profit on product / customer level we need to calculate the costs on product / customer level by using helper key figure HGCROSSCOSTS. This helper key figure uses the average product level unit cost and the customer receipts to derive the costs. There is no standard key figure to calculate the results of this but below I have added additional key figure to show the results of the helper key figure calculation:
 Then we can calculate on product / customer level the gross profit by reducing the costs from the revenue:
 Indirect costs is also a key figure where the data can be brought from external system. Data is stored on product / customer level:

Then we can finally calculate operating profit on product / customer level based on the gross profit minus the indirect costs:

Overall key figures used and the calculation logic:

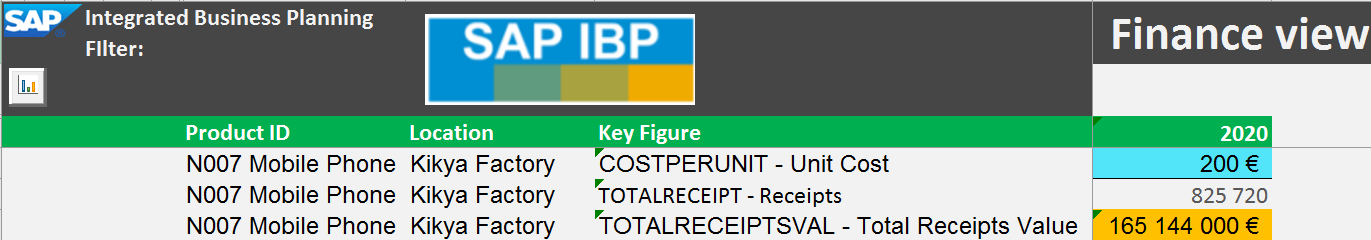
SAP IBP Finance view:

The above is the overall view of the monetary results of the supply chain plans. Data can be off course aggregated and dis-aggregated based on the specific need by: Time, product and customer master data attributes. There are still other value related standard key figures like below:
For the above the basic idea is pretty similar for each. For example total receipts value key figure is calculated by multiplying the unit costs on product / location level with the total receipts in the manufacturing plant. Then we can see the manufacturing location related costs. Similar way we can calculate for example initial stock value (stock multiplied by the unit cost). Example of the total receipts value:

By using IBP functionalities like attribute transformation, period shift, etc. there is also possibilities to enhance the financial calculations. For example you could calculate all the costs occurred in the supply chain to derive the sales price for the customer. This would off course change then based on the costs occurred on different time horizons and would bring more details to the plans. For example you could say that next year some component purchase price increases 20% and transportation costs would be lowered by 7% because of a new deal with a transportation service provider. Based on these changes the new sales price would be calculated for next year and this would be used to calculate the above financial key figures.
Conclusions
By using the finance related key figures and the calculations there is almost unlimited possibilities to view the financial affects of the supply chain plans. They are not giving the most detailed level financial plans but they can guide companies to make accurate decisions based on financial view in addition to the volume view. Companies can create several scenarios and compare the results based on volume and money. Based on the results the most optimal company overall solution can be selected.
I would say that there are several possibilities how to integrate finance to the integrated business planning and companies need to find the most suitable for their planning needs.
Thanks for reading and all the best,
Jaakko Keskitalo


Source of the pictures: All the pictures are made by myself
2 Comments
You must be a registered user to add a comment. If you've already registered, sign in. Otherwise, register and sign in.
Labels in this area
-
aATP
1 -
ABAP Programming
1 -
Activate Credit Management Basic Steps
1 -
Adverse media monitoring
1 -
Alerts
1 -
Ausnahmehandling
1 -
bank statements
1 -
Bin Sorting sequence deletion
1 -
Bin Sorting upload
1 -
BP NUMBER RANGE
1 -
Brazil
1 -
Business partner creation failed for organizational unit
1 -
Business Technology Platform
1 -
Central Purchasing
1 -
Charge Calculation
2 -
Cloud Extensibility
1 -
Compliance
1 -
Controlling
1 -
Controlling Area
1 -
Data Enrichment
1 -
DIGITAL MANUFACTURING
1 -
digital transformation
1 -
Dimensional Weight
1 -
Direct Outbound Delivery
1 -
E-Mail
1 -
ETA
1 -
EWM
6 -
EWM - Delivery Processing
2 -
EWM - Goods Movement
3 -
EWM Outbound configuration
1 -
EWM-RF
1 -
EWM-TM-Integration
1 -
Extended Warehouse Management (EWM)
3 -
Extended Warehouse Management(EWM)
7 -
Finance
1 -
Freight Settlement
1 -
Geo-coordinates
1 -
Geo-routing
1 -
Geocoding
1 -
Geographic Information System
1 -
GIS
1 -
Goods Issue
2 -
GTT
2 -
IBP inventory optimization
1 -
inbound delivery printing
1 -
Incoterm
1 -
Innovation
1 -
Inspection lot
1 -
intraday
1 -
Introduction
1 -
Inventory Management
1 -
Localization
1 -
Logistics Optimization
1 -
Map Integration
1 -
Material Management
1 -
Materials Management
1 -
MFS
1 -
Outbound with LOSC and POSC
1 -
Packaging
1 -
PPF
1 -
PPOCE
1 -
PPOME
1 -
print profile
1 -
Process Controllers
1 -
Production process
1 -
QM
1 -
QM in procurement
1 -
Real-time Geopositioning
1 -
Risk management
1 -
S4 HANA
1 -
S4-FSCM-Custom Credit Check Rule and Custom Credit Check Step
1 -
S4SCSD
1 -
Sales and Distribution
1 -
SAP DMC
1 -
SAP ERP
1 -
SAP Extended Warehouse Management
2 -
SAP Hana Spatial Services
1 -
SAP IBP IO
1 -
SAP MM
1 -
sap production planning
1 -
SAP QM
1 -
SAP REM
1 -
SAP repetiative
1 -
SAP S4HANA
1 -
SAP Transportation Management
2 -
SAP Variant configuration (LO-VC)
1 -
SD (Sales and Distribution)
1 -
Source inspection
1 -
Storage bin Capacity
1 -
Supply Chain
1 -
Supply Chain Disruption
1 -
Supply Chain for Secondary Distribution
1 -
Technology Updates
1 -
TMS
1 -
Transportation Cockpit
1 -
Transportation Management
2 -
Visibility
2 -
warehouse door
1 -
WOCR
1
Related Content
- What's new with Collaborative Maintenance? in Supply Chain Management Blogs by SAP
- “Mind the Gap” – Improves ROI, Cost & Margin by Merging Planning Processes in Supply Chain Management Blogs by SAP
- RISE with SAP Advanced Logistics Package in Supply Chain Management Blogs by SAP
- SAP Field Logistics: Centralized Supplier Item Repository for an Optimized Rental Process in Supply Chain Management Blogs by SAP
- Drive productivity, safely and sustainably, with SAP manufacturing solutions in Supply Chain Management Blogs by SAP
Top kudoed authors
| User | Count |
|---|---|
| 3 | |
| 2 | |
| 2 | |
| 2 | |
| 1 | |
| 1 | |
| 1 | |
| 1 | |
| 1 | |
| 1 |