
- SAP Community
- Products and Technology
- Technology
- Technology Blogs by SAP
- Application Performance Monitoring with Focused RU...
Technology Blogs by SAP
Learn how to extend and personalize SAP applications. Follow the SAP technology blog for insights into SAP BTP, ABAP, SAP Analytics Cloud, SAP HANA, and more.
Turn on suggestions
Auto-suggest helps you quickly narrow down your search results by suggesting possible matches as you type.
Showing results for
Product and Topic Expert
Options
- Subscribe to RSS Feed
- Mark as New
- Mark as Read
- Bookmark
- Subscribe
- Printer Friendly Page
- Report Inappropriate Content
04-08-2020
7:39 AM

Monitoring the performance of business-critical application is a complex challenge that requires advanced performance management tools capable of supporting large or very large solutions and addressing the needs of multiple teams and organisations.
- During normal operations, SAP Competency Centers teams must understand the number of users accessing applications in order to establish performance baselines allowing proactive monitoring.
- During issue resolutions, SAP Operations teams need to know how many end-users are affected and which users are affected.
- During system updates, SAP Basis teams must understand which end-users are impacted by a downtime of transactions, systems and services.
- To ensure business continuity and application support, SAP Application manager must have dedicated views showing the real-time status on their business applications and on the underlying components (on-premise / cloud) supporting their solutions.
By better understanding end-users, SAP Teams can run applications at their maximum performance by optimising resource usage and solving problems faster when they occur.
Focused RUN tools / features matrix
| Features | Tools |
| Measuring the availability, the response time for each and every business transaction and services. | System Monitoring: https://support.sap.com/en/alm/focused-solutions/focused-run-expert-portal/system-monitoring.html |
| Understanding user’s behaviours by measuring the real end-user experience performance of all users at all locations all the time. | Real User Monitoring: https://support.sap.com/en/alm/focused-solutions/focused-run-expert-portal/rum-real-user-monitoring.... |
| Controlling service level objectives with virtual users running scripts at regular intervals from multiple physical locations. | Synthetic User Monitoring: https://support.sap.com/en/alm/focused-solutions/focused-run-expert-portal/synthetic-user-monitoring... |
| Drill-down into user actions to diagnose bottlenecks and quickly isolate and resolve issues. | End to end trace analysis: https://support.sap.com/en/alm/focused-solutions/focused-run-expert-portal/trace-analysis.html |
| Building dashboards combining all data sources in single views to get immediate insights on solutions performance. | Analytics: https://support.sap.com/en/alm/focused-solutions/focused-run-expert-portal/occ-dashboard.html |
Monitor System KPIs for your SAP systems and database
Service level views helps you to control your main KPIs. It displays in real-time, performance counters attached to the systems or the underlying databases of your SAP solutions together with core business transactions (SAP GUI or Fiori) and cloud services metrics.

View all active alerts of your SAP Solutions
In the alert tickers, you can see all alerts raised for your systems, interfaces and applications. Understand abnormal situations occurring on your solutions and allow operations teams for fast and efficient recovery of services with an aggregated summary of alerts.

Analyse your users experience from various locations
SAP user response times or number of applications access counts are aggregated by countries to provide insights on performance locations.
All real-user requests cross system and cross technology are monitored and correlated with server-side measured data to provide insights for your applications performances seen by your end-users.
You can find immediately if a group of users or applications show performances degradation.

Detect performance degradations before your end-users
By controlling synthetic user’s actions from different locations, you can detect proactively performance degradations affecting your end-users.
Simulating users via recorded and customised scenarios (scripts) helps you monitor the performance and availability of Applications, APIs, or Cloud Services from multiple locations across your global landscape.

Each scripts execution gives you access detailed traces from front-end to back-end. You can identify any components having performances issues.
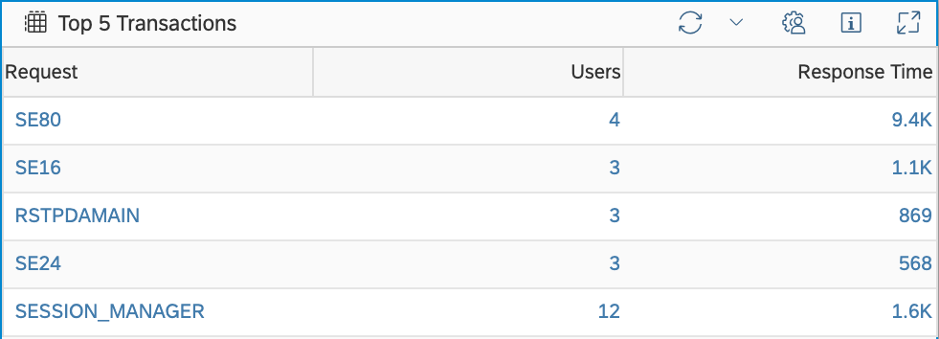
Find slow transaction
Aggregated views give you immediate insights on the performance of your business applications: For example, you can identify the slowest performing transaction or the most used Fiori applications.
You can always focus on the most pressing issues having the greatest impact on your users's experience.

Understand user sessions
Troubleshoot each individual user session by understanding which transaction or Fiori applications were executed by a user. In addition, you know when they were executed with the response time of each execution.

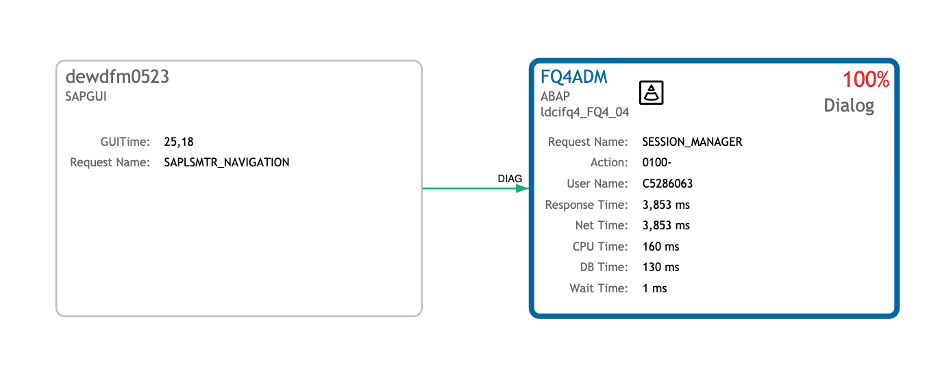
Understand the root cause of response time degradation
Find out where the root cause of the problems is, by tracking individual end-to-end sessions with a detailed analysis of response time, CPU, database or network times.
Detect outliers and follow trends
Synthetic monitoring helps you build performances benchmarks and usage patterns to obtain information on abnormal situations by creating and comparing distribution profiles (daily, Hourly, Weekly, …).
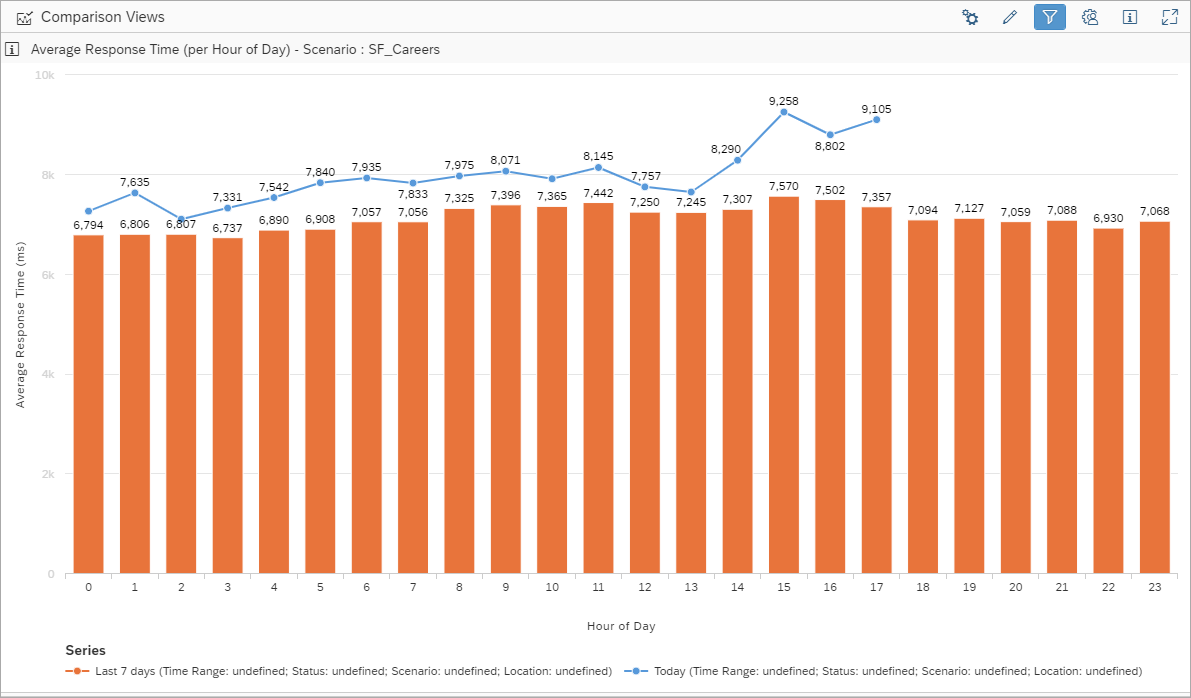
You can compare scenario performances over time and understand your trends for user’s behavior and systems usages to proactively detect performances issues.

- SAP Managed Tags:
- SAP Focused Run
Labels:
You must be a registered user to add a comment. If you've already registered, sign in. Otherwise, register and sign in.
Labels in this area
-
ABAP CDS Views - CDC (Change Data Capture)
2 -
AI
1 -
Analyze Workload Data
1 -
BTP
1 -
Business and IT Integration
2 -
Business application stu
1 -
Business Technology Platform
1 -
Business Trends
1,661 -
Business Trends
87 -
CAP
1 -
cf
1 -
Cloud Foundry
1 -
Confluent
1 -
Customer COE Basics and Fundamentals
1 -
Customer COE Latest and Greatest
3 -
Customer Data Browser app
1 -
Data Analysis Tool
1 -
data migration
1 -
data transfer
1 -
Datasphere
2 -
Event Information
1,400 -
Event Information
64 -
Expert
1 -
Expert Insights
178 -
Expert Insights
273 -
General
1 -
Google cloud
1 -
Google Next'24
1 -
Kafka
1 -
Life at SAP
784 -
Life at SAP
11 -
Migrate your Data App
1 -
MTA
1 -
Network Performance Analysis
1 -
NodeJS
1 -
PDF
1 -
POC
1 -
Product Updates
4,577 -
Product Updates
326 -
Replication Flow
1 -
RisewithSAP
1 -
SAP BTP
1 -
SAP BTP Cloud Foundry
1 -
SAP Cloud ALM
1 -
SAP Cloud Application Programming Model
1 -
SAP Datasphere
2 -
SAP S4HANA Cloud
1 -
SAP S4HANA Migration Cockpit
1 -
Technology Updates
6,886 -
Technology Updates
403 -
Workload Fluctuations
1
Related Content
- SAP HANA Cloud Vector Engine: Quick FAQ Reference in Technology Blogs by SAP
- Capture Your Own Workload Statistics in the ABAP Environment in the Cloud in Technology Blogs by SAP
- 10+ ways to reshape your SAP landscape with SAP Business Technology Platform - Blog 7 in Technology Blogs by SAP
- 10+ ways to reshape your SAP landscape with SAP Business Technology Platform – Blog 4 in Technology Blogs by SAP
- SAP Document and Reporting Compliance - 'Colombia' - Contingency Process in Technology Blogs by SAP
Top kudoed authors
| User | Count |
|---|---|
| 12 | |
| 10 | |
| 9 | |
| 7 | |
| 7 | |
| 7 | |
| 6 | |
| 6 | |
| 5 | |
| 4 |