
- SAP Community
- Products and Technology
- Technology
- Technology Blogs by Members
- Best experience: Creation of HANA Indexes part II
Technology Blogs by Members
Explore a vibrant mix of technical expertise, industry insights, and tech buzz in member blogs covering SAP products, technology, and events. Get in the mix!
Turn on suggestions
Auto-suggest helps you quickly narrow down your search results by suggesting possible matches as you type.
Showing results for
jgleichmann
Active Contributor
Options
- Subscribe to RSS Feed
- Mark as New
- Mark as Read
- Bookmark
- Subscribe
- Printer Friendly Page
- Report Inappropriate Content
03-01-2020
2:43 PM
last updated: 2023-07-26 08:45 CET
This is the second part of the blog series "Best experience: Creation of HANA Indexes". The first part can be found here.
Content:
- Starting with indexes (part I)
- Limitations (part I)
- SAP recommendations (part I)
- Evaluate expensive statements (part I)
- Analyzing the system
- Performance comparison
- Tools
- Recommendations
5. Analyzing the system
If you don’t have any performance issues and no complaints from business users stop optimizing a system which don’t needs it. Every index has also side effects which should be evaluated carefully.
For the start check the current primary key and existing indexes of your table.
This can be done via scripts from the SQL collection (note 1969700).
If you only have the table name use the following statement:
HANA_Tables_ColumnStore_Columns
( SELECT                                      /* Modification section */

          '%' HOST,

          '%' PORT,

          '%' SERVICE_NAME,

          '%' SCHEMA_NAME,

          '<insert_table_name>' TABLE_NAME,

          '%' DATA_TYPE,

          40  COLUMN_NAME_LENGTH_LIMIT,

          '% ATTRIBUTE_TYPE,       /* CONCAT_ATTRIBUTE, TREX_EXTERNAL_KEY, TREX_UDIV, ROWID, TEXT, UNKNOWN, % */

          '%' COMPRESSION_TYPE,

          '%' LOADED,

          '%' PAGEABLE,

          ' ' ONLY_INTERNAL_COLUMNS,

          ' ' EXCLUDE_PK_AND_UNIQUE,

          ' ' GENERATE_DROP_CONCAT_ATT_COMMAND,

          'TABLE' OBJECT_LEVEL,    /* TABLE, PARTITION */

          'NONE' AGGREGATE_BY,     /* HOST, PORT, SERVICE, SCHEMA, TABLE, COLUMN, DATA_TYPE, ATT_TYPE, PAGEABLE, LOADED, COMPRESSION or combinations, NONE for no aggregation */

          'SIZE' ORDER_BY,                          /* SIZE, TABLE */
Please check the compression type (see part I - sparse / prefixed) for the possible affected index columns.
If you already have the statement hash use (which also includes the CS columns):
HANA_SQL_StatementHash_DataCollector* (depending on your revision)
( SELECT                /* Modification section */

      '1000/10/18 07:58:00' BEGIN_TIME,                  /* YYYY/MM/DD HH24:MI:SS timestamp, C, C-S<seconds>, C-M<minutes>, C-H<hours>, C-D<days>, C-W<weeks>, E-S<seconds>, E-M<minutes>, E-H<hours>, E-D<days>, E-W<weeks>, MIN */

      '9999/10/18 08:05:00' END_TIME,                    /* YYYY/MM/DD HH24:MI:SS timestamp, C, C-S<seconds>, C-M<minutes>, C-H<hours>, C-D<days>, C-W<weeks>, B+S<seconds>, B+M<minutes>, B+H<hours>, B+D<days>, B+W<weeks>, MAX */

      '<insert_hash>' STATEMENT_HASH,

      -1 PLAN_ID,

      20 MAX_RESULT_LINES,

      86400 TRACE_HISTORY_S,

      200 LINE_LENGTH,

      ' ' SHOW_COMPLETE_BIND_VALUE_LIST,

      'H' TIME_UNIT                    /* MS, S, M, H, D */
In our example: Hash 426bdc1658f5f21d5bebf85ec4ab9c2c
******************

* THREAD SAMPLES *

******************

SAMPLES PERCENT HOST     PORT  THREAD_TYPE

======= ======= ======== ===== ==============================

   5033   54.07 hostname 30040 SqlExecutor

   4275   45.92 hostname 30040 JobWorker

SAMPLES PERCENT THREAD_STATE     LOCK_NAME

======= ======= ================ ======================================================================

   8209   88.19 Running          ?

   1093   11.74 Job Exec Waiting JobBarrier Wait for Jobs

      3    0.03 Job Exec Waiting ?

      2    0.02 Mutex Wait       unnamed Mutex

      1    0.01 Mutex Wait       ?

SAMPLES PERCENT THREAD_TYPE THREAD_METHOD

======= ======= =========== ==================================================

   5033   54.07 SqlExecutor ExecutePrepared

   4043   43.43 JobWorker   RleScanVecOutJob<range>

    230    2.47 JobWorker   <unknown method>

      2    0.02 JobWorker   BarrierEmptyJob

SAMPLES PERCENT THREAD_TYPE THREAD_METHOD           THREAD_DETAIL

======= ======= =========== ======================= ================================================================================

   5033   54.07 SqlExecutor ExecutePrepared         SELECT COUNT(*) FROM "VBEP" WHERE "MANDT" = ? AND "VBELN" = ? AND "EDATU" = ?

   4043   43.43 JobWorker   RleScanVecOutJob<range> ?

    230    2.47 JobWorker   <unknown method>        <unknown job>

      2    0.02 JobWorker   BarrierEmptyJob         ParallelDispatcher
To interpret the thread methods you can use SAP note 2114710.
ExecutePrepared stands just for the execution of an already prepared statement which is normal and no indicator for an intervention.
Completely different with RleScanVecOutJob<range>. This thread method is a definitely an indicator for a need of an index.
Another indicator can be check 890 and 1125 of the mini checks (HANA_Configuration_MiniChecks*):
|M0890|Unusual frequent thread methods (last hour)    |        |IndirectScanBvOutJob<BV> (5.33 threads)                      |none          |X| 2114710|

|M1125|Columns with many scanned records              |        |MSEG.BUDAT_MKPF (41067249/s)                                 |none          |X| 2000002|

|M1125|Columns with many scanned records              |        |MSEG.MANDT (16265794/s)                                      |none          |X| 2000002|

|M1125|Columns with many scanned records              |        |MSEG.MATNR (375450570/s)                                     |none          |X| 2000002|

|M1125|Columns with many scanned records              |        |MSEG.MJAHR (354290653/s)                                     |none          |X| 2000002|

|M1125|Columns with many scanned records              |        |MSEG.WERKS (28137626/s)                                      |none          |X| 2000002|
Indication of necessity of an index
Thread methods like
- IndirectScanBvOutJob*
- JobParallelMgetSearch
- JobParallelPagedMgetSearch
- PrefixedScanVecOutJob
- PrefixedScanVecOutJob<range>
- RlePredScanJob<ScanVectorBinSearchPredicate>(out=vector)
- RlePredScanJob<ScanVectorPredicate>(out=vector)
- RleScanBvOutJob<BV>
- RleScanBvOutJob<range>
- RleScanVecOutJob<BV>
- RleScanVecOutJob<range>
- RleScanBvOutJob
- scanWithoutIndex
- ClusterIndexScanBvOutJob<ScanRangePredicate>
- ClusterScanBvOutJob<BV>
- ClusterScanBvOutJob<range>
- ClusterScanVecOutJob<range>
- SparseBvScanBvOutJob
- SparseBvScanVecOutJob
- SparsePredScanBvOutJob<ScanRangesPredicate>
- SparsePredScanVecOutJob<ScanRangesPredicate>
- SparsePredScanVecOutJob<ScanVectorBinSearchPredicate>
- SparsePredScanVecOutJob<ScanVectorPredicate>
- SparseRangeScanBvOutJob
- SparseRangeScanVecOutJob
- sparseSearch
- sse_icc_lib::mgetSearchi_AVX2impl
- sse_icc_lib::mgetSearchi_AVX
If you have found out the thread method, you have to go for the statement hash:
HANA_Threads_ThreadSamples_AggregationPerTimeSlice*
          ( SELECT                                                      /* Modification section */

              '1000/10/18 07:58:00' BEGIN_TIME,                  /* YYYY/MM/DD HH24:MI:SS timestamp, C, C-S<seconds>, C-M<minutes>, C-H<hours>, C-D<days>, C-W<weeks>, E-S<seconds>, E-M<minutes>, E-H<hours>, E-D<days>, E-W<weeks>, MIN */

              '9999/10/18 08:05:00' END_TIME,                    /* YYYY/MM/DD HH24:MI:SS timestamp, C, C-S<seconds>, C-M<minutes>, C-H<hours>, C-D<days>, C-W<weeks>, B+S<seconds>, B+M<minutes>, B+H<hours>, B+D<days>, B+W<weeks>, MAX */

              'SERVER' TIMEZONE,                              /* SERVER, UTC */

              '%' HOST,

              '%' PORT,

              -1  THREAD_ID,

              '%' THREAD_TYPE,                /* e.g. 'SqlExecutor', 'JobWorker' or 'MergedogMonitor' */

              '%' THREAD_STATE,               /* e.g. 'Running', 'Network Read' or 'Semaphore Wait' */

              'RleScanVecOutJob%' THREAD_METHOD,

              '%' THREAD_DETAIL,

              '%' STATEMENT_HASH,

              '%' ROOT_STATEMENT_HASH,

              '%' STATEMENT_ID,

              '%' STATEMENT_EXECUTION_ID,

              '%' DB_USER,

              '%' APP_NAME,

              '%' APP_USER,

              '%' APP_SOURCE,

              '%' LOCK_TYPE,

              '%' LOCK_NAME,

              -1  NUMA_NODE,

              '%' CLIENT_IP,

              -1  CLIENT_PID,

              -1  CONN_ID,

              -1  MIN_SAMPLES_TOTAL,

              60 TIME_SLICE_S,

              'X' EXCLUDE_SERVICE_THREAD_SAMPLER,

              'X' EXCLUDE_NEGATIVE_THREAD_IDS,

              'X' EXCLUDE_PHANTOM_THREADS,

              ' ' EXCLUDE_EMPTY_STATEMENT_IDS,

              ' ' EXCLUDE_EMPTY_STATEMENT_EXECUTION_IDS,

              'CURRENT' DATA_SOURCE,

              'HASH' AGGREGATE_BY,     /* SAMPLE_TIME, HOST, PORT, THREAD_ID, THREAD_TYPE, THREAD_METHOD, THREAD_DETAIL, THREAD_STATE, STATE_LOCK, HASH, ROOT, DB_USER, APP_NAME, APP_USER, APP_SOURCE, CLIENT_IP, CLIENT_PID, CONN_ID, LOCK_TYPE, LOCK_NAME, STATEMENT_ID, STAT_EXEC_ID, NUMA_NODE */

              -1 RESULT_ROWS
=> in this example thread method RleScanVecOutJob (may be you have to adjust the data source to HISTORY)

If you have found out the hash, you can translate it readable to SQL text via
HANA_SQL_StatementHash_SQLText:
  ( SELECT                         /* Modification section */

      '426bdc1658f5f21d5bebf85ec4ab9c2c' STATEMENT_HASH,

      60 LINE_LENGTH_TARGET,

      ' ' ADD_BLANK_AFTER_COMMA,

      ' ' REPLACE_BINDS,

      'EXPENSIVE_STATEMENTS' BIND_VALUES
426bdc1658f5f21d5bebf85ec4ab9c2c
SELECT COUNT(*) FROM "VBEP" WHERE "MANDT" = ? AND "VBELN" =
? AND "EDATU" = ?From the ColStats you can see which col is frequently scanned and has no index (=>INDEX_TYPE=NONE):

For more details you have to look into the explain plan and the planviz. (not part of this blog series)
At first have a look at the where clause. The ideal index would be on MANDT, VBELN and EDATU. But you should choose as less columns as possible. For this you can calculate the selectivity as stated out in this blog. Alternatively, you test more variation with the performance comparison (see below).
In most of the systems with only one client you can create a single col index on EDATU (due selectivity). In our case we have more than 20 clients which makes it worth to add the client column MANDT to the index.
Result in a multi columns index on:
- MANDT
- EDATU
Hint: Be ware that HANA can't evaluate ranges in multi column indexes, you can manually create an additional single column index on the parallelization column. |
6. Performance comparison
A before/after comparison is possible with the SQL: HANA_SQL_StatementHash_DiffReport

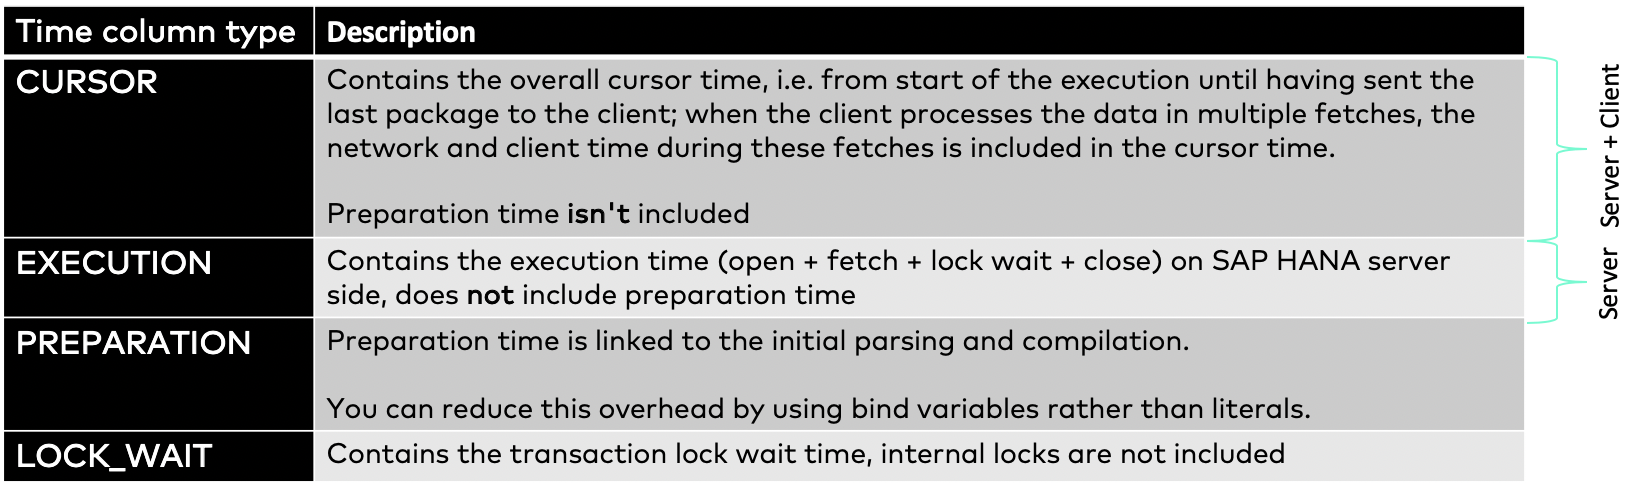
The difference of cursor and execution time is that the cursor time includes the client time.
6.1 Another example incl. thread method changes
Before

******************

* THREAD SAMPLES *

******************


SAMPLES PERCENT HOST                           PORT THREAD_TYPE

======= ======= ============================= ===== ==============================

   2144   68.30 hostname                      30040 JobWorker

    995   31.69 hostname                      30040 SqlExecutor


SAMPLES PERCENT THREAD_STATE                        LOCK_NAME

======= ======= =================================== ======================================================================

   2618   83.40 Running                             ?

    518   16.50 Job Exec Waiting                    JobBarrier Wait for Jobs

      3    0.09 Job Exec Waiting                    ?


SAMPLES PERCENT THREAD_TYPE          THREAD_METHOD

======= ======= ==================== ==================================================

   1988   63.33 JobWorker            SparseIndexScanVecOutJob

    995   31.69 SqlExecutor          ExecQidItab

     86    2.73 JobWorker            IndirectIndexScanVecOutJob

     65    2.07 JobWorker            RleScanVecOutJob

      5    0.15 JobWorker


SAMPLES PERCENT THREAD_TYPE          THREAD_METHOD                                      THREAD_DETAIL

======= ======= ==================== ================================================== ================================================================================

   1988   63.33 JobWorker            SparseIndexScanVecOutJob       ?

    995   31.69 SqlExecutor          ExecQidItab                                        ?

     86    2.73 JobWorker            IndirectIndexScanVecOutJob     ?

     65    2.07 JobWorker            RleScanVecOutJob                            ?

      5    0.15 JobWorker
| 63% SparseIndexScanVecOutJob 32% ExecQidItab 3% IndirectIndexScanVecOutJob |
Nearly 2/3 of the time were spend on thread methods which are an indicator for a need of an index.
After

Executions	15100

Records	474	0,03

Preparations	2	0

STAT_NAME		   VALUE		VALUE_PER_EXEC		VALUE_PER_ROW

Elapsed	time	    0,34	h	 82,8	ms	          2637,73	ms

Execution	time	0,34	h	 82,77	ms	          2636,92	ms

Preparation	time	0	    h	  0,02	ms	             0,81	ms

Lock	wait time	0	    h	  0	ms	                 0	    ms
******************
* THREAD SAMPLES *
******************
SAMPLES PERCENT HOST PORT THREAD_TYPE
======= ======= ============================= ===== ==============================
13 100.00 hostname 30040 SqlExecutor
SAMPLES PERCENT THREAD_STATE LOCK_NAME
======= ======= =================================== ======================================================================
13 100.00 Running ?
SAMPLES PERCENT THREAD_TYPE THREAD_METHOD
======= ======= ==================== ==================================================
13 100.00 SqlExecutor ExecQidItab
SAMPLES PERCENT THREAD_TYPE THREAD_METHOD THREAD_DETAIL
======= ======= ==================== ================================================== ================================================================================
13 100.00 SqlExecutor ExecQidItab ?
=> 100% ExecQidtab
=> but still room for improvement, but not for the execution plan => optimize compression
7. Tools
7.1 SHDB_INDEX_ANALYZE
The report SHDB_INDEX_ANALYZE from SAP note 1794297 should be executed as post conversion task.
"SHDB_INDEX_ANALYZE analyzes the data distribution of the largest tables in the system and suggests indexes on those fields which are highly selective and part of secondary indexes defined for traditional data bases. This report analyzes SAP and customer tables and indexes. This report has to run on the system already ported to HANA and should contain the full production data."
7.2 SHDB_INDEX_CREATE
"SHDB_INDEX_CREATE creates secondary indexes based on a suggestion list imported into the select option INDFLD. The naming convention of this list per entry is
-Three characters to identify the SAP or customer namespace (SAP or. CUS)
-table name
-"~"
-field name
If available this report should run in the corresponding development system. The created indexes will then be transported through the landscape with standard mechanisms."
7.3 SHDB_INDEX_CHECK
SHDB_INDEX_CHECK checks the created Indexes and ensures that all required indexes are created on the HANA data base. Additionally, the corresponding transport request entries are created.
7.4 indexAdvisor.py
Use the index adviser to find out for which tables and columns indexing would be most valuable. The indexAdvisor.py script is part of a SAP HANA system installation and runs from the command line. It is located in the $DIR_INSTANCE/exe/python_support directory.
=> AFAIK: This index advisor is not available any more in HANA 2.0 even though the documentation is saying something else...
7.5 SQL Collection
The best tool to analyze the performance and determine the col combinations for an index are statements in note 1969700. Get familiar with them and combine it with the know-how of the most popular FAQ HANA notes. There is no silver bullet as general recommendation.
7.6 SHDB_CONV_INV_HASH_PK
If you want to convert inverted hash indexes for exisiting tables which have been created before HANA2 SP3 you can use the report SHDB_CONV_INV_HASH_PK. The report converts the primary key from the tables for which the flag PK_IS_INVHASH is set in the DDIC table DD02L.
Please be aware that during the conversion the table is locked and the table content cannot be modified. The conversion times will depend on the amount of data volume in the table.
8. Recommendations / Tips
8.1 Check current metadata
Check if there is already an index, because of some internal rules:
- Implicit single column indexes when creating primary key
- Implicit single column indexes on compressed columns
If a column is compressed with a compression type supporting a BLOCK index and the size of the single column index isn't larger than 10 % of the column size, a single column index is automatically created. You can check this with SQL HANA_Table_ColumnStore_Columns*:
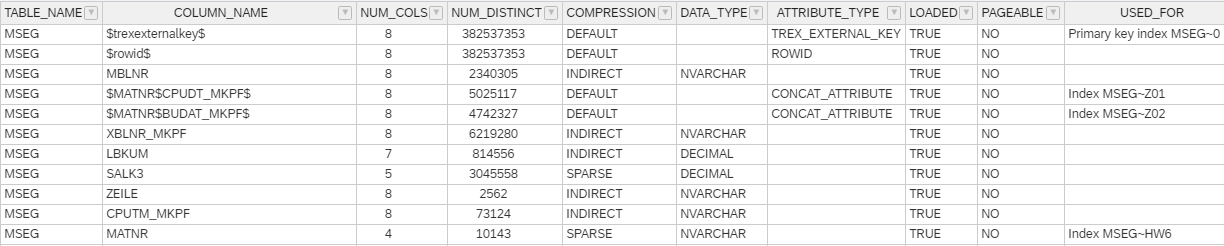
HANA_Table_ColumnStore_Columns: MSEG Table Columns
as well with HANA_Indexes_Columns*:
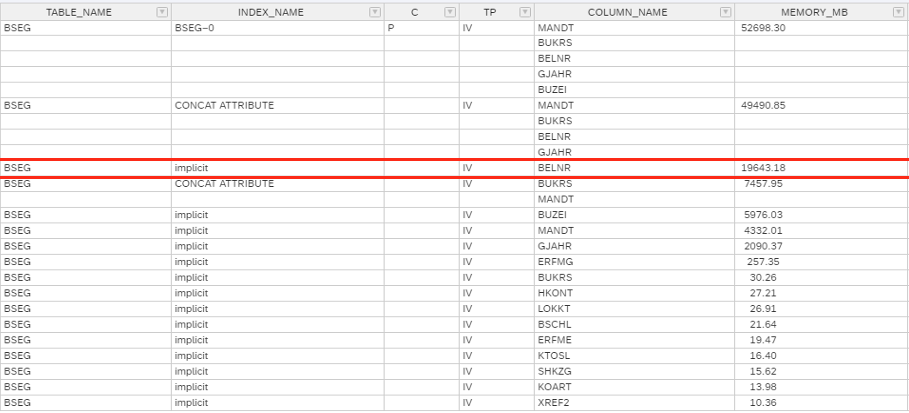
HANA_Indexes_Columns: BSEG
In this example BELNR of table BSEG is not part of the primary key and has no manually created index, but it has an own inverted value (IV) index.
8.2 Use as less indexes as possible
Please create indexes only if you have a good reason for it. This means the performance boost by a select has to be bigger by factor 4-10 than the costs of a change of the data. This can change over time, but should be considered in your initial tests.
8.3 Multi CS indexes
Avoid multi Column indexes aka concat attributes! The larger the table, the more the disadvantages arise with them. Means if the table is small you won't recognize a difference in performance on other operations than select. But there will be a break even point when those attributes will kill the performance.
8.4 Performance disadvantages
It is possible that a drop in a multi-column index (including PK) can speed up your partitioning process. For this you have to measure one run with indexes and one without incl. recreation of indexes.
The amount of data changes and at a given point in time this can have influence on the choice of compression which has also an effect on the indexes. This means you should reorg (=optimize compression) you tables from time to time.
8.5 Speed up index creation
indexserver.ini -> [joins] -> single_thread_execution_for_partitioned_tables to 'false'.
indexserver.ini -> [global] -> create_index_optimize_bulksize
indexserver.ini -> [ddl] -> max_number_of_data_jobs
indexserver.ini -> [ddl] -> merging_unique_check_threshold
You can set the parameter indexserver.ini -> [global] -> create_index_optimize_bulksize (default: 40000000) to a higher value in order to shift resource consumption from CPU to memory. You can set the parameter indexserver.ini -> [global] -> create_index_optimize_bulksize (default: 40000000 for SAP HANA <= 2.0 SPS 06, 0 respectively individual calculation based on memory limits for SAP HANA >= 2.0 SPS 07) to a higher value in order to shift resource consumption from CPU to memory. A value of 0 or higher than the table rows deactivates bulk processing completely and provides optimal performance at the cost of high memory consumption. Be aware that this setting only applies to column loadable indexes, so if page loadable / NSE (SAP Note 2799997) is active for the index, it can't be used. (Source: SAP note 2000000).
For partitioned tables the parameter max_number_of_data_jobs is interesting. It can be used to balance between performance, CPU and memory. Per default, this parameter is only limited by the general concurrency settings (SAP Note 2222250), resulting in potentially high CPU and memory consumption and good performance. By reducing it you can reduce the number of concurrently processed partitions and as a consequence also the peak memory utilization. For example, max_number_of_data_jobs = 2 makes sure that only two partitions are processed at the same time and so also the CREATE INDEX memory overhead is lower compared to a parallel processing of more than two partitions. At the same time the overall CREATE INDEX runtime can increase.
In case of memory issues (uniqueness check) due to the creation of an index please use parameter merging_unique_check_threshold with a value of 2000000000.
Summary
At the end you achieve the best performance if you avoid unnecessary workload. No workload is the best workload 😉
You have to find out the right balance when you have to create an index. Please do not create an index for every statement which is running longer as expected. Only for the most frequent once with really bad performance. Check out the threads methods and their meaning. It is also possible that you run into a known issue like described in note 2756967. Another possibility is also a bad compression on a column due to fragmentation or wrong partitioning.
Thanks to Kuto Baran who inspired me to this blog and provided input from his German session ‘Ein populärer Irrtum über HANA Indizes’. Special greetings out to Martin Frauendorfer for his amazing SQL script collection without it, it would be impossible to get useable details out of the system. Keep up the outstanding work!
Stay healthy,
-Jens (follow me on Twitter for more geeky news @JensGleichmann)
#######
Edit
#######
V1.1 Added section 8
- SAP Managed Tags:
- SAP HANA,
- SAP HANA, platform edition
3 Comments
You must be a registered user to add a comment. If you've already registered, sign in. Otherwise, register and sign in.
Labels in this area
-
"automatische backups"
1 -
"regelmäßige sicherung"
1 -
"TypeScript" "Development" "FeedBack"
1 -
505 Technology Updates 53
1 -
ABAP
14 -
ABAP API
1 -
ABAP CDS Views
2 -
ABAP CDS Views - BW Extraction
1 -
ABAP CDS Views - CDC (Change Data Capture)
1 -
ABAP class
2 -
ABAP Cloud
2 -
ABAP Development
5 -
ABAP in Eclipse
1 -
ABAP Platform Trial
1 -
ABAP Programming
2 -
abap technical
1 -
absl
1 -
access data from SAP Datasphere directly from Snowflake
1 -
Access data from SAP datasphere to Qliksense
1 -
Accrual
1 -
action
1 -
adapter modules
1 -
Addon
1 -
Adobe Document Services
1 -
ADS
1 -
ADS Config
1 -
ADS with ABAP
1 -
ADS with Java
1 -
ADT
2 -
Advance Shipping and Receiving
1 -
Advanced Event Mesh
3 -
AEM
1 -
AI
7 -
AI Launchpad
1 -
AI Projects
1 -
AIML
9 -
Alert in Sap analytical cloud
1 -
Amazon S3
1 -
Analytical Dataset
1 -
Analytical Model
1 -
Analytics
1 -
Analyze Workload Data
1 -
annotations
1 -
API
1 -
API and Integration
3 -
API Call
2 -
Application Architecture
1 -
Application Development
5 -
Application Development for SAP HANA Cloud
3 -
Applications and Business Processes (AP)
1 -
Artificial Intelligence
1 -
Artificial Intelligence (AI)
4 -
Artificial Intelligence (AI) 1 Business Trends 363 Business Trends 8 Digital Transformation with Cloud ERP (DT) 1 Event Information 462 Event Information 15 Expert Insights 114 Expert Insights 76 Life at SAP 418 Life at SAP 1 Product Updates 4
1 -
Artificial Intelligence (AI) blockchain Data & Analytics
1 -
Artificial Intelligence (AI) blockchain Data & Analytics Intelligent Enterprise
1 -
Artificial Intelligence (AI) blockchain Data & Analytics Intelligent Enterprise Oil Gas IoT Exploration Production
1 -
Artificial Intelligence (AI) blockchain Data & Analytics Intelligent Enterprise sustainability responsibility esg social compliance cybersecurity risk
1 -
ASE
1 -
ASR
2 -
ASUG
1 -
Attachments
1 -
Authorisations
1 -
Automating Processes
1 -
Automation
1 -
aws
2 -
Azure
1 -
Azure AI Studio
1 -
B2B Integration
1 -
Backorder Processing
1 -
Backup
1 -
Backup and Recovery
1 -
Backup schedule
1 -
BADI_MATERIAL_CHECK error message
1 -
Bank
1 -
BAS
1 -
basis
2 -
Basis Monitoring & Tcodes with Key notes
2 -
Batch Management
1 -
BDC
1 -
Best Practice
1 -
bitcoin
1 -
Blockchain
3 -
BOP in aATP
1 -
BOP Segments
1 -
BOP Strategies
1 -
BOP Variant
1 -
BPC
1 -
BPC LIVE
1 -
BTP
11 -
BTP Destination
2 -
Business AI
1 -
Business and IT Integration
1 -
Business application stu
1 -
Business Application Studio
1 -
Business Architecture
1 -
Business Communication Services
1 -
Business Continuity
1 -
Business Data Fabric
3 -
Business Partner
12 -
Business Partner Master Data
10 -
Business Technology Platform
2 -
Business Trends
1 -
CA
1 -
calculation view
1 -
CAP
3 -
Capgemini
1 -
CAPM
1 -
Catalyst for Efficiency: Revolutionizing SAP Integration Suite with Artificial Intelligence (AI) and
1 -
CCMS
2 -
CDQ
12 -
CDS
2 -
Cental Finance
1 -
Certificates
1 -
CFL
1 -
Change Management
1 -
chatbot
1 -
chatgpt
3 -
CL_SALV_TABLE
2 -
Class Runner
1 -
Classrunner
1 -
Cloud ALM Monitoring
1 -
Cloud ALM Operations
1 -
cloud connector
1 -
Cloud Extensibility
1 -
Cloud Foundry
4 -
Cloud Integration
6 -
Cloud Platform Integration
2 -
cloudalm
1 -
communication
1 -
Compensation Information Management
1 -
Compensation Management
1 -
Compliance
1 -
Compound Employee API
1 -
Configuration
1 -
Connectors
1 -
Consolidation Extension for SAP Analytics Cloud
1 -
Controller-Service-Repository pattern
1 -
Conversion
1 -
Cosine similarity
1 -
cryptocurrency
1 -
CSI
1 -
ctms
1 -
Custom chatbot
3 -
Custom Destination Service
1 -
custom fields
1 -
Customer Experience
1 -
Customer Journey
1 -
Customizing
1 -
cyber security
2 -
Data
1 -
Data & Analytics
1 -
Data Aging
1 -
Data Analytics
2 -
Data and Analytics (DA)
1 -
Data Archiving
1 -
Data Back-up
1 -
Data Governance
5 -
Data Integration
2 -
Data Quality
12 -
Data Quality Management
12 -
Data Synchronization
1 -
data transfer
1 -
Data Unleashed
1 -
Data Value
8 -
database tables
1 -
Datasphere
2 -
datenbanksicherung
1 -
dba cockpit
1 -
dbacockpit
1 -
Debugging
2 -
Delimiting Pay Components
1 -
Delta Integrations
1 -
Destination
3 -
Destination Service
1 -
Developer extensibility
1 -
Developing with SAP Integration Suite
1 -
Devops
1 -
digital transformation
1 -
Documentation
1 -
Dot Product
1 -
DQM
1 -
dump database
1 -
dump transaction
1 -
e-Invoice
1 -
E4H Conversion
1 -
Eclipse ADT ABAP Development Tools
2 -
edoc
1 -
edocument
1 -
ELA
1 -
Embedded Consolidation
1 -
Embedding
1 -
Embeddings
1 -
Employee Central
1 -
Employee Central Payroll
1 -
Employee Central Time Off
1 -
Employee Information
1 -
Employee Rehires
1 -
Enable Now
1 -
Enable now manager
1 -
endpoint
1 -
Enhancement Request
1 -
Enterprise Architecture
1 -
ETL Business Analytics with SAP Signavio
1 -
Euclidean distance
1 -
Event Dates
1 -
Event Driven Architecture
1 -
Event Mesh
2 -
Event Reason
1 -
EventBasedIntegration
1 -
EWM
1 -
EWM Outbound configuration
1 -
EWM-TM-Integration
1 -
Existing Event Changes
1 -
Expand
1 -
Expert
2 -
Expert Insights
1 -
Fiori
14 -
Fiori Elements
2 -
Fiori SAPUI5
12 -
Flask
1 -
Full Stack
8 -
Funds Management
1 -
General
1 -
Generative AI
1 -
Getting Started
1 -
GitHub
8 -
Grants Management
1 -
groovy
1 -
GTP
1 -
HANA
5 -
HANA Cloud
2 -
Hana Cloud Database Integration
2 -
HANA DB
1 -
HANA XS Advanced
1 -
Historical Events
1 -
home labs
1 -
HowTo
1 -
HR Data Management
1 -
html5
8 -
HTML5 Application
1 -
Identity cards validation
1 -
idm
1 -
Implementation
1 -
input parameter
1 -
instant payments
1 -
Integration
3 -
Integration Advisor
1 -
Integration Architecture
1 -
Integration Center
1 -
Integration Suite
1 -
intelligent enterprise
1 -
Java
1 -
job
1 -
Job Information Changes
1 -
Job-Related Events
1 -
Job_Event_Information
1 -
joule
4 -
Journal Entries
1 -
Just Ask
1 -
Kerberos for ABAP
8 -
Kerberos for JAVA
8 -
Launch Wizard
1 -
Learning Content
2 -
Life at SAP
1 -
lightning
1 -
Linear Regression SAP HANA Cloud
1 -
local tax regulations
1 -
LP
1 -
Machine Learning
2 -
Marketing
1 -
Master Data
3 -
Master Data Management
14 -
Maxdb
2 -
MDG
1 -
MDGM
1 -
MDM
1 -
Message box.
1 -
Messages on RF Device
1 -
Microservices Architecture
1 -
Microsoft Universal Print
1 -
Middleware Solutions
1 -
Migration
5 -
ML Model Development
1 -
Modeling in SAP HANA Cloud
8 -
Monitoring
3 -
MTA
1 -
Multi-Record Scenarios
1 -
Multiple Event Triggers
1 -
Neo
1 -
New Event Creation
1 -
New Feature
1 -
Newcomer
1 -
NodeJS
2 -
ODATA
2 -
OData APIs
1 -
odatav2
1 -
ODATAV4
1 -
ODBC
1 -
ODBC Connection
1 -
Onpremise
1 -
open source
2 -
OpenAI API
1 -
Oracle
1 -
PaPM
1 -
PaPM Dynamic Data Copy through Writer function
1 -
PaPM Remote Call
1 -
PAS-C01
1 -
Pay Component Management
1 -
PGP
1 -
Pickle
1 -
PLANNING ARCHITECTURE
1 -
Popup in Sap analytical cloud
1 -
PostgrSQL
1 -
POSTMAN
1 -
Process Automation
2 -
Product Updates
4 -
PSM
1 -
Public Cloud
1 -
Python
4 -
Qlik
1 -
Qualtrics
1 -
RAP
3 -
RAP BO
2 -
Record Deletion
1 -
Recovery
1 -
recurring payments
1 -
redeply
1 -
Release
1 -
Remote Consumption Model
1 -
Replication Flows
1 -
Research
1 -
Resilience
1 -
REST
1 -
REST API
1 -
Retagging Required
1 -
Risk
1 -
Rolling Kernel Switch
1 -
route
1 -
rules
1 -
S4 HANA
1 -
S4 HANA Cloud
1 -
S4 HANA On-Premise
1 -
S4HANA
3 -
S4HANA_OP_2023
2 -
SAC
10 -
SAC PLANNING
9 -
SAP
4 -
SAP ABAP
1 -
SAP Advanced Event Mesh
1 -
SAP AI Core
8 -
SAP AI Launchpad
8 -
SAP Analytic Cloud Compass
1 -
Sap Analytical Cloud
1 -
SAP Analytics Cloud
4 -
SAP Analytics Cloud for Consolidation
2 -
SAP Analytics Cloud Story
1 -
SAP analytics clouds
1 -
SAP BAS
1 -
SAP Basis
6 -
SAP BODS
1 -
SAP BODS certification.
1 -
SAP BTP
20 -
SAP BTP Build Work Zone
2 -
SAP BTP Cloud Foundry
5 -
SAP BTP Costing
1 -
SAP BTP CTMS
1 -
SAP BTP Innovation
1 -
SAP BTP Migration Tool
1 -
SAP BTP SDK IOS
1 -
SAP Build
11 -
SAP Build App
1 -
SAP Build apps
1 -
SAP Build CodeJam
1 -
SAP Build Process Automation
3 -
SAP Build work zone
10 -
SAP Business Objects Platform
1 -
SAP Business Technology
2 -
SAP Business Technology Platform (XP)
1 -
sap bw
1 -
SAP CAP
2 -
SAP CDC
1 -
SAP CDP
1 -
SAP CDS VIEW
1 -
SAP Certification
1 -
SAP Cloud ALM
4 -
SAP Cloud Application Programming Model
1 -
SAP Cloud Integration for Data Services
1 -
SAP cloud platform
8 -
SAP Companion
1 -
SAP CPI
3 -
SAP CPI (Cloud Platform Integration)
2 -
SAP CPI Discover tab
1 -
sap credential store
1 -
SAP Customer Data Cloud
1 -
SAP Customer Data Platform
1 -
SAP Data Intelligence
1 -
SAP Data Migration in Retail Industry
1 -
SAP Data Services
1 -
SAP DATABASE
1 -
SAP Dataspher to Non SAP BI tools
1 -
SAP Datasphere
9 -
SAP DRC
1 -
SAP EWM
1 -
SAP Fiori
2 -
SAP Fiori App Embedding
1 -
Sap Fiori Extension Project Using BAS
1 -
SAP GRC
1 -
SAP HANA
1 -
SAP HCM (Human Capital Management)
1 -
SAP HR Solutions
1 -
SAP IDM
1 -
SAP Integration Suite
9 -
SAP Integrations
4 -
SAP iRPA
2 -
SAP Learning Class
1 -
SAP Learning Hub
1 -
SAP Odata
2 -
SAP on Azure
1 -
SAP PartnerEdge
1 -
sap partners
1 -
SAP Password Reset
1 -
SAP PO Migration
1 -
SAP Prepackaged Content
1 -
SAP Process Automation
2 -
SAP Process Integration
2 -
SAP Process Orchestration
1 -
SAP S4HANA
2 -
SAP S4HANA Cloud
1 -
SAP S4HANA Cloud for Finance
1 -
SAP S4HANA Cloud private edition
1 -
SAP Sandbox
1 -
SAP STMS
1 -
SAP SuccessFactors
2 -
SAP SuccessFactors HXM Core
1 -
SAP Time
1 -
SAP TM
2 -
SAP Trading Partner Management
1 -
SAP UI5
1 -
SAP Upgrade
1 -
SAP Utilities
1 -
SAP-GUI
8 -
SAP_COM_0276
1 -
SAPBTP
1 -
SAPCPI
1 -
SAPEWM
1 -
sapmentors
1 -
saponaws
2 -
SAPS4HANA
1 -
SAPUI5
4 -
schedule
1 -
Secure Login Client Setup
8 -
security
9 -
Selenium Testing
1 -
SEN
1 -
SEN Manager
1 -
service
1 -
SET_CELL_TYPE
1 -
SET_CELL_TYPE_COLUMN
1 -
SFTP scenario
2 -
Simplex
1 -
Single Sign On
8 -
Singlesource
1 -
SKLearn
1 -
soap
1 -
Software Development
1 -
SOLMAN
1 -
solman 7.2
2 -
Solution Manager
3 -
sp_dumpdb
1 -
sp_dumptrans
1 -
SQL
1 -
sql script
1 -
SSL
8 -
SSO
8 -
Substring function
1 -
SuccessFactors
1 -
SuccessFactors Time Tracking
1 -
Sybase
1 -
system copy method
1 -
System owner
1 -
Table splitting
1 -
Tax Integration
1 -
Technical article
1 -
Technical articles
1 -
Technology Updates
1 -
Technology Updates
1 -
Technology_Updates
1 -
Threats
1 -
Time Collectors
1 -
Time Off
2 -
Tips and tricks
2 -
Tools
1 -
Trainings & Certifications
1 -
Transport in SAP BODS
1 -
Transport Management
1 -
TypeScript
2 -
unbind
1 -
Unified Customer Profile
1 -
UPB
1 -
Use of Parameters for Data Copy in PaPM
1 -
User Unlock
1 -
VA02
1 -
Validations
1 -
Vector Database
1 -
Vector Engine
1 -
Visual Studio Code
1 -
VSCode
1 -
Web SDK
1 -
work zone
1 -
workload
1 -
xsa
1 -
XSA Refresh
1
- « Previous
- Next »
Related Content
- Top Picks: Innovations Highlights from SAP Business Technology Platform (Q1/2024) in Technology Blogs by SAP
- Unlocking Full-Stack Potential using SAP build code - Part 1 in Technology Blogs by Members
- SAP Cloud Integration: Understanding the XML Digital Signature Standard in Technology Blogs by SAP
- Cloud BADI Implementation via Developer Extensibility in Technology Blogs by SAP
- SAP Analytics Cloud Planning - Converting data in Technology Blogs by SAP
Top kudoed authors
| User | Count |
|---|---|
| 11 | |
| 10 | |
| 7 | |
| 6 | |
| 4 | |
| 4 | |
| 3 | |
| 3 | |
| 3 | |
| 3 |