


- SAP Community
- Products and Technology
- Technology
- Technology Blogs by SAP
- Wildcards in HANA Parameters in SAP Analytic Desig...
Technology Blogs by SAP
Learn how to extend and personalize SAP applications. Follow the SAP technology blog for insights into SAP BTP, ABAP, SAP Analytics Cloud, SAP HANA, and more.
Turn on suggestions
Auto-suggest helps you quickly narrow down your search results by suggesting possible matches as you type.
Showing results for
Advisor
Options
- Subscribe to RSS Feed
- Mark as New
- Mark as Read
- Bookmark
- Subscribe
- Printer Friendly Page
- Report Inappropriate Content
02-13-2020
11:14 PM
Tables, charts, drop down lists and other types of controls are limited to a certain number of entries. For example, if we have 1,000 items to display in a chart, then only the top 500 would probably be displayed. Even if the top 500 items were displayed, then what would be the value of displaying 500 items?
Usually, we want to display so many items, because we want someone to select a value, and we want to show as many values as we can. However, this could be very daunting. For example, what if the list were customers, and there were thousands of customers? We could not show them all.
Usually, when someone want to select a customer, they have some limitations in the selection in mind. For example, West Coast customers. In this example, we are going to use products. Let's say that someone is interested in finding products that are related to Post. The difficult part would be limiting the list to products that simply contain Post, because the next person may be looking for Car.
Another consideration is where in the product description should this filter text appear? Should it be at the beginning, as shown below:
Maybe at the end of the description:
Or anywhere in the description:
As a developer, we are not always sure. Therefore, in this example, we will let the person enter any search string that they want and leave it up to them if it should be in the beginning, the end, or anywhere within the product description.
To create this application, we will use a model that we will create in SAP HANA. We will then create a SAP Analytic Cloud model to encapsulate this HANA data source using a Live Data Connection. Finally, we will create the Analytic Application to utilize this Live Data Connection model.
If you have not read my previous blog: Parameters in HANA Live Connection. Please read this first to become familiar with passing parameters to HANA data sources from SAP Analytic Designer applications.
Work in HANA
In HANA we are to create the following model:
If you don't have this data, then you can use any data that has at least one dimension and one measure. These two fields, Description is propagated up to the Semantics node. In the Aggregation node, Invoice is aggregated by a count and renamed to NUM_CARTS.
When the model is executed it will return two columns - DESCRIPTION and NUM_CARTS. Below is a partial data listing:
To pass a filter value from SAP Analytic Designer, we can create an Input Parameter to accept the value. In this example, the following input parameter is used:
The name of the parameter is IP_DESCRIPTION. Many developers will prefix their input parameters with IP_ to help them, and others easily identify the input parameters within their calculation views. The Parameter Type is set to Direct. We will not need to present a list of values or limit the entries to a list, therefore Direct is the best choice. It is also the most efficient of the parameter types. The default value is set to %, because this is the SQL wildcard character. This default value will allow the model to return all descriptions if no text is entered into the input parameter. The Data Type is NVARCHAR(50), because this is the data type of the description field.
After creating the Input Parameter it is time to use the input parameter in a filter expression. Click on the first node in your model where the dimension to filter first appears.
Then, double-click on the expression object in the Filters section of the Output section of the model perspective to open the Edit Filter Expression dialog, as shown below.
In the expression editor enter code similar to the following:
Where "DESCRIPTION" is the dimension that we are using, but you can replace it with the dimension that you are using. Now, when we execute the HANA model, we will be prompted for a value:
In this case, I entered POST in front of the percent sign. This should now return all descriptions that begin with the word POST:
Our work in SAP HANA is now finished, and we will move on to our SAP Analytic Cloud tasks.
SAP Analytic Cloud Model
To create the model in SAP Analytic Cloud, we begin by selecting Create>Model from the menu
For our data source we will Get data from a datasource, and then select Live Data Connection, as shown below:
After clicking on Live Data Connection, the Create Model From Live Data Connection dialog will be displayed
In this dialog, select SAP HANA as the System Type. For the Connection, select the connection that connects to your HANA system. If you do not know what this connection is, then please ask your administrator. For the Data Source, enter the name of the HANA model that we developed earlier. In my case, the HANA model is SAC_WILDCARD.
After clicking the OK button in the Create Model From Live Data Connection dialog, you will be placed in the Measures section of your model.
The measure NUM_CARTS is visible. If All Dimensions is clicked on, then the Description dimension should be displayed. To see the variable, click the wench in the menu, and then click Variables.
In this dialog the IP_DESCRIPTION variable can be seen, but we cannot modify it in any way. So we will simply click Cancel to dismiss the dialog, and then save the model. I saved the model as SAC_WILDCARD.
SAP Analytic Designer Application
Now that we have both our SAP HANA model and our SAP Analytic Cloud model, we are ready to create our Analytic Design application.
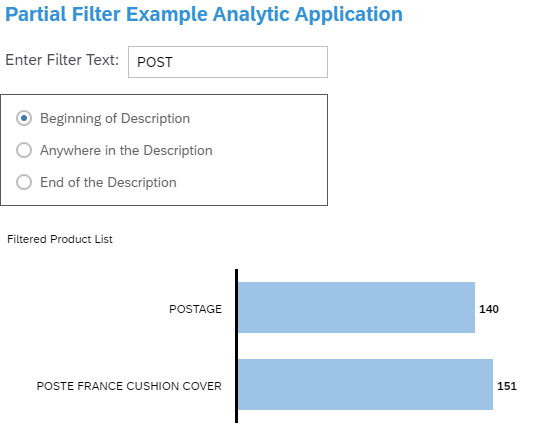
We will start by placing two text widgets at the top of our application. The first is for our application title and the next is for a label.
Since we will not refer to these two fields in the code of this application, then I will not give them better names then their default names. Next, we need to place an input field after the Enter Filter Text label. We will give this widget a name, which is inpFilter.
In this input field people will enter their search text. Since we are allowing them to enter partial text, we want them to be able to state where in the description the search text may appear. This will allow for them to have more accurate searches. To do this, we will place a radio button group just beneath the search field widgets.
In the builder, we can see that we have the following value-text pairs:
Since this is an instructional application, we will also place two more text fields just beneath the radio button group. One text field for a label and another to display the value that we are sending to the SAC_WILDCARD model. The new fields are displayed at the bottom of the screenshot below:
Name the text widget that will display the filter text: txtFilterText.
Now, the final widget is the chart that we will use the SAC_WILDCARD model to populate. When you insert the chart widget, the application will ask you for a data source. Locate and select the model that you created for this example. In my case, the model is SAC_WILDCARD.
After you select this data source, a Set Variables dialog will appear, as shown below.
In this dialog, you should see the default value that you have assigned the variable in the HANA model. In our case it is simply a percent sign. There are also two other check box options, which we will not bother with, as they have no affect on the behavior of this application. Click Set to use the data source.
Name the chart chrtProducts, and then select the dimension and measure from the Builder to populate the chart. Notice that all descriptions are displayed in the chart. Well, at least the Top n descriptions based on the measure. In this data source there are over 30,000 descriptions, and there is no way that they all can be displayed in a single chart.
Now comes the exciting part - Lets write the code. Enter the following text for the input control inpFilter:
Next, enter this same code for the radio button group. Now, when the text is changed the filter will be applied, and when the radio button group is changed the filter will be applied. If POST is entered in the inpFilter and
The line of code that sets the filter is
This code retrieves the data source for the chart, and then uses its setVariableValue method to set the value of the variable. It also implicitly refreshes the data source.
Now we can have list that can make 1,000's of values available and we can allow people to determine which subset of the 1,000's of values they want to see.
Usually, we want to display so many items, because we want someone to select a value, and we want to show as many values as we can. However, this could be very daunting. For example, what if the list were customers, and there were thousands of customers? We could not show them all.
Usually, when someone want to select a customer, they have some limitations in the selection in mind. For example, West Coast customers. In this example, we are going to use products. Let's say that someone is interested in finding products that are related to Post. The difficult part would be limiting the list to products that simply contain Post, because the next person may be looking for Car.
Another consideration is where in the product description should this filter text appear? Should it be at the beginning, as shown below:
Maybe at the end of the description:
Or anywhere in the description:
As a developer, we are not always sure. Therefore, in this example, we will let the person enter any search string that they want and leave it up to them if it should be in the beginning, the end, or anywhere within the product description.
To create this application, we will use a model that we will create in SAP HANA. We will then create a SAP Analytic Cloud model to encapsulate this HANA data source using a Live Data Connection. Finally, we will create the Analytic Application to utilize this Live Data Connection model.
If you have not read my previous blog: Parameters in HANA Live Connection. Please read this first to become familiar with passing parameters to HANA data sources from SAP Analytic Designer applications.
Work in HANA
In HANA we are to create the following model:
If you don't have this data, then you can use any data that has at least one dimension and one measure. These two fields, Description is propagated up to the Semantics node. In the Aggregation node, Invoice is aggregated by a count and renamed to NUM_CARTS.
When the model is executed it will return two columns - DESCRIPTION and NUM_CARTS. Below is a partial data listing:
To pass a filter value from SAP Analytic Designer, we can create an Input Parameter to accept the value. In this example, the following input parameter is used:
The name of the parameter is IP_DESCRIPTION. Many developers will prefix their input parameters with IP_ to help them, and others easily identify the input parameters within their calculation views. The Parameter Type is set to Direct. We will not need to present a list of values or limit the entries to a list, therefore Direct is the best choice. It is also the most efficient of the parameter types. The default value is set to %, because this is the SQL wildcard character. This default value will allow the model to return all descriptions if no text is entered into the input parameter. The Data Type is NVARCHAR(50), because this is the data type of the description field.
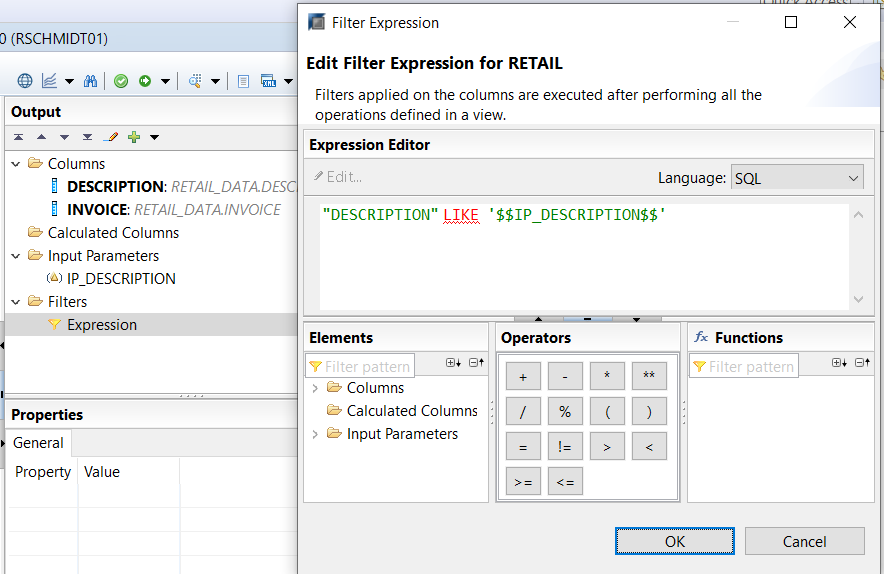
After creating the Input Parameter it is time to use the input parameter in a filter expression. Click on the first node in your model where the dimension to filter first appears.
Note: We always want to place filters as low as possible in any model.
Then, double-click on the expression object in the Filters section of the Output section of the model perspective to open the Edit Filter Expression dialog, as shown below.
In the expression editor enter code similar to the following:
"DESCRIPTION" LIKE '$$IP_DESCRIPTION$$'
Where "DESCRIPTION" is the dimension that we are using, but you can replace it with the dimension that you are using. Now, when we execute the HANA model, we will be prompted for a value:
In this case, I entered POST in front of the percent sign. This should now return all descriptions that begin with the word POST:
Our work in SAP HANA is now finished, and we will move on to our SAP Analytic Cloud tasks.
SAP Analytic Cloud Model
To create the model in SAP Analytic Cloud, we begin by selecting Create>Model from the menu
For our data source we will Get data from a datasource, and then select Live Data Connection, as shown below:
After clicking on Live Data Connection, the Create Model From Live Data Connection dialog will be displayed
In this dialog, select SAP HANA as the System Type. For the Connection, select the connection that connects to your HANA system. If you do not know what this connection is, then please ask your administrator. For the Data Source, enter the name of the HANA model that we developed earlier. In my case, the HANA model is SAC_WILDCARD.
After clicking the OK button in the Create Model From Live Data Connection dialog, you will be placed in the Measures section of your model.
The measure NUM_CARTS is visible. If All Dimensions is clicked on, then the Description dimension should be displayed. To see the variable, click the wench in the menu, and then click Variables.
In this dialog the IP_DESCRIPTION variable can be seen, but we cannot modify it in any way. So we will simply click Cancel to dismiss the dialog, and then save the model. I saved the model as SAC_WILDCARD.
SAP Analytic Designer Application
Now that we have both our SAP HANA model and our SAP Analytic Cloud model, we are ready to create our Analytic Design application.
We will start by placing two text widgets at the top of our application. The first is for our application title and the next is for a label.
Since we will not refer to these two fields in the code of this application, then I will not give them better names then their default names. Next, we need to place an input field after the Enter Filter Text label. We will give this widget a name, which is inpFilter.
In this input field people will enter their search text. Since we are allowing them to enter partial text, we want them to be able to state where in the description the search text may appear. This will allow for them to have more accurate searches. To do this, we will place a radio button group just beneath the search field widgets.
In the builder, we can see that we have the following value-text pairs:
1 Beginning of the Description
2 Anywhere in the Description
3 End of the Description
Since this is an instructional application, we will also place two more text fields just beneath the radio button group. One text field for a label and another to display the value that we are sending to the SAC_WILDCARD model. The new fields are displayed at the bottom of the screenshot below:
Name the text widget that will display the filter text: txtFilterText.
Now, the final widget is the chart that we will use the SAC_WILDCARD model to populate. When you insert the chart widget, the application will ask you for a data source. Locate and select the model that you created for this example. In my case, the model is SAC_WILDCARD.
After you select this data source, a Set Variables dialog will appear, as shown below.
In this dialog, you should see the default value that you have assigned the variable in the HANA model. In our case it is simply a percent sign. There are also two other check box options, which we will not bother with, as they have no affect on the behavior of this application. Click Set to use the data source.
Name the chart chrtProducts, and then select the dimension and measure from the Builder to populate the chart. Notice that all descriptions are displayed in the chart. Well, at least the Top n descriptions based on the measure. In this data source there are over 30,000 descriptions, and there is no way that they all can be displayed in a single chart.
Now comes the exciting part - Lets write the code. Enter the following text for the input control inpFilter:
// Apply Description Filter

// Get the radio button group selection

// Should be 1, 2, or 3

var intSelection = RadioButtonGroup_1.getSelectedKey();


// Create and itialize a string to hold filter text

var strFilter = "";


// Switch with radio button selection

if(intSelection === "1"){

	// Wildcard placed at end of filter text

	strFilter = inpFilter.getValue() + "%";

} else if (intSelection === "2"){

	// Wildcard placed at beginning and end of filter text

	strFilter = "%" + inpFilter.getValue() + "%";

} else if (intSelection === "3"){

	// Wildcard placed at beginning of filter text

	strFilter = "%" + inpFilter.getValue();

}

// Set filter text in txtFilterText

txtFilterText.applyText(strFilter);


// Set the variable value in the model

chrtProducts.getDataSource().setVariableValue("IP_DESCRIPTION", strFilter);
Next, enter this same code for the radio button group. Now, when the text is changed the filter will be applied, and when the radio button group is changed the filter will be applied. If POST is entered in the inpFilter and
Beginning of the Description is selected, then POST% will be passed.
Anywhere in the Description is selected, then %POST% will be passed.
End in the Description is selected, then %POST will be passed.
The line of code that sets the filter is
chrtProducts.getDataSource().setVariableValue("IP_DESCRIPTION", strFilter);This code retrieves the data source for the chart, and then uses its setVariableValue method to set the value of the variable. It also implicitly refreshes the data source.
Now we can have list that can make 1,000's of values available and we can allow people to determine which subset of the 1,000's of values they want to see.
- SAP Managed Tags:
- SAP Analytics Cloud, analytics designer
Labels:
2 Comments
You must be a registered user to add a comment. If you've already registered, sign in. Otherwise, register and sign in.
Labels in this area
-
ABAP CDS Views - CDC (Change Data Capture)
2 -
AI
1 -
Analyze Workload Data
1 -
BTP
1 -
Business and IT Integration
2 -
Business application stu
1 -
Business Technology Platform
1 -
Business Trends
1,661 -
Business Trends
88 -
CAP
1 -
cf
1 -
Cloud Foundry
1 -
Confluent
1 -
Customer COE Basics and Fundamentals
1 -
Customer COE Latest and Greatest
3 -
Customer Data Browser app
1 -
Data Analysis Tool
1 -
data migration
1 -
data transfer
1 -
Datasphere
2 -
Event Information
1,400 -
Event Information
65 -
Expert
1 -
Expert Insights
178 -
Expert Insights
281 -
General
1 -
Google cloud
1 -
Google Next'24
1 -
Kafka
1 -
Life at SAP
784 -
Life at SAP
11 -
Migrate your Data App
1 -
MTA
1 -
Network Performance Analysis
1 -
NodeJS
1 -
PDF
1 -
POC
1 -
Product Updates
4,577 -
Product Updates
330 -
Replication Flow
1 -
RisewithSAP
1 -
SAP BTP
1 -
SAP BTP Cloud Foundry
1 -
SAP Cloud ALM
1 -
SAP Cloud Application Programming Model
1 -
SAP Datasphere
2 -
SAP S4HANA Cloud
1 -
SAP S4HANA Migration Cockpit
1 -
Technology Updates
6,886 -
Technology Updates
408 -
Workload Fluctuations
1
Related Content
- Generate Custom Legal Certificates in SAP DRC in Technology Blogs by SAP
- Flattening an Object using Action Editor in Technology Blogs by SAP
- Create an xP&A Business Flow with SAP Analytics Cloud, SAP Datasphere & SAP Cloud Integration in Technology Blogs by SAP
- Cloud Integration: Manually Encrypt/Decrypt XML payload based on XML-Enc Standard in Technology Blogs by SAP
- Content is Key – SAP Mobile Start now supports SAP Analytics Cloud KPIs on Tiles & Widgets in Technology Blogs by SAP
Top kudoed authors
| User | Count |
|---|---|
| 13 | |
| 11 | |
| 11 | |
| 10 | |
| 9 | |
| 7 | |
| 6 | |
| 5 | |
| 5 | |
| 5 |